

INTRODUCTION
Based on the seminal work by Duverger (Reference Duverger1963; see also Cox Reference Cox1997), the standard explanation of the number of parties cross-nationally holds that social cleavages drive party system fragmentation, while electoral institutions limit the number of parties in more restrictive systems (e.g., single-member district plurality systems) and allow for greater party system fragmentation in more permissive systems (e.g., proportional representation). In line with seminal research in the social cleavage tradition (Lipset and Rokkan Reference Lipset and Rokkan1967; Rokkan Reference Rokkan1970), this model assumes that — conditional on electoral system permissiveness — diversity produces more parties. This model has been applied successively to a wide range of countries at both the national (e.g., Amorim Neto and Cox Reference Amorim Neto and Cox1997; Clark and Golder Reference Clark and Golder2006; Coppedge Reference Coppedge1997; Ordeshook and Shvetsova Reference Ordeshook and Shvetsova1994) and district (e.g., Geys Reference Geys2006; Singer and Stephenson Reference Singer and Stephenson2009) levels.
Owing to measurement difficulties that arise when operationalizing social cleavages cross-nationally, most studies focus on only one type of cleavage diversity that is (relatively) easy to operationalize: ethnic diversity. The use of ethnic diversity as a measure of total cleavage diversity has several obvious shortcomings. The most obvious is that ethnicity is but one aspect of cleavage diversity. Moreover, previous research has shown that the measure of cleavage diversity examined affects the conclusions we draw about the relationship between social cleavages and party system fragmentation (Stoll Reference Stoll2008). It is possible the impact of some cleavages on party system fragmentation differs from the impact of other cleavages.
This article begins to address this lacuna in the literature by exploring the impact of religious diversity on the number of parties cross-nationally. Although most research assumes the relationship between religious diversity and party system fragmentation is positive, there is reason to believe that this relationship may actually be negative. Due to resource constraints on religious leaders resulting from competition in the religious marketplace, religious leaders in religiously diverse countries will seek to preserve scarce resources and enhance their influence on policy by cooperating with other cleavage groups to support parties representing shared interests. Such cooperation ultimately reduces the fragmentation of the party system. Incorporating the effects of religious diversity into the now-standard Duvergerian model used by previous studies to explain party system fragmentation and testing it using a large cross-national data set of elections from countries around the world, I find that religious diversity is associated with lower levels of party system fragmentation in restrictive electoral systems, producing increases in fragmentation only in the most permissive systems.
In the next section, I explore the relationship between religious diversity and party system fragmentation in greater detail. Following that, I outline the research design employed to test the argument before moving to a discussion of the results. A final section concludes with thoughts for future research.
THE RELATIONSHIP BETWEEN RELIGIOUS DIVERSITY AND PARTY SYSTEM FRAGMENTATION
In their landmark study, Lipset and Rokkan (Reference Lipset and Rokkan1967; see also Rokkan Reference Rokkan1970) argued that modern party systems have their roots in the centuries-old conflicts that continue to structure societies in the present. In addition to the two types of cleavages arising from the industrial revolution — the urban-rural and class cleavages — Lipset and Rokkan identified two types of religious cleavages arising from the national revolution. One was a confessional cleavage pitting minority religious denominations in the periphery against the centralizing forces of established churches (as part of the larger cultural elite), while the other was a cleavage between the established churches and the developing nation-state, which sought to wrest control from religious authorities in order to establish its secular authority. The resulting party contestation along religious lines shaped the development of competitive party systems to a considerable extent in many countries (Caramani Reference Caramani2004; Ertman Reference Ertman, Van Kersbergen and Manow2009).
Following in this tradition, studies seeking to explain the number of parties cross-nationally have assumed that greater cleavage diversity yields more fragmented party systems. In nearly every instance, however, previous studies examining the determinants of party system fragmentation have only focused on ethnic diversity, due in part to convenience, though also due to difficulties in measuring all cleavages precisely from one context to another (Stoll Reference Stoll2008). With only few exceptions (e.g., Madrid Reference Madrid2005), these studies show that various measures of ethnic diversity tend to be associated with more fragmented party systems, conditional on the proportionality of the electoral system (Amorim Neto and Cox Reference Amorim Neto and Cox1997; Clark and Golder Reference Clark and Golder2006; Geys Reference Geys2006; Ordeshook and Shvetsova Reference Ordeshook and Shvetsova1994; Singer and Stephenson Reference Singer and Stephenson2009).
Those few studies that do include measures of religious cleavages do not focus on religion per se. For instance, Powell (Reference Powell1982) examined the effect of Catholic minority populations on legislative party system fragmentation. Other studies find a positive relationship between social diversity and party system fragmentation (Lijphart Reference Lijphart1999), though such effects may be non-monotonic and/or conditional on institutional factors (Potter Reference Potter2014; Stoll Reference Stoll2013). While this sort of attention to a broad group of cleavage variables — including religion — is a welcome development, assuming all cleavage diversity produces greater party system fragmentation may not be warranted. It could be that the impact of religious diversity on the number of parties differs from the effects of other social cleavages. For instance, in examining the robustness of the relationship between various measures of social diversity and party system fragmentation, previous research finds that variables measuring religious diversity have the “wrong” sign when compared to variables such as ethnic diversity (Stoll Reference Stoll2008; see also Lowery et al. Reference Lowery, van Witteloostuijn, Peli, Brasher, Otjes and Gherghina2013). Until now, studies have not asked whether these findings are genuine or mere aberrations from what we expect should be a positive relationship.
There may be reason to expect a negative relationship between religious diversity and party system fragmentation. According to the supply-side theory of religiosity, the vitality of religious organizations and religious devotion are determined by the patterns of competition among religious actors (i.e., the supply-side of religion). In markets (i.e., countries) where religious competition is regulated — whether through state subsidy for and/or sponsorship of particular religious organizations, or by legal restrictions on certain organizations/practices — religious organizations face little competition for survival, which leads to low levels of religious devotion and diversity. In markets where state support is absent, religious organizations must compete for adherents in order to survive. This competition leads religious organizations to work harder to attract adherents than religious groups in uncompetitive markets, which in turn leads to greater religious diversity (Berger Reference Berger1963; Finke and Stark Reference Finke and Stark1988; Iannaccone, Finke, and Stark Reference Iannaccone, Finke and Stark1997; Stark and Iannaccone Reference Stark and Iannaccone1994).
Whereas party system fragmentation in uncompetitive religious markets is restrained only by electoral systems and the other social cleavage structures, the competition for religious adherents characterizing competitive religious markets puts downward pressure on the number of viable parties. Unlike the institutionalized positions of religious leaders belonging to state-supported organizations that do not need to compete for adherents in order to survive, the influence of religious leaders — whether direct over policy or merely to preserve their autonomy over religious issues (Jelen and Wilcox Reference Jelen, Wilcox, Jelen and Wilcox2002, 317–319) — in competitive markets is not guaranteed, but rather determined by their market share (number of adherents). Instead of each religious group forming its own party, competition creates incentives for religious leaders in religiously diverse markets to cooperate with those sharing similar policy concerns (including both the leaders of other religious organizations and those concerned with other cleavage-group issues) in order to increase their political influence on religious issues. Similar to other types of organizations in competitive markets (e.g., van de Ven Reference van de Ven1976), such cooperation also preserves scarce resources that are better served in competition for adherents in the religious marketplace (Berger Reference Berger1963; Miller Reference Miller2002; Wagner Reference Wagner1997). As religious diversity increases, the incentives to cooperate increase as well, thereby reducing party system fragmentation.
The reduction in party system fragmentation resulting from such cooperation can take one of two forms. One is where religion becomes the dominant cleavage, as elections are turned into battles fought along confessional and/or religious-secular lines that rally support from other overlapping (as opposed to cross-cutting) cleavages; this, in turn, reinforces the primacy of religious cleavages (see Coleman Reference Coleman1956). The other is when religious cleavages are disarticulated and incorporated within the prevailing partisan divides. In these situations, religious leaders will seek to preserve their influence by finding ways in which confessional and/or religious-secular interests map onto existing issue dimensions (e.g., class, ethnic, etc.), and bargaining religious voters’ support for parties with similar interests in exchange for influence over issues of great import to religious voters (e.g., abortion, same-sex marriage, etc.). Ultimately, the choice between these two strategies is made by elites, who articulate the cleavages that best serve their electoral and policy interests (Enyedi Reference Enyedi2005; Przeworski and Sprague Reference Przeworski and Sprague1986; Torcal and Mainwaring Reference Torcal and Mainwaring2003). Because religious issues — often distinct from “normal” issues (e.g., Smith and Tatalovich Reference Smith and Tatalovich2003; Studlar, Cagossi, and Duval Reference Studlar, Cagossi and Duval2013; Tribe Reference Tribe1992), owing to the levels of conviction (e.g., Ryan Reference Ryan2014; see also Skikta Reference Skikta2010) and supernatural consequences for those involved (e.g., Grzymala-Busse Reference Grzymala-Busse2012; Stark Reference Stark1999; Stark and Finke Reference Stark and Finke2000) — are so fundamental to religious adherents, religious leaders will prefer the second strategy when religious issues are not the prevailing partisan divides because cooperation increases the chances that they will be able to influence policies concerning religion.
We can see several specific examples of this type of cooperation resulting from market pressures in previous literature. For instance, the Catholic Church only began to cooperate with and articulate the concerns of indigenous Mexicans — after years of ignoring their concerns — when the Church began to feel the threat to their position (religious and political) created by the increasing numbers converting to Protestant denominations (Trejo Reference Trejo2009). Catholic clergy also cooperated with opposition groups against authoritarian leaders in Latin American countries where they faced pressure from growing Protestant churches — but not where any such pressure was absent (Gill Reference Gill1994). Elsewhere, religious elites whose positions are threatened by increasingly secular publics have subsumed confessional cleavages under religious-secular cleavages, as with the formation of Christian Democratic Appeal in the Netherlands (Lucardie and ten-Napel Reference Lucardie, ten-Napel and Hanley1994), and religious-secular realignments in the United States (Layman Reference Layman2001) and Chile (Raymond and Feltch Reference Raymond and Feltch2014). One could even argue that the survival of Christian Democratic parties in an age of secularization has been achieved by compromise between religious and class/other cleavage groups (Duncan Reference Duncan2006; Elff and Rossteutscher Reference Elff and Rossteutscher2011), which has been true of their entire post-war histories (Kalyvas Reference Kalyvas1996; Kalyvas and van Kersbergen Reference Kalyvas and van Kersbergen2010). Additionally, religious leaders in diverse societies competing along a dominant versus minority religious cleavage often seek to incorporate overlapping ethnic and/or class issues into their struggles — e.g., establishment Protestants of British descent versus disadvantaged Catholic minority ethnic groups in Australia (Bean Reference Bean1999) and Canada (Blais Reference Blais2005).
While religious elites in diverse societies do have the option to support parties contesting elections separately from parties representing other cleavages, this strategy will result in wasted resources and reduced influence over religious issues in all but the most permissive electoral systems. If the electoral system is not sufficiently permissive to weaken oppositional forces by promoting a high degree of party system fragmentation among non-religious (class, ethnic, etc.) parties, then it will be in the best interests of religious party leaders to cooperate with leaders representing other cleavage issues in order to preserve resources and maximize policy influence. As a result, we should only see a positive relationship between religious diversity and party system fragmentation in the most permissive electoral systems: it is only in these systems where party system fragmentation will be sufficient enough that religious-secular and/or confessional parties will have the ability to compete with non-religious parties and/or one another for influence over policies regarding religious issues.
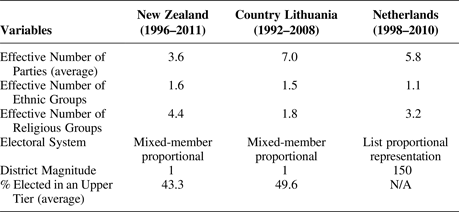
The products of these religious market forces can be seen more clearly by examining the case of New Zealand in comparative perspective. Although relatively homogeneous in terms of ethnic diversity,Footnote 1 New Zealand is religiously diverse, divided primarily among Protestant, Catholic, and secular lines, though with small-but-significant Hindu, Buddhist, and Muslim minorities as well (Vaccarino, Kavan, and Gendall Reference Vaccarino, Kavan and Gendall2011). Despite its religious diversity, and despite its use of a mixed-member proportional electoral system since 1996, religious-based parties have not found much success in New Zealand: though many Christian Democratic parties have contested elections in New Zealand, few have won more than a handful of seats (Barker and McLeay Reference Barker and McLeay2000), with no such party winning any representation since the 2008 elections. Instead, religious issues — to the extent that they feature in New Zealand politics — tend to map onto the class cleavage, with Protestant voters supporting the right-of-center National Party and Catholic and secular voters supporting the left-of-center Labor Party (e.g., Bean Reference Bean1988; Medeiros and Noël Reference Medeiros and Noël2013). Interpreted through the framework presented above, religious elites (and voters) have operated primarily within the traditional bounds of the two-party National-Labor party system because religious parties would not and have not featured very prominently in New Zealand party politics. If religious leaders were to compete for power primarily through an explicitly religious party, religious issues would not receive much expression. As a result, party system fragmentation in New Zealand is much lower than one would expect given its level of religious diversity (assuming the relationship between religious diversity and party system fragmentation was positive): in the six elections between 1996 and 2011 (all held under a mixed-member proportional electoral system), the effective number of electoral parties averaged just over 3.5.
In comparison with another country of roughly similar social and institutional structures, Lithuania, the impact of religious diversity on New Zealand's party system becomes more apparent. Information regarding both countries’ electoral systems, as well as the effective numbers of ethnic groups, religious groups, and parties’ vote shares appears in Table 1. Both countries award nearly equal parliamentary seat shares in the upper tier of their mixed-member proportional electoral systems. As seen in Table 1, both countries are — ethnically speaking — relatively homogeneous. Where the two countries differ — and differ quite significantly — is in terms of their respective levels of religious diversity. Unlike New Zealand, Lithuania is less religiously diverse, with Catholics comprising nearly 80% of the population; the next largest group is the non-religious, at just over 6% (Statistics Lithuania 2013). In this context, parties from several major party families — including Christian Democratic parties — have competed successfully for votes (Bakke Reference Bakke and Ramet2010; Ramonaité Reference Ramonaité and Jungerstam-Mulders2006). As a result, party system fragmentation in Lithuania is far greater than in New Zealand: the average effective number of parties in elections since the end of Communism exceeds seven, as seen in Table 1. Although not demonstrative, the clear difference in religious diversity between the two countries does at least suggest the possibility that religious diversity may be negatively associated with party system fragmentation.
An illustration of the impact of religious diversity on party system fragmentation

Data for the average effective number of parties are calculated from data included in Bormann and Golder (Reference Bormann and Golder2013). Information regarding each country's electoral system and district magnitude is also taken from Bormann and Golder (Reference Bormann and Golder2013). Data for the effective number of ethnic groups are taken from Fearon (Reference Fearon2003), while data for the effective number of religious groups are taken from Fearon and Laitin (Reference Fearon and Laitin2003).
When compared with the Netherlands — which is a country of relatively equal ethnic and religious diversity to that seen in New Zealand — it is the Netherlands’ much more fragmented party system that requires explanation (instead of the other way around). As seen in Table 1, the average effective number of parties in the Netherlands from 1998–2010 (roughly corresponding to the same period examined in New Zealand) was 5.8. Here, the disparity in party system fragmentation between the two countries may be due to a key difference between the two countries’ proportional electoral systems: district magnitude. While New Zealand's mixed-member proportional electoral system elects half of the available seats in its proportional tier to compensate for disproportional seat shares awarded in the lower tier, the Netherlands elects all 150 members of the House of Representatives in a single nation-wide constituency using proportional representation. Because of the interaction posited between district magnitude and social cleavages in Duvergerian models of party system fragmentation (e.g., Amorim Neto and Cox Reference Amorim Neto and Cox1997; Clark and Golder Reference Clark and Golder2006; Geys Reference Geys2006; Ordeshook and Shvetsova Reference Ordeshook and Shvetsova1994; Singer and Stephenson Reference Singer and Stephenson2009), it is possible that the number of parties in the Netherlands is greater than in New Zealand only because the Dutch electoral system is sufficiently permissive for religious diversity to sustain the higher levels of fragmentation seen in Table 1. Interestingly, however, party system fragmentation is lower in the Netherlands than in Lithuania despite the former's use of a highly proportional electoral system, suggesting the greater religious diversity in the Netherlands may explain the lower level of fragmentation there.
RESEARCH DESIGN
The discussion above suggests that, contrary to previous expectations, the relationship between religious diversity and party system fragmentation may be negative. In order to test this possibility, I examine a Duvergerian model of party system fragmentation incorporating the effects of social cleavages, electoral institutions, and the interaction of these two types of variables. In order to contribute to the already well-established literature on this subject, I incorporate religious diversity into a widely used model that is consistent with Duverger's argument (see e.g., Amorim Neto and Cox Reference Amorim Neto and Cox1997; Clark and Golder Reference Clark and Golder2006; Ordeshook and Shvetsova Reference Ordeshook and Shvetsova1994). This model takes the following form:
 $$\eqalign{ ENEP &= {{\rm \beta} _0} + {{\rm \beta} _1}Log(Ethnic\, Diversity) + {{\rm \beta} _2}LogM \cr &\quad + {{\rm \beta} _3}Log(Ethnic\, Diversity) \times LogM + {{\rm \beta} _4}Upper\, Tier \cr &\quad + {{\rm \beta} _5}Log(Ethnic\, Diversity) \times Upper\, Tier + {{\rm \beta} _6}Proximity \cr &\quad + {{\rm \beta} _7}ENPRES + {{\rm \beta} _8}Proximity \times ENPRES + {\rm \epsilon}} $$
The dependent variable, ENEP, is the effective number of parties in elections for the legislature (the lower house in the case of bicameral legislatures).Footnote
2
ENEP is measured as
 $1/{\sum\nolimits_{i = 1}^n p_i^2} $
, where n is the number of parties and p
i
is the proportion of votes won by the i
th party.Footnote
3
Data for this variable are taken from the “Democratic Systems Around the World, 1946–2011” data set collected by Bormann and Golder (Reference Bormann and Golder2013). Their data set includes all legislative elections between 1946 and 2011 from countries meeting minimal democratic criteria (namely, the criteria set out by Alvarez et al. Reference Alvarez, Cheibub, Limongi and Przeworski1996).Footnote
4
Because this data set includes a vastly larger number of countries and elections than previous research looking at the relationship between religious diversity and party system fragmentation, the analysis below provides a more generalizable test of the impact of religious diversity.
Ethnic Diversity is measured as the (logged) effective number of ethnic groups. Similar to ENEP, the effective number of ethnic groups is measured as
 $1/\sum\nolimits_{i = 1}^n {e_i^2} $
, where e
i
is the proportion of the population belonging to the i
th ethnic group. I use this measure of ethnic diversity in order to follow the practice of Clark and Golder (Reference Clark and Golder2006), who calculate the effective number of ethnic groups using data from Fearon (Reference Fearon2003).Footnote
5
Because some research has documented nonlinearity in the relationship between ethnic diversity and party system fragmentation (Raymond Reference Raymond2015), I use the logged effective number of ethnic groups.
This model includes two variables to capture the effects of electoral systems on party system fragmentation — LogM and Upper Tier — both of which are interacted with Ethnic Diversity. Following the longstanding observation that party system fragmentation tends to be greater in districts with larger district magnitudes (Taagepera and Shugart Reference Taagepera and Shugart1989), this model includes a variable measuring the (logged) mean district magnitude (LogM). Because Duverger's (Reference Duverger1963) hypothesis predicts that diverse social structures will produce multiparty systems only if electoral systems are sufficiently permissive (and vice versa), an interaction between Ethnic Diversity and LogM is included. To account for the fact that seats in some countries’ legislatures are awarded in multiple tiers (e.g., as a means to address distortion in the votes-seats ratio produced by the use of single-member districts, as in New Zealand), this model includes a variable measuring the percentage of seats in the lower house awarded in upper tiers (Upper Tier). Recognizing the effect of this variable may be conditioned by Ethnic Diversity in ways similar to LogM, I include an interaction between Upper Tier and Ethnic Diversity.
One concern with estimating the effects of electoral systems on party system fragmentation is the possibility the choice of electoral systems is endogenous (e.g., Boix Reference Boix1999; Colomer Reference Colomer2005; Leeman and Mares Reference Leeman and Mares2014). The most relevant concern here is that electoral systems are determined by the social structure — that countries employing more proportional electoral systems do so because their social structures are more diverse (Lundell Reference Lundell2010, 32–40; Rokkan Reference Rokkan1970). However, when looking at the differences in ethnic and religious diversity between countries with single-member districts and those with district magnitudes greater than one and/or upper tiers (using the sample of countries used in the regression analyses), it turns out that — contrary to most expectations (however, see Horowitz Reference Horowitz1985) — the most ethnically and religiously diverse countries are those with single-tier, single-member district electoral systems (significantly so at the p < 0.001 level). Although the data do not allow us to rule out the possibility that the choice of electoral system is determined by the fragmentation of the party system, if electoral system variables are endogenous, this would mean that any shared variance with religious diversity is attributed by the model to electoral system effects instead of religious diversity. This biases religious diversity coefficients in favor of the null hypothesis — suggesting that any negative effect of religious diversity will be under-estimated (i.e., erring on the side of caution).
To capture the impact of presidential systems on legislative party systems, this model includes Proximity (the time between the legislative election and the most recent presidential election), ENPRES (the effective number of presidential candidates in the most recent election), and an interaction between the two. Following the practice established by Amorim Neto and Cox (Reference Amorim Neto and Cox1997), Proximity is measured as the time elapsed between presidential and legislative elections using a continuous scale ranging from zero (for midterm elections — as well as non-presidential systems) to one (legislative and presidential elections are held concurrently). Data for this variable are taken in part from the “Democratic Elections Around the World, 1946–2000” data set collected by Golder (Reference Golder2005), with missing data collected by the author. ENPRES is calculated as
 $1/\sum\nolimits_{i = 1}^n {c_i^2} $
, where c
i
is the proportion of votes won by the i
th candidate. Data for this variable are taken from Bormann and Golder (Reference Bormann and Golder2013). The logic behind these variables is that the fragmentation of the presidential party system will increase legislative party system fragmentation, though primarily when presidential and legislative elections are held concurrently.
To determine the relationship between religious diversity and party system fragmentation, I simply incorporate a variable measuring the effective number of religious groups into the model above. To account for possible nonlinearity in the relationship between religious diversity and party system fragmentation similar to that observed with ethnic diversity, I use the logged functional form of religious diversity. Additionally, because the received wisdom derived from Duverger suggests that the effects of religious diversity may be conditioned by properties of the electoral system in ways similar to other cleavage variables like ethnic diversity, I include interactions between religious diversity and both LogM and Upper Tier. The revised model examined in the empirical analysis below takes the following form:
 $$\eqalign{ ENEP &= {{\rm \beta} _0} + {{\rm \beta} _1}Log(Religious\, Diversity) + {{\rm \beta} _2}Log(Ethnic\, Diversity) \cr &\quad + {{\rm \beta} _3}LogM + {{\rm \beta} _4}Log(Religious\, Diversity) \times LogM \cr &\quad + {{\rm \beta} _5}Log(Ethnic\, Diversity) \times LogM + {{\rm \beta} _6}Upper\, Tier \cr &\quad + {{\rm \beta} _7}Log(Religious\, Diversity) \times Upper\, Tier \cr &\quad + {{\rm \beta} _8}Log(Ethnic\, Diversity) \times Upper\, Tier + {{\rm \beta} _9}Proximity \cr &\quad + {{\rm \beta} _{10}}ENPRES + {{\rm \beta} _{11}}Proximity \times ENPRES + {\rm \epsilon}} $$
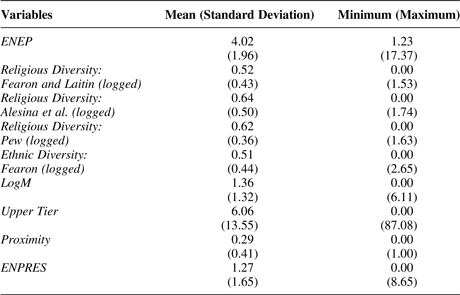
Because previous research has shown that the relationship between social diversity and the number of parties may depend on the measure used (Stoll Reference Stoll2008), I estimate three models, each using one of three different measures of religious diversity to determine the robustness of the findings using any one measure. The first measure of religious diversity is taken from Fearon and Laitin (Reference Fearon and Laitin2003), who create their measure of religious diversity using data from the Central Intelligence Agency World Factbook. A second variable uses religious fractionalization data from Alesina et al. (Reference Alesina, Devleeschauwer, Easterly, Kurlat and Wacziarg.2003). A third variable is created using data from the Pew Research Center (2014). Because the raw data taken from this study did not disaggregate the percentage of Christians into separate denominations, I supplemented this data set with other data from Pew Research Center (2011) measuring the percentage of each country belonging to Protestant, Catholic, and Orthodox traditions.Footnote 6 Descriptive statistics for these and each of the other variables are presented in Table 2.
Descriptive statistics

To estimate these models, I use ordinary least squares regression. Because the Bormann and Golder (Reference Bormann and Golder2013) data set includes multiple elections for some countries, which may lead to under-estimated standard errors, I use country-clustered standard errors. I do so for three reasons. First, this follows the practice of Clark and Golder (Reference Clark and Golder2006); by following their practice, the results presented here can be compared to those produced in their earlier study. Second, while the data set used here includes multiple elections in some countries, time-series methods are generally considered inappropriate due to the irregular intervals between election periods both within and across countries. Third, the estimates presented below are even more conservative than those using panel-corrected standard errors (in which the consecutive number of elections is treated as a unit of time), as well as models using bootstrapped standard errors (see the results presented in Appendix 1 and 2, respectively).
RESULTS
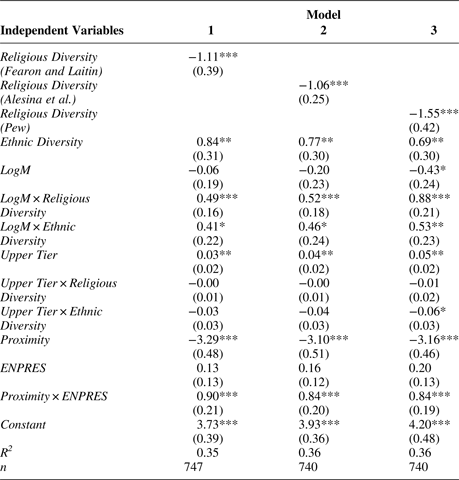
Parameter estimates for the three regression models are presented in Table 3. While the interpretation of interaction effects necessitates caution — requiring that we interpret the effect of one variable in the interaction conditional on the other — some preliminary conclusions can be gleaned from Table 3. When looking at the regression coefficients for each of the three religious diversity variables, which represent the relationship between religious diversity and party system fragmentation when LogM equals zero (i.e., countries where district magnitude equals one), we see that the coefficients are negative and statistically significant.Footnote 7 It is worth noting that the interaction between religious diversity and Upper Tier is small and statistically insignificant, which indicates that upper tiers do not have much bearing on the underlying relationship between religious diversity and party system fragmentation. This implies that, at least in single-member district systems, party system fragmentation decreases as religious diversity increases. Additionally, the coefficients for the interaction between religious diversity and LogM in each model are positive, implying that party system fragmentation increases (or at least that the negative association between religious diversity and party system fragmentation weakens) as district magnitude increases.
The relationship between religious diversity and party system fragmentation (ENEP)

*p < 0.10, **p < 0.05, ***p < 0.01, two-tailed tests. Entries are regression coefficients with robust standard errors clustered by country in parentheses.
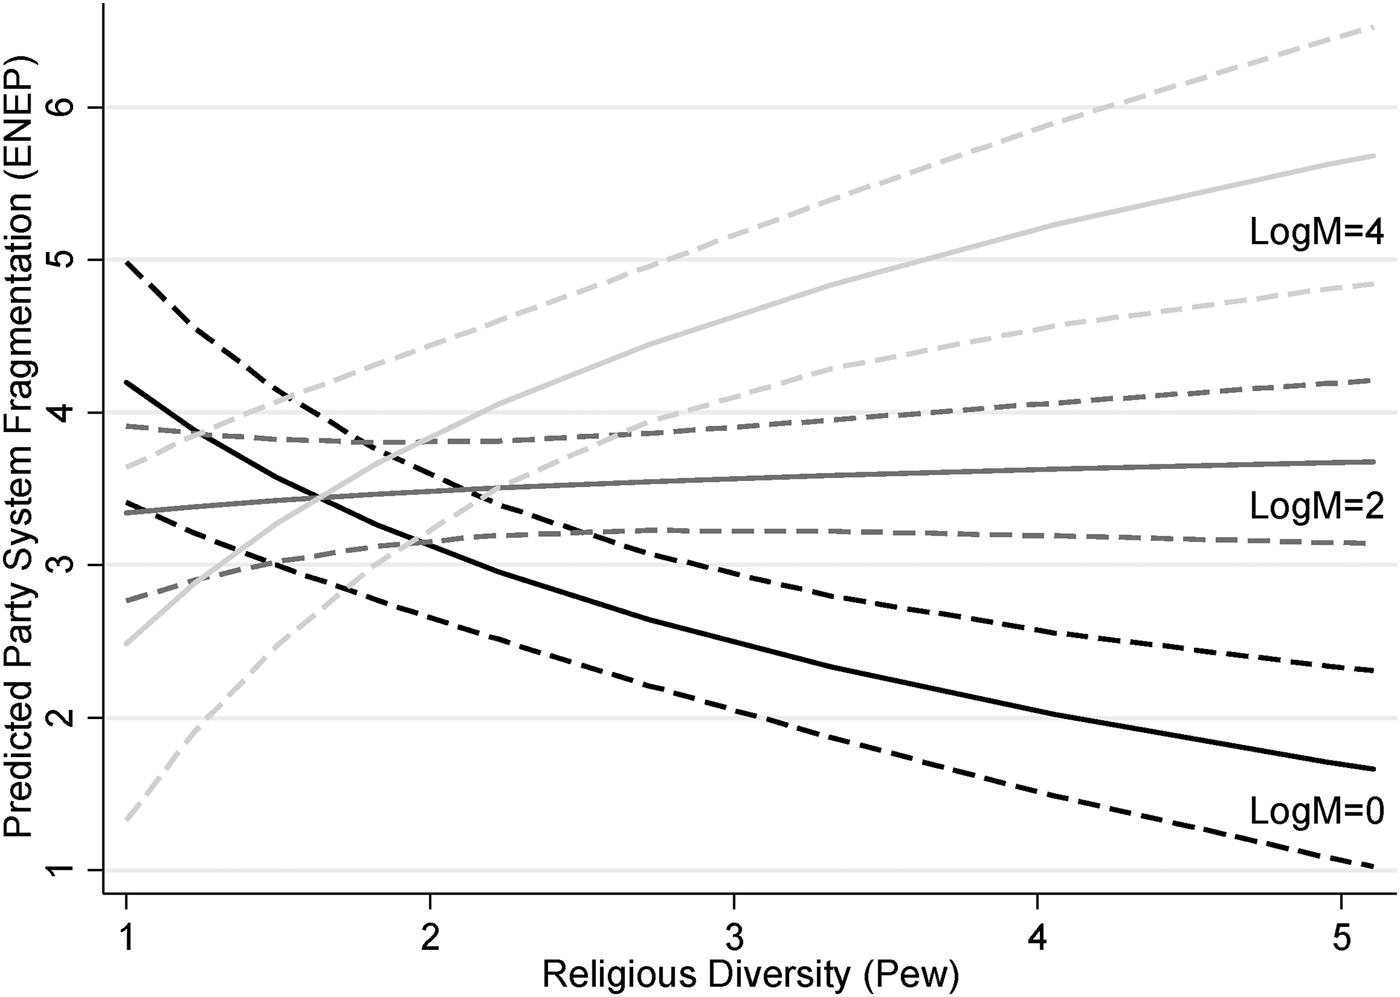
The precise estimated impact of religious diversity can be seen more clearly in Figure 1, which presents the relationships between religious diversity (using the Fearon and Laitin measure) and party system fragmentation at different levels of LogM: zero (i.e., single-member districts), two (roughly corresponding to mean district magnitudes of 7.4), and four (roughly corresponding to mean district magnitudes of 54.6).Footnote 8 This allows us to examine the conditional relationships between religious diversity and party system fragmentation, which in turn allows us to determine whether the negative relationship seen in single-member districts holds in more permissive electoral systems.
The Predicted Relationships between Religious Diversity (using the Fearon and Laitin measure) and Party System Fragmentation at Different Levels of District Magnitude. Notes: Black lines represent the relationship between religious diversity and party system fragmentation (ENEP) when LogM = 0 (i.e., district magnitude is 1); gray lines represent the relationship between religious diversity and party system fragmentation when LogM = 2 (corresponding to mean district magnitudes of ~7.4); while lines in light gray represent the relationship between religious diversity and party system fragmentation when LogM = 4 (corresponding to mean district magnitudes of ~54.6). Dashed lines are 90% confidence intervals. The religious diversity scale is back-transformed in order to show the nonlinearity of the relationship.

As the results presented in Figure 1 show, the negative relationship seen when looking at the coefficient associated with religious diversity is not limited solely to single-member district systems. In fact, this negative relationship holds in many proportional electoral systems as well, as evidenced by the weak negative relationship in countries with mean district magnitudes of 7.4 (LogM = 2). As represented by the predicted relationship when LogM equals four, it is only as we approach higher values of LogM that the relationship becomes positive and significantly different from the relatively flatter relationship seen at LogM values of two. Given that relatively few countries have electoral systems this permissive (LogM values greater than 2.8 fall into the 90th percentile of countries in this sample), this suggests that the relationship between religious diversity and party system fragmentation is negative in all but the handful of countries with highly proportional electoral systems.
In addition to the fact that the predicted relationship between religious diversity and party system fragmentation is negative in a large number of countries, the results in Figure 1 demonstrate that the estimated impact of religious diversity on party system fragmentation is quite powerful. Going from the lowest to the highest values of religious diversity in single-member district countries (i.e., LogM = 0), ENEP decreases by effectively 1.7 parties. While the discussion above shows that this relationship is tempered by the permissiveness of the electoral system, the results in Figure 1 demonstrate that not only is the relationship between religious diversity and the number of parties negative, but also that religious diversity has a significant constraining effect on the fragmentation of the party system.
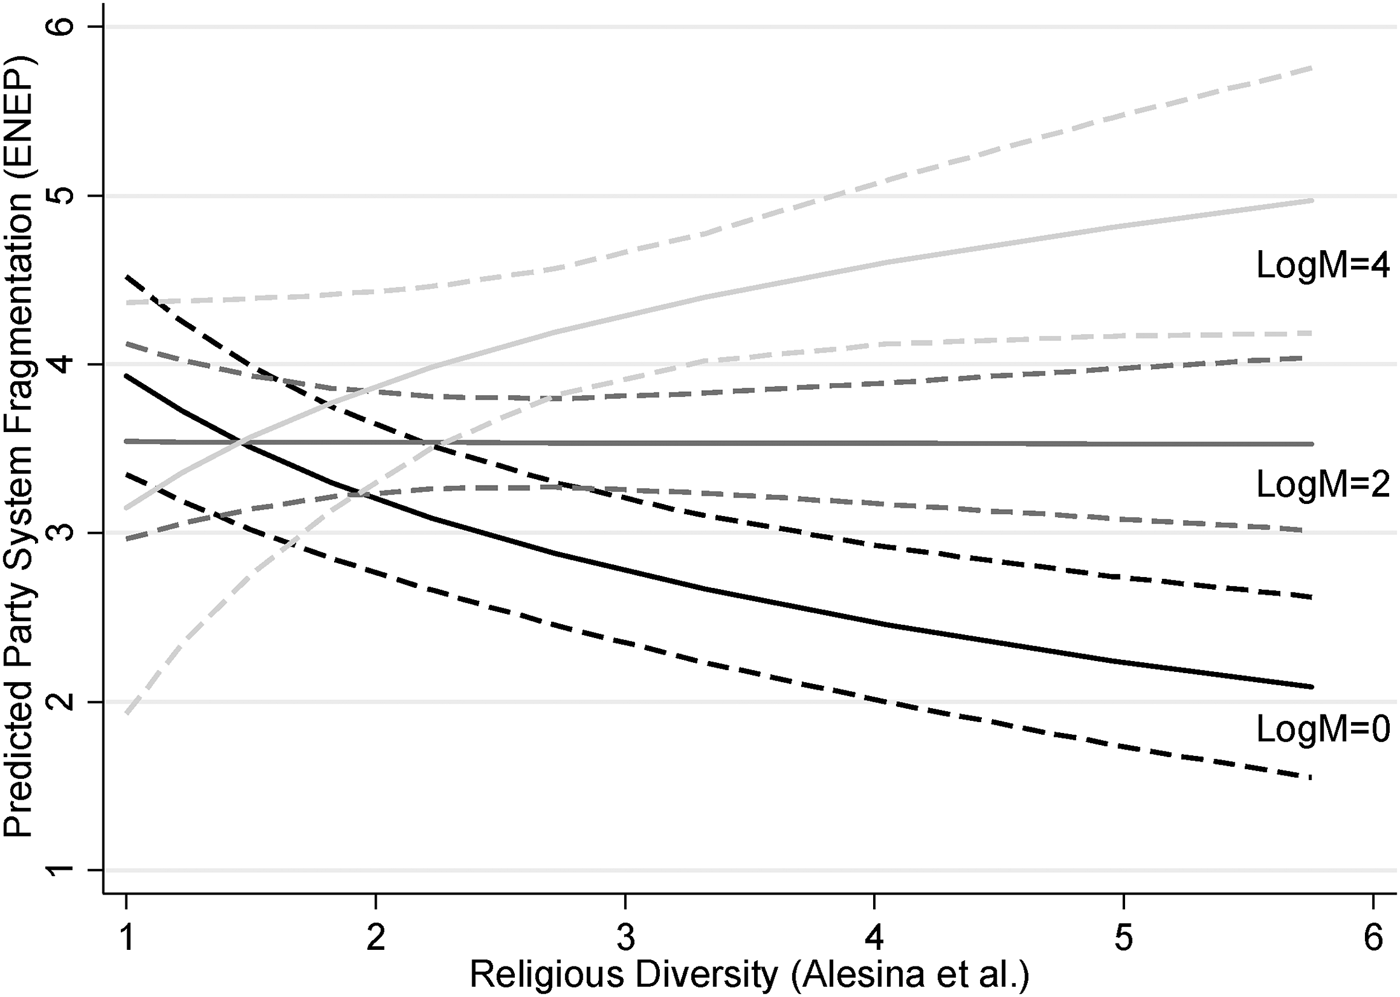
These findings are not due to the choice of religious diversity measure. As can be seen in Figures 2 and 3 — which present the conditional relationships between religious diversity and party system fragmentation when using the Alesina et al. (Reference Alesina, Devleeschauwer, Easterly, Kurlat and Wacziarg.2003) and Pew Research Center (2014) measures of religious diversity, respectively — the relationships presented in Figure 1 are quite robust. In both figures, the relationship between religious diversity and party system fragmentation is strongly negative in single-member district systems. This relationship nearly flattens out in Figure 2 for those countries where LogM equals two. While the relationship becomes positive in Figure 3 for those countries where LogM equals two, it is slightly positive at best. As in Figure 1, the relationship between religious diversity and party system fragmentation in Figures 2 and 3 is clearly positive only in those countries with highly permissive electoral systems.
The Predicted Relationships between Religious Diversity (using the Alesina et al. measure) and Party System Fragmentation at Different Levels of District Magnitude. Notes: Black lines represent the relationship between religious diversity and party system fragmentation (ENEP) when LogM = 0 (i.e., district magnitude is 1); gray lines represent the relationship between religious diversity and party system fragmentation when LogM = 2 (corresponding to mean district magnitudes of ~7.4); while lines in light gray represent the relationship between religious diversity and party system fragmentation when LogM = 4 (corresponding to mean district magnitudes of ~ 54.6). Dashed lines are 90% confidence intervals. The religious diversity scale is back-transformed in order to show the nonlinearity of the relationship.

The Predicted Relationships between Religious Diversity (using the Pew measure) and Party System Fragmentation at Different Levels of District Magnitude. Notes: Black lines represent the relationship between religious diversity and party system fragmentation (ENEP) when LogM = 0 (i.e., district magnitude is 1); gray lines represent the relationship between religious diversity and party system fragmentation when LogM = 2 (corresponding to mean district magnitudes of ~7.4); while lines in light gray represent the relationship between religious diversity and party system fragmentation when LogM = 4 (corresponding to mean district magnitudes of ~ 54.6). Dashed lines are 90% confidence intervals. The religious diversity scale is back-transformed in order to show the nonlinearity of the relationship.

Thus, the results presented here provide considerable support for the notion that the relationship between religious diversity and party system fragmentation is negative in all but the most permissive electoral systems. In contrast to the overwhelming majority of the literature dealing with the impact of social cleavages on the development of party systems, the results presented in this section suggest that not all-social cleavage diversity produces greater party system fragmentation. Consistent with expectations derived from the supply-side theory of religiosity, these results suggest that religious diversity leads to lower — not greater — party system fragmentation, regardless of the religious diversity measure used.
CONCLUSION
Most studies focusing on the development of party systems have assumed that greater cleavage diversity produces more fragmented party systems. This presumes, however, that higher levels of diversity lead to greater party system fragmentation for each type of cleavage. When testing this argument cross-nationally, however, most research has focused solely on one aspect of cleavage diversity: ethnicity. With few exceptions, other cleavages like religion have been excluded from Duvergerian models of party system fragmentation.
Building on the work of others voicing similar concerns (e.g., Stoll Reference Stoll2008), this article has shown that the neglect of other cleavages and the assumption that all cleavage diversity produces greater fragmentation merit re-examination. Consistent with expectations derived from the supply-side theory of religiosity, the relationship seen here between religious diversity and party system fragmentation cross-nationally is negative — and robustly so — in a large number of countries. While the relationship between religious diversity and party system fragmentation becomes positive in more proportional electoral systems, the fact remains that it is only in the most proportional electoral systems where greater levels of religious diversity produce more parties. This stands in sharp contrast to the expectations of the literature.
Despite the fact, the relationships presented here are robust to different measures of religious diversity, this article offers what is admittedly only a preliminary step toward a better understanding of the impact of social cleavages on the number of parties cross-nationally. Obviously, future research will need to continue to expand the focus beyond ethnic and religious cleavages. Additionally, although this article has advanced an argument as to why we might expect to see a negative relationship between religious diversity and party system fragmentation, this should not be the last word on this matter. Even if the findings presented here are confirmed by future research, more work is needed to test whether key aspects of the argument presented here are valid, or whether other forces better explain the relationships observed here. As part of this effort, the supply-side religiosity argument presented here should be subjected to scrutiny in other ways — for instance, testing the argument diachronically — and at different levels (e.g., at the district level rather than the national level). Additionally, more work studying how religious leaders cooperate with one another and with leaders from other cleavage groups as religious diversity increases and religious cleavages become entangled with other cleavages. Future research on this matter should examine under what conditions religious cleavages subsume other cleavages and under what conditions religious cleavages are subsumed in order to preserve religious leaders’ influence.
Appendix 1. Robustness Tests of The Relationship Between Religious Diversity and Party System Fragmentation (ENEP) — Panel-Corrected Standard Errors

Appendix 2. Robustness Tests of The Relationship Between Religious Diversity and Party System Fragmentation (ENEP) — Bootstrapped Standard Errors