

Public sector reform in South Africa since the end of apartheid has involved fundamental changes to bureaucracy's structure, administrative systems, personnel and relationship to elected officials and the public (Miller Reference Miller2005; Cameron Reference Cameron2009). One major reform has been the transformation of the South African Public Service into a bureaucracy that is broadly representative of the population (Department of Public Service and Administration 1995, 1998; Naidoo Reference Naidoo, Habib and Bentley2008; Ndletyana Reference Ndletyana, Habib and Bentley2008). Considerable success has been achieved increasing Black and female representation in the public service (Naidoo Reference Naidoo, Habib and Bentley2008; Cameron & Milne Reference Cameron, Milne, Maravic, Peters and Schroter2013). Policies to promote racial redress in the public sector, however, have come under sharp criticism by those who claim they undercut state capacity and performance (Luiz Reference Luiz2002; Johnson Reference Johnson2009; Leon Reference Leon2008; Edigheji Reference Edigheji2010). Surprisingly little systematic research has been done on how racial representation and gender representation impact governmental performance in South Africa. Empirical evidence from the literature on representative bureaucracy supports the African National Congress (ANC) government's contention that a more representative public service will improve the effectiveness of government departments (DPSA 1997; Ndletyana Reference Ndletyana, Habib and Bentley2008). Specifically, research on representative bureaucracy shows that increasing the level of bureaucratic representation of historically disadvantaged groups, which constitute the majority of the South African population, enables bureaucracies to become more effective at achieving goals that promote the interests of those same groups (Meier & Stewart Reference Meier and Stewart1992; Meier Reference Meier1993; Meier et al. Reference Meier, Wrinkle and Polinard1999; Keiser et al. Reference Keiser, Wilkins, Meier and Holland2002; Meier & Nicholson-Crotty Reference Meier and Nicholson-Crotty2006; Wilkins & Keiser Reference Wilkins and Keiser2006; Fernandez et al. Reference Fernandez, Malatesta and Smith2013).
This study examines the influence of demographic representation on the per cent of goals achieved by South African national departments, a measure of organisational effectiveness. Data were gathered from 60 national departments from 2006 to 2013. The findings show that as departments become more representative by hiring a higher per cent of Africans, of Coloureds, and of Indians, they achieve a higher per cent of goals. The findings for gender representation are more mixed and show that female representation among most racial groups is unrelated to organisational effectiveness.
In the next section, we provide an overview of steps taken to transform the South African Public Service into a more representative institution. The discussion then turns to the theory of representative bureaucracy, the theoretical foundation for the empirical analysis. Data and methods are presented next, followed by the findings. The study concludes with a discussion of its implications and limitations.
DEMOGRAPHIC REPRESENTATION IN THE SOUTH AFRICAN PUBLIC SERVICE
In 1989, five years prior to the first democratic elections, nearly two-thirds of public servants employed by the central government, self-governing homelands and provincial administration were Black (i.e. African, Coloured and Indian) (Naidoo Reference Naidoo, Habib and Bentley2008). However, Whites occupied a disproportionate share of higher paying managerial and professional positions, including 81% of those in the top eight income categories. Conversely, Africans filled 83% of the positions in the lowest pay category, labourers. Importantly, security and law enforcement departments were staffed primarily by Whites.
Since then, a range of legislative and regulatory changes has been introduced to promote representivity in the public service. The interim constitution of 1993 required a consolidated public service that is broadly representative of the population. The White Paper on the Transformation of the Public Service of 1995 called for transforming the public service from a predominantly White, male-dominated institution to one that is fully representative in order to legitimise the public service and ensure equitable service delivery (DPSA 1995). The Employment Equity Act of 1998 was designed to create an equitable environment through corrective steps that benefit those who have been historically disadvantaged and victimised by discrimination in the workplace. The White Paper on Affirmative Action in the Public Service of 1998 requires government departments to: develop staff profiles; establish targets and a comprehensive affirmative action plan; monitor progress toward achieving those targets; remove barriers to implementing affirmative action; and take steps to enhance skills and competencies of recently hired and promoted members of historically disadvantaged groups (DPSA 1998).
The ANC has pursued affirmative action in the public service on normative as well as instrumental grounds (Ndletyana Reference Ndletyana, Habib and Bentley2008). Normatively speaking, affirmative action serves to promote the constitutional values of representativeness and equality, which encompasses both the removal of laws resulting in discrimination and segregation and deliberate efforts to eradicate social and economic conditions that produce inequality and prevent the advancement of historically disadvantaged groups (Ndletyana Reference Ndletyana, Habib and Bentley2008). In addition, affirmative action, by promoting representivity, is expected to enhance the effectiveness of government departments (DPSA 1997). First, a representative public service is more legitimate in the eyes of citizens, thereby reducing hostility toward government and increasing citizen participation in public programmes (DPSA 1995, 1997; Ndletyana Reference Ndletyana, Habib and Bentley2008). Second, a more representative public service will be more empathetic to historically disadvantaged groups that compose the majority of the population and will have the proper skills and cultural competencies, including language proficiency, to understand and meet their needs (DPSA 1997; Ndletyana Reference Ndletyana, Habib and Bentley2008). Finally, a public service that employs a larger number of Blacks will be more politically responsive to policy changes aimed at ending racial discrimination and improving the livelihood of the largely poor Black majority (DPSA 1995, 1997).
Great strides have been made in creating a more representative public service (Naidoo Reference Naidoo, Habib and Bentley2008; Cameron & Milne Reference Cameron, Milne, Maravic, Peters and Schroter2013). In 1999, Blacks held almost 55% of the management positions in the public service, exceeding the initial target of 50% (Public Service Commission (PSC) 2000). By 2010, they filled 79% of management positions (63% African, 8% Coloured and 8% Asian), surpassing the revised target of 75% (PSC 2010). Women filled more than 18% of management positions in the public service in 2000 (PSC 2000), more than double the 8% figure from 1995 (Naidoo Reference Naidoo, Habib and Bentley2008). In 2010, the per cent of women in management positions had risen to 35%, still below the 50% target but a significant increase from 1999 (PSC 2010).
Despite this progress, affirmative action aimed at promoting representivity in the public sector has come under fire from various quarters. Edigheji (Reference Edigheji2010) reports widespread commentary about the deleterious effects of affirmative action on service delivery. Leaders of the Democratic Alliance, the main opposition party, and the trade union Solidarity have been particularly harsh critics of affirmative action (see Leon Reference Leon2008). Luiz (Reference Luiz2002) notes that representativeness in the public service is a legitimate goal, but warns that achieving it should not come at the expense of diminished state capacity. And Johnson (Reference Johnson2009) has called affirmative action ‘the greatest single disaster to overtake the new South Africa’, citing a litany of problems it has created for the public service, including a sharp decline in the quantity and quality of many public services, high vacancy and turnover rates, hiring and pay discrimination against White civil servants, chronic absenteeism, and low morale.
THE THEORY OF REPRESENTATIVE BUREAUCRACY
The literature on representative bureaucracy suggests a more representative South African Public Service can indeed enhance the effectiveness of government departments. The concept of representative bureaucracy has been central to the study of public administration for several decades. Most of the research has focused on developing and testing a theory of representative bureaucracy, with particular attention paid to the hypothesised link between passive (or demographic) representation and active representation (or bureaucratic decisions and outputs) (Kingsley Reference Kingsley1944; Mosher Reference Mosher1968; Krislov Reference Krislov1974; Meier Reference Meier1993). The theory posits that members of a social group undergo similar socialisation experiences and come to share political and social attitudes, which in turn influence their behaviour. When someone becomes a bureaucrat with discretionary authority, he or she will be inclined to act in ways that advance his or her interests and those of the social group to which he or she belongs. Based on this set of propositions, researchers have examined if and when passive representation leads to active representation.
A fairly extensive literature shows a positive link between passive and active representation for race (e.g. Meier & Stewart Reference Meier and Stewart1992; Hindera Reference Hindera1993; Meier Reference Meier1993; Selden Reference Selden1997; Meier et al. Reference Meier, Wrinkle and Polinard1999; Bradbury & Kellough Reference Bradbury and Kellough2008). Other studies, albeit far fewer in number, show a positive relationship between passive and active representation for gender, i.e. women (e.g. Keiser et al. Reference Keiser, Wilkins, Meier and Holland2002; Meier & Nicholson-Crotty Reference Meier and Nicholson-Crotty2006). Research suggests the impact of passive representation on active representation may be mediated by adoption of a minority representative role (Selden et al. Reference Selden, Brudney and Kellough1998) and can be partially offset by organisational socialisation (Selden Reference Selden1997; Dolan Reference Dolan2002). Importantly, scholars have identified a set of preconditions that must be met in order for passive representation to result in active representation (Meier & Stewart Reference Meier and Stewart1992; Meier Reference Meier1993; Keiser et al. Reference Keiser, Wilkins, Meier and Holland2002; Meier and Nicholson-Crotty Reference Meier and Nicholson-Crotty2006): (1) bureaucrats have discretion when implementing policies; (2) the policies bureaucrats implement are salient or significant to the demographic group in question; and (3) the decisions and actions of bureaucrats impact the demographic group in question. All three preconditions are met in the context of our study.
First, there is evidence of considerable administrative discretion in national departments in South Africa. Less than 10% of these departments received a clean audit in 2012 and 2013 (Auditor-General 2013). The root causes of non-compliance include weak and ineffective administrative controls, insufficient oversight and monitoring, and unauthorised, irregular and wasteful expenditures (Plaatjies Reference Plaatjies2013). These all point to ample if not excessive discretion, creating opportunities for active representation to occur.
Second, the policies of the ANC government appear to be highly salient to historically disadvantaged groups, particularly Africans, Coloureds and Indians, and to a lesser extent, women. The elaborate system of apartheid touched nearly every sphere of human activity in South Africa, engendering systematic and widespread discrimination, political disenfranchisement, and impoverishment of the Black majority. Since coming to power, the ANC has pursued a far-reaching policy agenda to undo the harm caused by apartheid by promoting racial redress and income redistribution, with Blacks and women as the main beneficiaries. The number of recipients of pensions and social grants targeting children and orphans, families, the unemployed, and the elderly in financial need increased from about 2·6 million to almost 14 million between 1994 and 2010 (Marais Reference Marais2011). Toward the end of the previous decade, access to water and electricity had increased dramatically, as had provision of public healthcare and education and construction of subsidised housing (Mlambo-Ngcuka Reference Mlambo-Ngcuka2007; ANC 2009; Earthlife Reference Earthlife2009; Mayende Reference Mayende, Kondlo and Maserumule2010). Primary, secondary and tertiary education have been racially integrated and investments in predominantly African schools increased (Marais Reference Marais2011). And a series of programmes under the mantra of Black Economic Empowerment (BEE) have been implemented to promote Black business ownership, skill development and training, although with mixed results (see Southall Reference Southall2007; Johnson Reference Johnson2009).
Critics within the Tripartite Alliance between the ANC, the Congress of South African Trade Unions (COSATU) and the South African Communist Party (SACP) have questioned the government's commitment to a developmental state, pointing to the adoption of policies such as the Growth, Employment and Redistribution (GEAR) Programme as a rejection of a developmental state in favour of a neoliberal conception of the state (see Maserumule Reference Maserumule, Kondlo and Maserumule2010; Marais Reference Marais2011). Moreover, major problems with governmental performance persist, as evident from reports of failing public schools and hospitals (Von Holdt & Murphy Reference Von Holdt, Murphy, Buhlungu, Daniel, Southall and Lutchman2007; du Preez Reference du Preez2013); the inability of state-owned enterprises like Eskom to keep up with demand for services (Pillay Reference Pillay, Pillay, Hagg and Nyamnjoh2013); the sluggish pace of: land redistribution and agrarian reform (Mayende Reference Mayende, Kondlo and Maserumule2010); service delivery failures in local governments resulting in rampant protests (Alexander Reference Alexander2010; Habib Reference Habib2013); and recurring instances of corruption by government officials (Marais Reference Marais2011; Habib Reference Habib2013; Zulu Reference Zulu2013). These developments notwithstanding, it is unmistakable that the ANC has pursued a broad set of policies intended to benefit historically disadvantaged groups, even if results have fallen decidedly short of expectations.
Third, we examine the effects of demographic representation across the entire workforce, not some select group of bureaucrats like senior managers or support staff far removed from citizens and with limited ability to make decisions that directly affect them. As a result, we believe the third precondition is also met.
Much of the empirical research on the link between passive representation and active representation conceives of the latter as decisions bureaucrats make or immediate outputs they produce (e.g. resource allocation decisions) that benefit members of a particular racial or gender group. A growing number of empirical studies have gone further, however, to explore the influence of passive representation on the effectiveness of public organisations and programmes. The findings from this research indicate increasing passive representation enables public organisations to become more effective at achieving certain goals or outcomes. For example, in public education, Meier et al. (Reference Meier, Wrinkle and Polinard1999) find that standardised test scores of minority and nonminority students increase as school districts hire more minority teachers (see also Meier & Stewart Reference Meier and Stewart1992; Meier Reference Meier1993). Keiser et al. (Reference Keiser, Wilkins, Meier and Holland2002) find that having more female teachers improves test scores for female students. Evidence of the link between passive representation and effectiveness can also be found in policy settings outside of education. Meier & Nicholson-Crotty (Reference Meier and Nicholson-Crotty2006) report that local jurisdictions that employ a larger number of female law enforcement officers are more effective at enforcing laws against rape. In the US federal procurement arena, Fernandez et al. (Reference Fernandez, Malatesta and Smith2013) find that increasing racial minority representation enables agencies to become more effective at achieving the legislatively mandated goal of promoting minority-owned small business participation in federal contracting. And in the area of child support enforcement, a gendered policy that largely benefits women, Wilkins & Keiser (Reference Wilkins and Keiser2006) find a positive link between female child support enforcement officers and child support payments.
In nearly all of the studies just cited, the link between passive representation and effectiveness is found where a programme or policy is meant to promote the wellbeing of an historically disadvantaged group represented in the bureaucracy (e.g. policies to increase educational attainment of minority students, laws to prohibit sexual assault, and programmes to encourage awarding of government contracts to minority- and women-owned businesses). From a principal-agent perspective, increasing passive representation of a racial or gender group that is the primary beneficiary of a policy serves to align the goals of policy-makers and bureaucrats, thereby reducing the likelihood of moral hazard and ensuring compliance (McCubbins et al. Reference McCubbins, Noll and Weingast1989; Wood & Waterman Reference Wood and Waterman1991). Also, policy implementation researchers have found that assigning responsibility for implementing a policy to those who are sympathetic to it increases the likelihood that implementation will proceed smoothly and with fidelity (Mazmanian & Sabatier Reference Mazmanian and Sabatier1983). In the South African context, where the regime has endeavoured to end discrimination and promote the wellbeing of historically disadvantaged groups, it is reasonable to conclude that increasing Black and female representation in the public service should enhance the effectiveness of national departments serving as agents of a democratically elected government. Under different conditions, such as during apartheid when public policies favoured Whites and men, increasing Black representation in the bureaucracy is unlikely to have increased effectiveness.
Lim (Reference Lim2006) and Hindera's (Reference Hindera1993) work sheds light on how greater representation of historically disadvantaged groups in the public service might enhance the effectiveness of these departments. They assert that bureaucrats can produce substantive benefits directly to members of their group as a result of advocacy or favourable treatment, but also through attitude congruence leading to more responsive bureaucratic behaviour; better communication between bureaucrat and client; and empathetic understanding of the needs and interests of clients when making administrative decisions. Lim goes further, however, to argue that bureaucrats can also produce indirect substantive benefits, including efforts by bureaucrats to monitor and mitigate bias expressed toward their group, and changes in the behaviour of clients, such as greater programme uptake and compliance with the law. As we noted above, some of these very same sources of direct and indirect substantive effects have been part of the ANC's thinking behind the transformation of the public service and how representivity will improve the effectiveness of government departments (see DPSA 1997; Ndletyana Reference Ndletyana, Habib and Bentley2008).
METHODOLOGY
In this section we provide a description of the data and methods used in this study.
Data
The unit of analysis is the department of the South African national government. From 2006 to 2013, 60 different national departments published annual reports to comply with the Public Finance Management Act of 1999. Nearly all of the data come from these reports, which contain information about a department's finances and workforce, human resources management practices, and performance. Audit results and Management Performance Assessment Tool (MPAT) scores were gathered from the Auditor-General (Auditor-General of South Africa 2013) and the Presidency (Presidency Republic of South Africa 2013), respectively.
A total of 245 annual reports were published from 2006 to 2013. The final sample used in the analysis includes 162 observations, with 83 observations dropped due to missing data on one or more variables. No major differences were found between observations included in the analysis and those that were dropped, although the former hired fewer whites (13% versus 18%) and women (52% versus 56%) than the latter and set more performance targets (164 versus 128).
Dependent variable
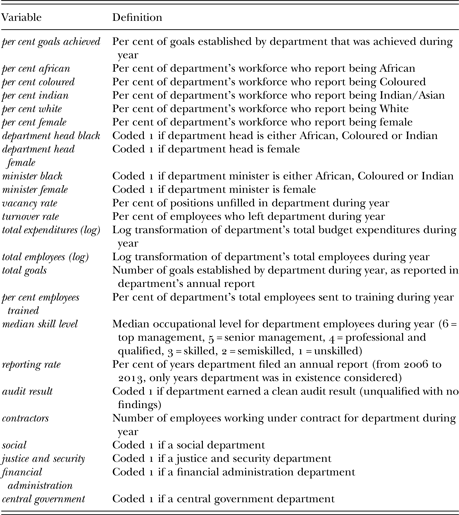
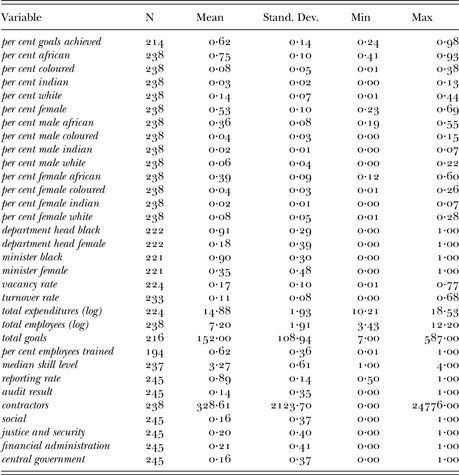
The dependent variable per cent goals achieved is defined as the per cent of goals or performance targets achieved in a given year, as reported in the ‘Programme Performance’ sub-section of a department's annual report (see Table I for a description of variables and measures). Most reports explicitly indicate whether or not a target was achieved. Where there was no explicit indication of the outcome, we used our judgement to decide if a target was achieved, not achieved, or if the matter remained unclear. Targets that were only partially achieved were treated as not achieved. The mean number of targets set by a department is approximately 152, and the mean number of targets achieved is approximately 94. The dependent variable per cent goals achieved has a mean of 0·62 with a standard deviation of 0·14 (see Table II for descriptive statistics).
Variables and measures

Descriptive statistics
Departments are given considerable latitude to develop their own performance targets and indicators so long as they reflect the targets and indicators in the government's Estimates of National Expenditures and the Annual Performance Plans; they should also be linked to departmental outcomes as well as to the strategic priorities of the government (Department of National Treasury 2012). Our qualitative assessment of these targets is that a large majority focus on programmatic outputs and outcomes; fewer pertain to activities like employee development, resource and technology acquisition, and analysis and planning, and even fewer appear to explicitly promote efficiency or legislative/regulatory compliance. As such, our dependent variable is a ‘competing values’ measure of organisational effectiveness, a commonly used approach to assessing organisational effectiveness or performance (Quinn and Rohrbaugh Reference Quinn and Rohrbaugh1983; Rainey Reference Rainey2014). The correlations between the dependent variable and two other measures of performance – the Auditor-General's (2013) annual audit result, a measure of accountability that captures stewardship of public funds, performance management practices, and compliance with key legislation, and the Department of Performance Monitoring and Evaluation's average Management Performance Assessment Tool (MPAT) score, which measures managerial practices and capacity – are only r = 0·25 and r = 0·31, respectively. This provides solid supporting evidence of construct validity for the dependent variable as a competing values measure of organisational effectiveness.
The dependent variable is an archival measure of performance. Bommer et al. (Reference Bommer, Johnson, Rich, Podsakoff and MacKenzie1995) find an overall correlation of r = 0·30 between archival and perceptual measures of performance; the correlation becomes much stronger (r = 0·71) when perceptual and archival measures tap the same dimension of performance. Importantly, archival measures appear less susceptible to common method bias and to producing spurious results (Meier & O'Toole Reference Meier and O'Toole2013).
Independent and control variables
The independent variables per cent african, per cent coloured, per cent indian and per cent white are measures of the per cent of a department's workforce who reports being African, Coloured, Indian/Asian and White, respectively. The variable per cent female is a measure of the per cent of a department's workforce who reports being female. We also use a set of variables measuring gender representation by race: per cent male african, per cent male coloured, per cent male indian, per cent male white, per cent female african, per cent female coloured, per cent female indian, and per cent female white. Group percentages are the standard measure of passive representation in the representative bureaucracy literature. We also include dummy variables indicating the race and gender of the department head, department head black and department head female, respectively.
A large number of control variables are included in the empirical analysis. We control for the race and gender of the department's minister, minister black and minister female, respectively. The variables total expenditures (log) and total employees (log) control for the influence of funding and staffing levels. Departments with more funding should have more financial and material resources and thus perform better (O'Toole & Meier Reference O'Toole and Meier1999; Rainey Reference Rainey2014). The total number of employees in a department may be indicative of the human resources available to it but also of its size and complexity, which increases coordination costs (Gooding & Wagner Reference Gooding and Wagner1985). Thus, the relationship between total employees (log) and the dependent variable could be positive or negative.
The variables turnover rate and vacancy rate are both expected to be negatively related to the dependent variable. A more stable workforce can lead to higher performance (O'Toole & Meier Reference O'Toole and Meier2003). High vacancy rates have been a persistent problem in the public service (Johnson Reference Johnson2009) and have been identified as a cause of poor performance (DPSA 2013).
The policy of affirmative action requires investments in training and education to enhance knowledge and expertise in the public service (DPSA 1998; Miller Reference Miller2005). Employee training can lead to higher productivity and innovativeness (Delaney & Huselid Reference Delaney and Huselid1996). The variable per cent training, therefore, should be positively related to the dependent variable. The variable median occupational level is included to control for the influence of employee skills and abilities. The South African Public Service employs a system of bands to classify employees according to their skills, abilities and compensation. Departments with a higher median occupational level are expected to be more effective at achieving their goals.
The variable total goals is expected to be positively related to the dependent variable. Goal setting can enable employees to perform more effectively by standardising work (Mintzberg Reference Mintzberg1979), and it can also increase motivation (Locke & Latham Reference Locke and Latham2002). We include the variable reporting rate, measured as the per cent of times a department submitted an annual report during the period from 2006 to 2013, since failure to report may be indicative of intent to conceal poor performance. We also include the variable audit result, which is measured using the audit score the Auditor-General of South Africa gave a department based on the latter's financial management and reporting practices, reporting of performance information, and compliance with key legislation. We expect this variable to be positively related to the dependent variable.
The analysis also includes the variable contractors to control for the number of employees working under contract. A report by the Auditor-General of South Africa (2013) found that government departments lacking skilled staff and struggling to fill vacancies increasingly turn to consultants and contractors to address the human capital deficit. Greater use of contractors, therefore, may enable departments to become more effective at achieving their goals. However, the same report notes frequent problems with planning, sourcing, managing and monitoring consultants and contractors, suggesting that this practice may have little or no beneficial impact.
The models include a series of dummy variables based on how the Auditor-General classifies departments according to policy area or cluster. The five categories are social services, justice and security, financial administration, central government, and economy and infrastructure (economy and infrastructure is the omitted category). Finally, dummy variables are includes for years 2006–2013 (2006 is the omitted year).
Modelling
Several estimation approaches are used, starting with Ordinary Least Squares (OLS) regression. Dependent variables that are proportions violate OLS assumptions, including the normality assumption and homoscedasticity assumption. As a result, we also use a Generalised Linear Model (GLM), using Newton–Raphson maximum likelihood optimisation (Papke & Wooldridge Reference Papke and Wooldridge1996). To test the robustness of the results, approximately 25% of the observations in the sample that appear only once were dropped to create an unbalanced panel, which is analysed using a Random Effects Model.Footnote 1 We use cluster robust standard errors (by department). Since the results are consistent across estimation approaches, only the OLS results are used to interpret substantive significance.
FINDINGS
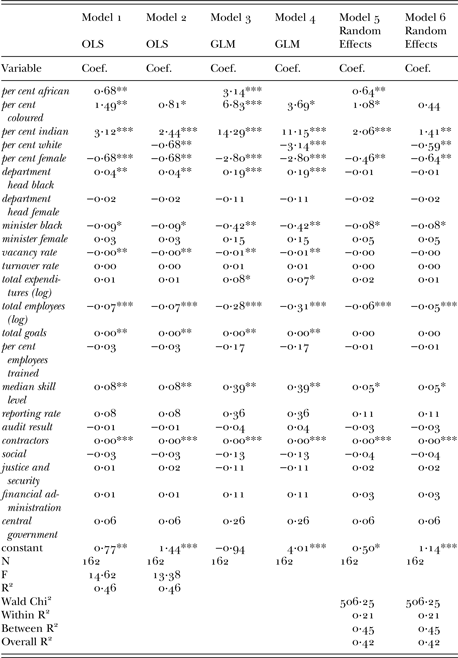
The discussion now turns to the findings from the empirical analysis. Models 1 and 2 and Models 3 and 4 show the OLS and GLM regression results, respectively (see Table III). The variables per cent african, per cent coloured and per cent indian are all positively related to per cent goals achieved and statistically significant. The variable department head black is also positively related to the dependent variable and statistically significant, although the size of the coefficient indicates a very small substantive effect. Conversely, per cent white is negatively related to per cent goals achieved. In regards to gender representation, per cent female, which captures female representation across all racial groups, is negatively related to the dependent variable in all four models.
Regression results, dependent variable = per cent goals achieved
*p < 0·10 **p < 0·05 ***p < 0·01.
Note: Models include dummy variables for years 2007, 2008, 2009, 2010, 2011, 2012 and 2013 (2006 omitted).
The unbalanced panel is estimated in Models 5 and 6 using a random effects estimator. The variables per cent african, per cent coloured and per cent indian continue to be positively related to per cent goals achieved and statistically significant, except for per cent coloured in Model 6. Having a department head that is Black is no longer related to the dependent variable. The variables per cent white and per cent female once again are negatively related to per cent goals achieved and statistically significant.
In short, Models 1–6 generally show that increasing the per cent of Africans, Coloureds and Indians working for a department results in an increase in the per cent of goals achieved; increasing the per cent of Whites, however, has a negative effect on the dependent variable. In addition, hiring a higher per cent of women, across all racial groups, reduces the per cent of goals achieved by a department.
Using the OLS regression results to interpret substantive significance, we find evidence of meaningful effect sizes. A one-point increase in the per cent of a department's workforce who is African, Coloured and Indian leads to a 0·68, 1·49 and 3·12 increase in the per cent of goals achieved by the department, respectively. A one-point increase in the per cent of a department's workforce who is White and who is female leads to a 0·68 and 0·68 reduction in the per cent of goals achieved by the department, respectively.
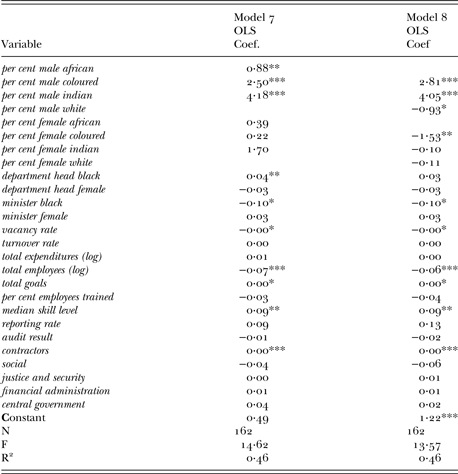
In Models 7 and 8, we break down racial representation by gender to develop eight new passive representation variables (see Table IV). The OLS regression results from these models show that per cent male african, per cent male coloured and per cent male indian are positively related to per cent goals achieved and statistically significant; per cent male white is negatively related to the dependent variable and statistically significant. These results are very similar to those from Models 1–6, which focused on overall racial representation regardless of gender. When we examine female representation among the different racial groups, however, we find a different pattern of results. Our measure of female representation across all racial groups, per cent female, was found to be negatively related to per cent goals achieved in Models 1–6. However, in Models 7 and 8, only per cent female coloured is negatively related to the dependent variable and statistically significant (Model 8). All other forms of female representation, including female representation among Africans, Indians and Whites, are unrelated to per cent goals achieved.
Regression results, dependent variable = per cent goals achieved
*p < 0·10 **p < 0·05 ***p < 0·01.
Note: Models include dummy variables for years 2007, 2008, 2009, 2010, 2011, 2012 and 2013 (2006 omitted).
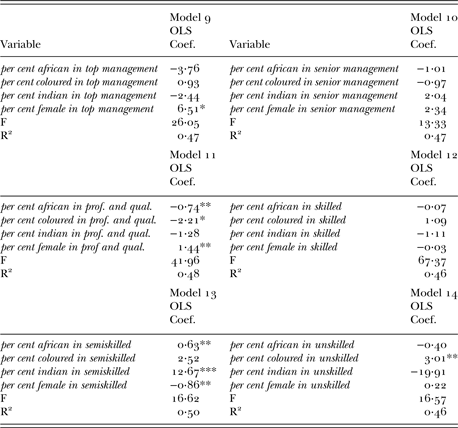
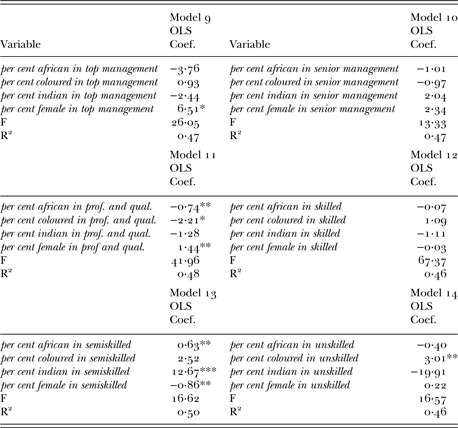
In Models 1–6 we analysed the relationship between different forms of racial and gender representation across the entire workforce and organisational effectiveness. Representation of a racial or gender group, however, can be the same in two departments but be distributed differently across levels of the bureaucracy. For example, in two departments, 70% of the workforce may be African, but in one department African employees are more evenly distributed across levels while in the other they concentrate more on the frontline. Is it possible that the concentration of members of a racial or gender group at a particular level of the bureaucracy also influences organisational effectiveness, holding overall representation of that group constant? To answer this question, we test Models 9–14, which include the same independent and control variables as those in Models 1, 3 and 5 (without per cent white) but add measures of the number of Africans, Coloureds, Indians and women in each of six echelons as a per cent of the total number of employees in a department. Six different echelons are examined: top management, senior management, professional and qualified, skilled, semiskilled and unskilled. For the sake of brevity, we report only the coefficients for these additional demographic variables (see Table V).
Regression results, with measures of the concentration of Africans, Coloureds, Indians and Women in six echelons (top management through unskilled), dependent variable = per cent goals achieved
*p < 0·10 **p < 0·05 ***p < 0·01.
Note: Models 9–14 include all independent and control variables in Models 1, 3 and 5 (see Table III).
Controlling for the influence of racial and gender representation across the entire workforce, we find that increasing the concentration of Africans, Coloureds and Indians at lower echelons has additional positive effects on per cent goals achieved. The percentages of all employees who are Africans in semi-skilled positions, Coloureds in unskilled positions, and Indians in semiskilled positions are positively related to the dependent variable and statistically significant (see Models 13 and 14). Conversely, increasing the per cent of all employees who are White in top management positions is positively related to the dependent variable and statistically significant (results not shown). The results for female representation in different echelons are more mixed, but as is the case with White representation, it appears that increasing the concentration of women at higher echelons has a positive influence on per cent goals achieved but not at lower echelons (see Models 9 and 11). In short, demographic representation across the entire workforce matters when it comes to achieving goals, but so does the concentration of members of racial and gender groups at particular levels of the bureaucracy.
These additional results may be indicative of the causal pathways by which passive representation of historically disadvantaged groups leads to active representation in the South African context. The fact that a higher concentration of Africans, Coloureds and Indians at lower echelons increases organisational effectiveness suggests the importance of having bureaucrats who represent the majority of the population in close proximity to citizens, where they can interact closely with them. Qualitative evidence we gathered from in-depth interviews with 15 officials in seven national departments corroborates this notion. In our interviews we found that bureaucrats’ ability to communicate with a diverse and multilingual citizenry in order to gain access to communities, understand their particular needs, and develop effective interventions, was the most frequently cited way in which a more representative public service leads to greater organisational effectivenessFootnote 2. Other commonly cited causal pathways include more positive responses by citizens to bureaucrats who look like them, share their culture and can speak their language (including greater cooperation and compliance with laws), and greater empathy and motivation on the part of bureaucrats to serve citizens who share their racial and cultural identityFootnote 3. These causal pathways are more likely to be activated at the point of contact between bureaucrats and citizens than at higher echelons, thus the additional positive effect that comes from concentrating African, Coloured and Indian employees at lower levels of the bureaucracy, holding levels of representation across the entire workforce constant. In contrast, agency socialisation can neutralise the influence of racial and ethnic socialisation at higher levels of the bureaucracy (Selden Reference Selden1997). This may explain why concentrating African, Coloured and Indian employees at the highest echelons provides no added benefit in terms of organisational effectiveness.
We now return to Models 1–6 but with the focus shifting to the control variables. The variables vacancy rate and turnover rate were expected to be negatively correlated with per cent goals achieved. We find that only vacancy rate is correlated with the dependent variable in the anticipated negative direction and statistically significant (see Models 1–4). Higher vacancy rates appear to reduce human capital needed by departments to be effective. Departments with higher levels of funding were expected to be more effective than those with less funding. We find limited support for this proposition, as Models 3–4 show total expenditures (log) is positively related to the dependent variable and statistically significant. The variable total employees (log) is negatively related to per cent goals achieved in Models 1–6 and is statistically significant. This variable also has the largest standardised coefficient (0·60, not shown) in Models 1 and 2. Departments that employ larger numbers of employees appear to be more structurally complex and difficult to manage.
The results from Models 1–6 provide support for the proposition that employee skills contribute to goal achievement. The variable median skill level is positively correlated with per cent goals achieved in Models 1–6 and statistically significant. We find some evidence that goal setting improves a department's ability to achieve its goals, as total goals is positively correlated with per cent goals achieved in Models 1–4 and statistically significant. Departments that can formulate a greater number of goals may have more structured tasks that allow for standardisation. Having more goals may also have a positive effect on motivation. We also find that the variables reporting rate and audit result and the series of dummy variables for a department's policy area have no apparent effect on the dependent variable.
Finally, we find that the variable contractors is positively related to per cent goals achieved and statistically significant. Having more employees working under contract enhances a department's ability to achieve its goals. Officials in two departments indicated that employees who accept severance packages tend to be among the most qualified and best performing as well as the ones most likely to become contractors and consultants. Our findings seem to bear this out.
We performed several regression diagnostic tests and failed to find evidence of a problem with multicollinearity or heteroscedasticity in Models 1–4.Footnote 4 In addition, excluding several leverage points from the regression models has no meaningful effect on coefficients or statistical significance levels. We also tried several different model specifications to see if additional control variables in Models 1–6 would influence the results. These additional variables include: the average MPAT score across all performance areas; a dummy variable indicating if a department received a clean score (unqualified with no findings) on both the usefulness and reliability of its performance data; and the per cent of employees in a department who were in high-level administrative positions (top management and senior management echelons). Adding these additional controls did not influence the results from Models 1–6 in any meaningful way.Footnote 5
Some concerns have been expressed about systematic measurement error in the reporting of goals achieved to give a more positive impression of how departments are performing. If there were systematic measurement error of this sort in the dependent variable, it would bias the regression constant but not bias the coefficients (Wooldridge Reference Wooldridge2009). If measurement error in the dependent variable is random instead of systematic, it would lower the R 2 and increase standard errors but again it would not bias the coefficients (Berry & Feldman Reference Berry and Feldman1985). In short, even if this concern about measurement error turns out to be true, it would not influence our findings about how racial and gender representation are related to organisational effectiveness.
CONCLUSION
The transformation of the South African Public Service into a more representative bureaucracy has been a worthy achievement, having advanced the constitutional values of equality and representativeness and removed institutional constraints that denied historically disadvantaged groups opportunities to serve in government. However, transformation efforts in the public service, particularly affirmative action, have been controversial in that some observers believe they have precipitated the departure of large numbers of highly skilled and educated – and mostly White – bureaucrats, thus undermining the capacity and performance of the public service. This view, which has its merits, has persisted despite evidence that the public service prior to transformation was not as competent and skilled as many assume, suffered from acute staff shortages, and was risk averse and resistant to change (see Posel Reference Posel1999; Miller Reference Miller2005).
This study's findings strongly suggest that the value of representative bureaucracy in South Africa goes beyond its symbolic worth and role in promoting equality and representativeness. We find that greater representation of Africans, Coloureds and Indians in the public service, when controlling for the influence of many other factors, improves organisational effectiveness of national departments tasked with implementing a broad set of policies to achieve racial redress and alleviate poverty. These findings corroborate what the theory of representative bureaucracy predicts regarding the link between passive and active racial representation (Meier Reference Meier1993; Keiser et al. Reference Keiser, Wilkins, Meier and Holland2002; Bradbury & Kellough Reference Bradbury and Kellough2008; Wilkins & Williams Reference Wilkins and Williams2008) and are consistent with previous findings showing that as representation of historically disadvantaged groups increases, so does the likelihood of public organisations achieving goals that promote the interests of those groups.
Importantly, we find that when holding constant African, Coloured and Indian representation, increasing the concentration of employees from these historically disadvantaged groups in lower echelons increases organisational effectiveness even further, perhaps by creating a critical mass of bureaucrats who are better able to communicate with the majority of the population and who have greater empathy for them. Conversely, increasing the concentration of White employees in higher echelons actually increases organisational effectiveness. Indeed, additional results indicate that increasing White representation just among top managers and senior managers leads to a higher per cent of goals achieved by these departments (results not shown). During the early years of transformation, White bureaucrats were assumed to be less politically responsive and more likely to resist the policies of the new ANC government (DPSA 1995, 1997). If that indeed was the case then, it no longer appears to be the case today. Our discussions with officials in national departments revealed that racial identity has minimal influence on the political responsiveness of bureaucrats to elected officials. This obviates the need for hasty transformation of the highest levels of the public service where Whites are still overrepresented.Footnote 6
Our findings regarding gender representation are mixed and mostly inconclusive. While we find that increasing female representation across all racial groups makes a department less effective at achieving its goals, the subgroup analysis reveals that only female representation among Coloureds is negatively related to organisational effectiveness. All other categories of female representation by race – including the per cent of African, Indian and White women – are unrelated to the dependent variable. As noted above, the link between passive and active representation has been harder to establish for women than for race (Meier Reference Meier1993; Keiser et al. Reference Keiser, Wilkins, Meier and Holland2002), and some studies have even found a negative relationship (e.g. Fernandez et al. Reference Fernandez, Malatesta and Smith2013). These findings, therefore, are in line with previous research.
There are several possible explanations for why passive female representation in general does not lead to active representation in the South African Public Service. First, the ANC's policies may not be sufficiently salient for women as they are for Blacks as a group, regardless of gender, or for Black men. The struggle against apartheid was first and foremost one against racial discrimination and colonialism. Lack of saliency may very well account for why we find limited evidence of active representation when it comes to women of different races (see Keiser et al. Reference Keiser, Wilkins, Meier and Holland2002). Second, a growing body of evidence shows that women often fail to advocate for the interests of other women when working in male-dominated environments where biases against women prevail (Ellemers et al. Reference Ellemers, Heuvel, Gilder, Maass and Bonvini2004; Garcia-Retamero & López-Zafra Reference Garcia-Retamero and López-Zafra2006). Finally, bias against women may be more socially acceptable than bias against racial groups, making it less acceptable for a woman to advocate for other women than it is for someone to advocate for members of his or her own racial group (Nosek et al. Reference Nosek, Banaji and Greenwald2002).
We conclude by discussing some of the limitations of this study. The findings should be generalisable to national departments in South Africa based on the representativeness of our sample. However, the empirical results may vary at the provincial and local levels where governmental functions, availability of material and human resources, and even political agendas and policy goals may be different than at the national level. Second, it is important to note that this study is not an ex post analysis of the impact of affirmative action on the performance of the public service. Data for the study only go back to 2006, a number of years after the policy of affirmative action had been introduced. Performance data were not systematically collected and reported prior to 2006, precluding a before-and-after analysis. The influence of racial and gender representation on organisational effectiveness may have been much weaker during the early, more tumultuous years of transformation.
Finally, we have met the necessary theoretical preconditions for establishing the link between passive and active representation, carefully specified our models to control for the influence of confounding variables and minimise omitted variable bias, relied on longitudinal data that are better suited for drawing causal inferences than data from a single point in time, employed the appropriate statistical estimation techniques for longitudinal data in order to reduce bias in our estimates, and provided corroborating qualitative evidence that identified underlying causal pathways. As a result, we feel we can make causal interpretations of our regression estimates. Nevertheless, some care should be taken in interpreting the findings from this study.