


INTRODUCTION
An experimental unit is the portion of experimental material to which a treatment is applied (Gomez & Gomez Reference Gomez and Gomez1984). The experimental unit lays the foundation for the definition of experimental error, which is defined as variation among observations that are treated alike. Correctly defined and estimable experimental error is the key element of the statistical analysis of experimental data collected during the study.
In an animal study, an experimental unit may consist of a single animal or a group of animals housed in the same pen, paddock or pasture. If the experimental unit comprises only one animal, the experimental design and the forthcoming statistical analysis are usually straightforward. Yet, in many cases, natural housing practices would necessitate experimental units with several animals. This usually leads to a low number of experimental units and a poor estimate of the underlying experimental error. Splitting the experimental units after the experimentation is usually ruled out by a conceivable correlation of individual responses of animals within experimental units.
Lucas (Reference Lucas1948) was among the first to discuss the problem of experimental units in experiments where animals were housed in pens. He defined group feeding as the practice of placing two or more animals in a single pen and feeding them from one trough. He concluded that the real problem was the size of the groups and the number of groups per treatment. Moreover, since correlated observations contain less information than uncorrelated ones and since the responses of individual animals within the same pen often correlate, he considered it wise to keep the size of a pen small and increase the number of pens. A review of papers published over the period 2004–07 showed that this recommendation has been well followed, especially in experiments on lambs, pigs and chickens (e.g. Swamy et al. Reference Swamy, Smith and MacDonald2004; Kiker et al. Reference Kiker, Salisbury, Green and Engdahl2005).
During the last few decades, discussion on the practical problems associated with the correlation of individual responses of animals within pens and the low number of pens per treatment has persisted in the literature and several recommendations have been given. For example Robinson et al. (Reference Robinson, Wiseman, Uden and Mateos2006) stated that, if animals were group fed, feed intake should be analysed using a pen as an experimental unit but, if the animals were weighed separately, weight gain could be analysed with a single animal as an experimental unit. A similar method for the analysis of blood parameters was also proposed.
From a statistical point of view it is clear that, if the individual responses of animals are correlated within pens, the pen should be seen as an experimental unit. On the other hand, if the individual responses are not, or only slightly, correlated within the pens, a single animal can be used as an experimental unit. In the statistical literature, the correlation of individual responses of subjects within experimental units is usually referred to as intraclass correlation (ICC). The key issue is to establish whether ICC is present or not, because this fact determines both the course of experimental design and statistical analysis. The key problem is that information on ICC is needed at a very early stage of designing a new experiment. To obtain such information on animal experiments, previously performed and reported experiments need to be examined.
Sometimes it is easy to observe the presence of ICC, e.g. measuring conflicts between animals in an experiment on two animals in the same pen (e.g. Korhonen et al. Reference Korhonen, Niemelä and Jauhiainen2001). In other instances the presence of ICC can be blurred, e.g. if there are dozens of animals housed in the same pen and innate behaviour, type of feeding or nature of the pen are not the main focus. Researchers have met the same kind of challenge in other fields of research too. Many school-based smoking prevention studies employ designs in which schools or classrooms are assigned to different treatments while observations are made on individual students (Siddiqui et al. Reference Siddiqui, Hedeker, Flay and Hu1996). In such studies there may be several reasons why individual responses correlate within cluster-levels. In such studies careful heed of ICC has proved to be useful. ICC has also proved to be of use in sample-size calculations (Donner Reference Donner1992).
In the current study, previously collected data were employed to obtain information on the presence and extent of ICC in experiments with suckler cows. Methods for estimating the size of ICC and its impact on the proper analysis of experimental data were considered. Methods were based on mixed models, techniques and simulation. The results should be of use in the design of new experiments on suckler cows. The methods used are easily extendable to other sectors of animal experimentation.
MATERIAL AND METHODS
Group feeding trials
Six experiments were re-analysed to examine the extent of ICC in studies with suckler cows. These experiments were originally carried out for comparing different housing conditions, feeding strategies or feeding frequencies. They were conducted at the Tohmajärvi Research Station in Eastern Finland (62°20′N, 30°13′E). Three experiments were carried out on cows and their calves, while the rest were conducted on bulls. The principal practice used in the experiments was to place eight animals in a pen of 74 m2 made up of 53 m2 of bedding area and 21 m2 of passage. Detailed information on the animals, experimental designs, treatments and measurement techniques used is available in Manninen et al. (Reference Manninen, Saarijärvi, Huhta, Jauhiainen and Aspila2004), Manninen et al. (Reference Manninen, Virkajärvi and Jauhiainen2005) and Manninen et al. (Reference Manninen, Sormunen-Cristian, Jauhiainen, Sankari and Soveri2006).
The re-analysis included the following six categories of variables:
(1) weight gain and final weight of the cows,
(2) body condition score (cows only),
(3) blood samples: urea, Hb, long-chain fatty acid, total protein, albumin (one experiment with cows),
(4) quality of meat (pH, tenderness, taste, consistency; one experiment with bulls),
(5) behavioural data (different behavioural categories, one trial), and
(6) initial and final weight of the calves.
Descriptive statistics of the response variables are presented in Table 1.
Descriptive statistics of response variables in six experiments (mean±s.d.). Experiments 1–3 were conducted on cows and their calves, experiments 4–6 were carried out on bulls

NA=not available.
The statistical model used in the re-analysis was:

where y ijk is the observed value of the response variable for the kth animal in the ith treatment in the jth pen; μ the overall mean; αi the fixed effect of the ith treatment; βij and εijk are uncorrelated random pen and animal effects with zero means and variances σpen2 and σ2, respectively. All the analyses and the estimation of the variance components were carried out using the SAS/MIXED-procedure and REML estimation method (SAS 1999). The estimated variance components were further used for estimating the ICC coefficient ρ as:

Design effect is a function of the average pen size and the ICC coefficient (Kish Reference Kish1965):

where n is the average number of animals housed in the same pen and ρ is the ICC. It is of use in the calculation of the proper number of experimental units when planning new experiments (Donner Reference Donner1992).
In one of the re-analysed experiments, the animals were assigned to pens according to their initial weight, i.e. the pens were blocked. As suggested by Morris (Reference Morris1998), an extra variance component for blocking was then added to the above statistical model and estimation of the ICC coefficient and the design effect was otherwise performed as above.
Simulation study
The above analysis of six real experiments gave an insight into the range of possible ICCs appearing in real studies. As expected, the ICC seemed to be closely connected with the variable under consideration. It is obvious that ignoring a high ICC in experimental design has a notably deteriorating effect on the conclusions of any experimental study. A consequent simulation study therefore was focused on the effect of unheeded small ICCs. To screen out possible detrimental effects various model specifications and analysis techniques commonly used in the statistical analysis of data from animal experiments were used. Moreover, to obtain relevant practical results the analysis concentrated on the observed low end of the ICC coefficients encountered in the analysis of real data.
In the first simulation study, data for 10 000 simulated experiments were generated. Each experiment comprised a fictitious variable with an ICC coefficient of 0·004, which was the lowest value encountered with real data in the above studies, three different treatments with no real difference between them, two pens per treatment and eight animals per pen. The effect of each pen was randomly drawn from the normal distribution with a mean of 0 and variance 102. The effect of each animal was randomly drawn from the normal distribution with a mean of 0 and variance 5002.
Each generated experiment was analysed separately using the following statistical model including the terms implied by the simulation process:

where y ijk is the generated observation, μ the overall mean, αi the effect of the ith treatment (no difference), βij the effect of the jth pen within the ith treatment and εijk the normally distributed residual error (=within-pen variation).
Depending on the distributional assumptions assigned to the terms of the above model specification, it was possible to carry out four different types of analysis. In the first analysis αi and βij were assumed to be fixed effects. This analysis was performed using the SAS/GLM-procedure (SAS 1999). When treatments were compared using the F-test, βij was used as an error term. The rest of the analysis was performed using SAS/MIXED-procedure with the REML estimation method (SAS 1999) in which βij was assumed to be a random effect. The three additional analyses differed only in the calculation of the denominator degrees of freedom. The methods used were: (i) ‘between/within’ denominator degrees of freedom (i.e. no adjustments), (ii) Satterthwaite's method (Satterthwaite Reference Satterthwaite1946) and (iii) Kenward–Roger method (Kenward & Roger Reference Kenward and Roger1997). The basic idea of the two latter adjustment methods is to correct the denominator degrees of freedom if the variance component of a random effect has been estimated to be non-positive. In the current simulation study, the ICC was chosen to be small and therefore negative or zero estimates for variance component of pens occurred frequently. Adjustment methods are described in more detail by Satterthwaite (Reference Satterthwaite1946) and Kenward & Roger (Reference Kenward and Roger1997).
Data were generated so that all differences between the three treatments were caused by chance only. An F-test can be used to test the null hypothesis that differences are caused by chance. If the null hypothesis is true, P-value for the F-test is uniformly distributed between 0 and 1, i.e. all values between 0 and 1 are equally probable. Accordingly, the four different analyses mentioned above were compared using the distributions of the P-values obtained and then compared with the standard uniform distribution.
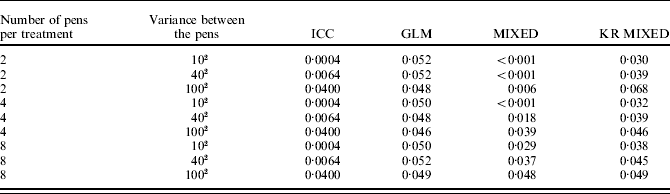
Eight additional simulation studies were carried out by varying the number of pens per treatment (two, four or eight) and the between-pen variance (102, 402 or 1002). Each of them comprised 10 000 simulated experiments. The ICC coefficients used varied between 0·0004 and 0·0400.
RESULTS
Group-feeding trials
Considering the weight of an animal at the end of an experiment, the average estimated ICC coefficient was 0·0148. When experiments on bulls and cows were examined separately, the results showed that intra-correlation coefficient was higher in experiments on bulls than those on cows. On average, the ICC was more notable in the analyses of live weight gain during the experiment than in analyses of a given target weight. Again, the ICC coefficients were higher in experiments on bulls than those on cows (Table 2).
Estimated ICC coefficients and design effects for eight different variables

NA=not available.
The body condition scores and weights of calves were evaluated in experiments on cows only. As to the birth weight of the calves, in one experiment the estimated ICC coefficient was as high as 0·2070 while in other experiments it was less than 0·0300. The number of pens per treatment was small in all experiments and therefore the estimate for the variance component of the pen is poor. The results obtained showed, however, that the variation in ICC coefficients between experiments can be large. Blood parameters were measured for one trial only. Variation between ICC coefficients among the different blood parameters was seen to be large. The highest ICC coefficient was found in the analysis of total protein (0·2276) and the lowest for long-chain fatty acids (≈0·0). ICC coefficient for urea, Hb and albumin was 0·0167, 0·0001 and 0·0048, respectively.
The ICC coefficient was low for all the variables measuring the quality of meat. On the other hand, the ICC coefficients were high for all the variables measuring behavioural patterns. The ICC coefficients and design effects were estimated according to formulae (2) and (3), respectively. Table 2 shows the estimated ICC coefficients and design effects for eight different variables.
Simulation study
Statistical theory implies that whenever the null hypothesis is true, the observed P-value follows the standard uniform distribution. The simulation study confirmed that the fixed model analysis (SAS/GLM) fulfilled this property when the ICC within pens was slight and the number of pens per treatment was two (Fig. 1a). The study further showed that the common mixed model approach did not work adequately with the presence of a slight ICC (Fig. 1b). In the simulation study, the probability of getting a statistically significant P-value (<0·05) by chance turned out to be only <0·001 instead of 0·05. Furthermore, the probability for a P-value of <0·10 was only 0·006 instead of 0·10. Elevated P-values appeared when the estimated value of the variance component for the pen effect was non-positive. For positive estimates both models resulted in exactly the same P-value. The methods of Satterthwaite (Reference Satterthwaite1946) and Kenward–Roger (Reference Kenward and Roger1997) were both used for correcting the degrees of freedoms when non-positive estimates of variance components occurred. With the simulated data both methods resulted in exactly the same corrections. After correction, distribution for the P-value was closer to the standard uniform distribution (Fig. 1c). The lack of small P-values was still clear: the probability of obtaining a P-value of 0·05 and 0·10 by chance was only 0·030 and 0·062, respectively.
Distribution of P-values in the simulation study (N=10 000) where the null hypothesis is true, the pen effect is slight and the number of pens/treatments is two. The analysis used three models: (a) standard fixed-effects model, (b) mixed-effects model, and (c) mixed-effects model with corrected denominator degrees of freedom. For each analysis, the domain of P-values was divided into 100 sections. If the analyses were valid, the computed P-values would be distributed evenly over these sections.

For some simulated datasets, the choice of statistical model made a big difference. In one of the most extreme cases differences between treatments were statistically significant (P<0·001) when the GLM model was used, but a P-value of 0·51 was obtained when a mixed model analysis without denominator degrees of freedom adjustment was applied. Both adjustment methods corrected the P-value to 0·44.
Distribution of the P-values of mixed models followed the uniform distribution more accurately when the number of pens per treatment was increased from two to eight, or when the between-pen variance was increased from 102 to 1002 (Table 3). However, if a mixed model without denominator degrees of freedom adjustment was used, the resulting F-tests were still too conservative in all combinations.
Results of simulation: probability of obtaining a P-value less than 0·05 by chance when the number of pens per treatment was set at two, four or eight, the variance between pens was set at 102, 402 or 1002 and the data were analysed using the fixed effects model (GLM), the mixed model (MIXED), and the mixed model with Kenward–Roger correction (KR MIXED). Each pen contained eight animals, the within-pen variance was set at 5002 and 10 000 datasets were generated for each combination. The ICC coefficients represent the proportion of true variation that can be attributed to differences between the pens
DISCUSSION
The current study provides information on the presence and extent of ICC in six experiments on suckler cows. Similar appearance of ICC may be expected in future studies. The results obtained show that ICC varies with the response variable considered. Depending on the response variable, it may be significant or negligible.
It is not always possible to include more than one pen per treatment. In particular, when different housing or growing conditions are compared, the conventional analysis of variance technique necessitates more than one cow house per treatment or at least two housing systems are needed. In such experiments the researcher is easily tempted to use the animal as an experimental unit. Careless trust in the validity of the procedure may, however, lead to unsound conclusions. The only trustworthy way to make sure is to repeat the experiment at least twice and analyse the data using experiment as the experimental unit.
As expected, one of the highest ICC coefficients was found in the analysis of behaviour data. It is well known that cows are highly social animals with synchronized feeding and resting behaviours (e.g. Bouissou et al. Reference Bouissou, Boissy, Le Neindre, Veissier, Keeling and Gonyou2001). At pasture they have enough space for synchronizing their behaviour and offset each other, whereas housed in a pen they try to minimize agonistic interactions by avoiding each other's individual zones (Miller & Wood-Gush Reference Miller and Wood-Gush1991). Thus, in pens, all cows might not perform the same behaviours at the same time. This means that the ICC coefficient is usually higher at pasture than in a small pen.
Negative ICC may exist in small pen sizes due to competition for food and space. Under the mixed model structure, negative correlation coefficients are inadmissible. The common correlation model does, however, allow for negative values for the ICC coefficients (Murray & Blitstein Reference Murray and Blitstein2003), and may therefore provide feasible alternatives in studies with small pen sizes and antagonism between the animals.
The simulation study showed that the common mixed-model approach had striking problems when the ICC was small. The simulation study, however, indicated that the mixed model approach could be improved by approximating the error degrees of freedom by using the Kenward–Roger correction (Kenward & Roger Reference Kenward and Roger1997) or Satterthwaite's method (Satterthwaite Reference Satterthwaite1946). Both correction methods are implemented in several commercial statistical packages and are recommended if mixed-model analysis is applied. Current results, however, showed that the consequent F-tests could still be too conservative, especially if there were only two pens and the ICC was small (<0·0400).
In the current study, ICC was used for measuring dependence of normally distributed variables only. The same techniques can also be used for any continuous and binomial variables (Gulliford et al. Reference Gulliford, Ukoumunne and Chinn1999). Animal behavioural studies are, however, more complicated than traditional feeding experiments. For instance, a fence can physically restrict animals, but it does not have a restrictive influence on vocalization. Therefore, the current study covered only a small aspect of the necessary investigations into the effect of a pen on the animals studied. In particular, much more effort should be placed on the planning process and statistical analysis of behavioural studies.
CONCLUSIONS
The current study gives some indication that, in certain situations, within-pen units may be valid experimental units. This does not, however, extend to a general result. Therefore, if pens are used in animal experiments, the only safe and sound technique to analyse the resulting data is also to use a pen as the experimental unit. If the ICC is small, then the fixed effects model is the only valid model. The mixed model approach is useful when the ICC is more notable. Degrees of freedom adjustment methods should be used when the mixed models are fitted to the data.



