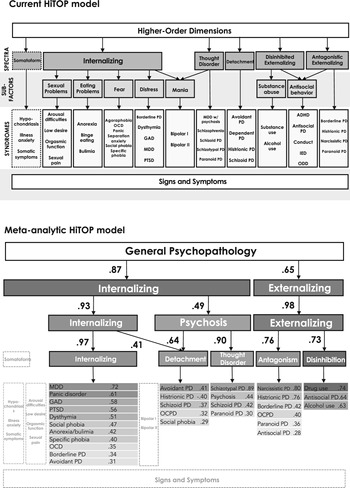
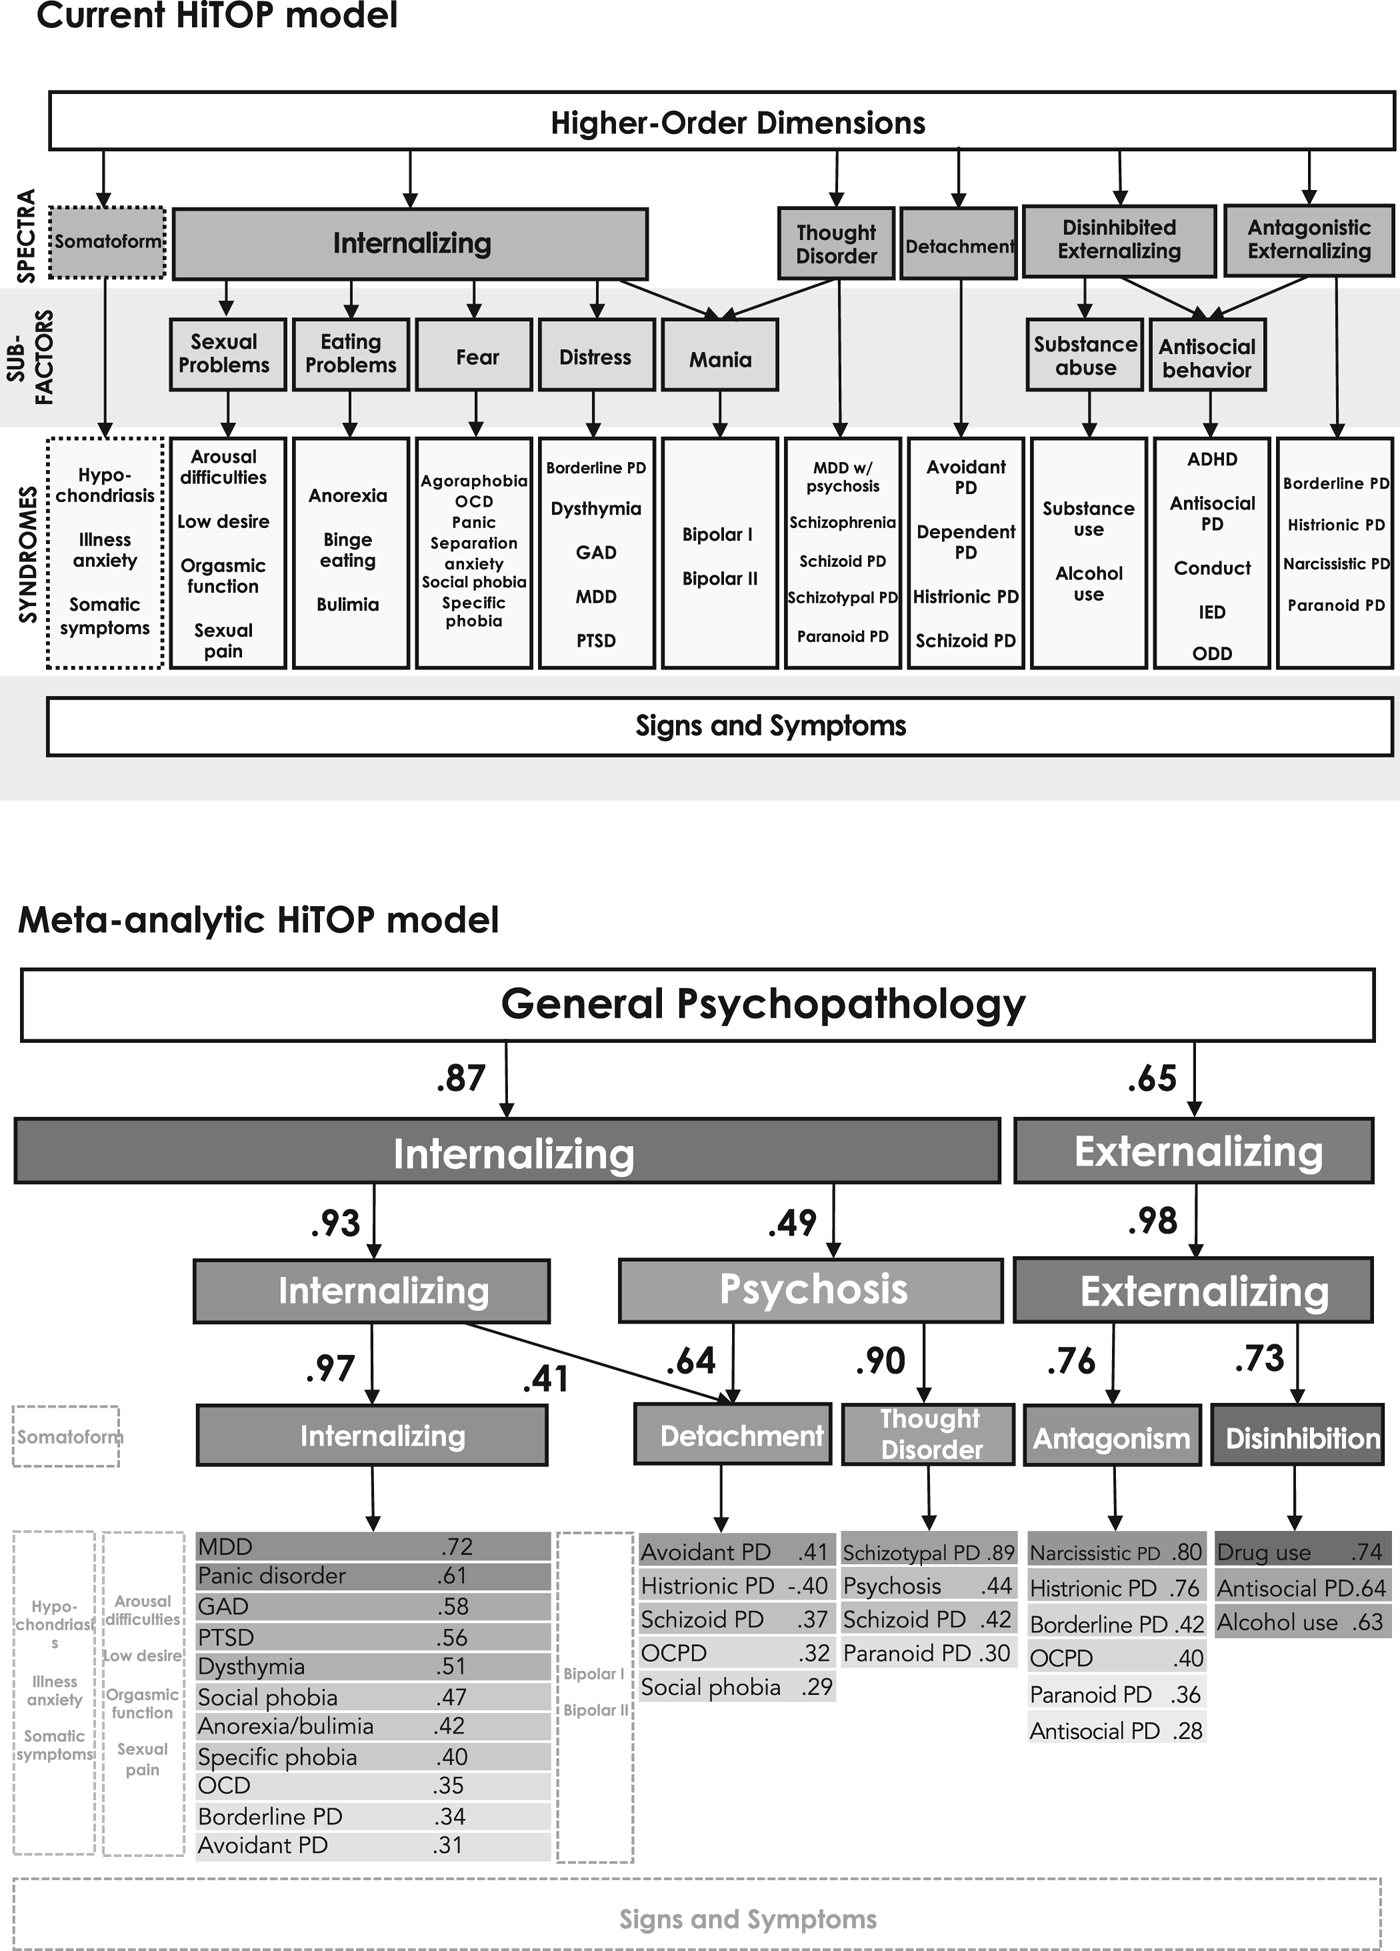
A paradigm shift towards transdiagnostic dimensional approaches to classifying psychopathology has gained traction in recent years (Dalgleish, Black, Johnston, & Bevan, Reference Dalgleish, Black, Johnston and Bevan2020; Krueger et al., Reference Krueger, Kotov, Watson, Forbes, Eaton, Ruggero and Zimmermann2018). Much of this shift has been driven by a growing literature using factor-analytic methods to overcome shortcomings of traditional diagnostic systems (e.g., Diagnostic and Statistical Manual of Mental Disorders [DSM]) by identifying the empirical structure of mental disorders. Evidence from these studies have been synthesized based on a narrative review into the hierarchical taxonomy of psychopathology (HiTOP) framework (Kotov et al., Reference Kotov, Krueger, Watson, Achenbach, Althoff, Bagby and Zimmerman2017). The HiTOP framework consists of five, hierarchically organized levels. As shown in the top panel of Fig. 1, at the lowest level of the hierarchy are narrow signs and symptoms which combine to reflect increasingly broad dimensions of psychopathology from syndromes/disorders (e.g., DSM diagnoses), to subfactors (e.g., fear, distress), to spectra (e.g., antagonism, detachment), and higher-order constructs encompassing features shared by most forms of psychopathology.
Comparison of the current HiTOP model based on a narrative review and the HiTOP model based on our quantitative meta-analysis.
Note: Congruence coefficients between factors at subsequent levels are shown by single-headed arrows. For ease of interpretation, not all factors at every level are shown; factor congruences are only shown if the factor split at the subsequent level. Indicators with factor loadings >|0.30| are listed below factors. Factor loadings are listed beside each diagnosis. Components with grey, dotted outlines are specified in the current HiTOP model but were not included in our analysis. ADHD, attention deficit hyperactivity disorder; IED, intermittent explosive disorder; MDD, major depressive disorder; OCD, obsessive compulsive disorder; OCPD, obsessive compulsive personality disorder; ODD, oppositional defiant disorder; PD, personality disorder; PTSD, post-traumatic stress disorder.
A hierarchical, dimensional classification system helps resolve issues of poor reliability (Regier et al., Reference Regier, Narrow, Clarke, Kraemer, Kuramoto, Kuhl and Kupfer2013), extensive overlap between diagnoses (Kessler, Chiu, Demler, & Walters, Reference Kessler, Chiu, Demler and Walters2005), and problematic within-diagnosis heterogeneity (Galatzer-Levy & Bryant, Reference Galatzer-Levy and Bryant2013) that have slowed progress in clinical research and practice (Clark, Cuthbert, Lewis-Fernández, Narrow, & Reed, Reference Clark, Cuthbert, Lewis-Fernández, Narrow and Reed2017; Markon, Chmielewski, & Miller, Reference Markon, Chmielewski and Miller2011). Compared to DSM categories, HiTOP transdiagnostic dimensions better account for patterns of heritability (Lahey, Krueger, Rathouz, Waldman, & Zald, Reference Lahey, Krueger, Rathouz, Waldman and Zald2017; Waszczuk et al., Reference Waszczuk, Eaton, Krueger, Shackman, Waldman, Zald and Kotov2020), neurobiological processes (Barch, Reference Barch2017; Parkes, Satterthwaite, & Bassett, Reference Parkes, Satterthwaite and Bassett2020; Shanmugan et al., Reference Shanmugan, Wolf, Calkins, Moore, Ruparel, Hopson and Satterthwaite2016), functional impairment (Waszczuk, Kotov, Ruggero, Gamez, & Watson, Reference Waszczuk, Kotov, Ruggero, Gamez and Watson2017), the effects of environmental risk factors (Albott, Forbes, & Anker, Reference Albott, Forbes and Anker2018; Rodriguez-Seijas, Stohl, Hasin, & Eaton, Reference Rodriguez-Seijas, Stohl, Hasin and Eaton2015), and variation in treatment response (Barlow et al., Reference Barlow, Farchione, Bullis, Gallagher, Murray-Latin, Sauer-Zavala and Cassiello-Robbins2017). Because of these promising findings, efforts to translate the HiTOP framework into real-world solutions by integrating it into clinical assessment and interventions are expanding (Conway et al., Reference Conway, Forbes, Forbush, Fried, Hallquist, Kotov and Eaton2019; Hopwood et al., Reference Hopwood, Bagby, Gralnick, Ro, Ruggero, Mullins-Sweatt and Zimmermann2019; Ruggero et al., Reference Ruggero, Kotov, Hopwood, First, Clark, Skodol and Zimmermann2019).
As the HiTOP framework becomes increasingly influential in how psychopathology is understood and treated, it is critical to ensure its principal objectives to ‘(a) integrate evidence generated by (the research on transdiagnostic dimensions of psychopathology) to date and (b) produce a system that reflects a synthesis of existing studies’ (Kotov et al., Reference Kotov, Krueger, Watson, Achenbach, Althoff, Bagby and Zimmerman2017, p. 456) are fulfilled. The defining advantage of the HiTOP framework is its basis on quantitative evidence – yet the current model was established by a narrative review, not a direct quantitative meta-analysis. By indirectly comparing results from separate analyses – each of which only captures a subset of variables and typically focuses on only one level of the hierarchy – many parts of the model were inferred rather than empirically estimated. The only quantitative meta-analysis on psychopathology structure to date aligns with the relevant portions of the HiTOP framework that it covered, but it was published over a decade ago and included a very limited set of diagnoses (Krueger & Markon, Reference Krueger and Markon2006). There is also no statistical information about important characteristics of the model, such as the strength of associations between indicators and psychopathology dimensions (i.e. factor loadings). These gaps in what is known about the empirical structure threaten the model's validity.
To produce a truly consensual model representing the current state of research on transdiagnostic dimensions, this meta-analysis provides a direct, quantitative synthesis of the literature by reanalyzing published samples in a single model. First, we tested the overall fit of the structure and the placement of DSM diagnoses in factor analytic models to compare with the HiTOP framework. Although the goal of the HiTOP framework is to eventually replace DSM constructs with empirically derived and presumably transdiagnostic dimensions, understanding how these frameworks interface can promote communication. Our second aim was to enrich the HiTOP framework with specific, meta-analytic parameter estimates. Finally, we aimed to present a road map for future investigations by identifying areas of the model in need of more research.
Methods
Eligibility criteria
All peer-reviewed, published factor-analytic studies estimating psychopathology dimensions from DSM diagnoses in adult samples were eligible for our meta-analysis. In addition to connecting research traditions, we chose to use DSM diagnostic indicators to maximize the number of studies eligible for inclusion and enable direct comparisons to the current HiTOP framework. Only studies in which diagnoses were assessed by structured or semi-structured interviews were eligible. Studies were included if diagnoses were operationalized as full syndrome (i.e. binary present or absent) or as ordinal symptom counts according to any version of the DSM criteria from the DSM III-R onwards. Studies were excluded if they used self-report measures of psychopathology or measures that did not assess DSM criteria. To ensure reliable correlation estimates, articles were also excluded that used samples smaller than 250 participants (Schönbrodt & Perugini, Reference Schönbrodt and Perugini2013).
Search criteria and study selection
To identify studies published before 2017, we screened references for the review paper that formed the basis of the current HiTOP model (Kotov et al., Reference Kotov, Krueger, Watson, Achenbach, Althoff, Bagby and Zimmerman2017). For studies on psychopathology structure published after the review paper (between 1 January 2017 and 1 July 2020), we searched PubMed and PsychINFO databases using the following keywords: (structure OR "structural model" OR "factor analysis" OR trait* OR dimension* OR spectra OR HiTOP OR "Hierarchical Taxonomy of Psychopathology" OR hierarchy) AND (psychopathology OR "mental disorder" OR "psychiatric disorder" OR transdiagnostic OR "personality pathology" OR "maladaptive personality" OR "personality disorder"). Because some eligible studies were drawn from the same samples, the final screening stage involved selecting one study per sample. For each sample, we included the study that assessed the most diagnoses to maximize content coverage. In longitudinal studies that separately analyzed structures at different time points, we used data from the wave with the most diagnoses, or largest sample size for greater precision if the same diagnoses were assessed.
We obtained correlation matrices for diagnoses from each study included in the final meta-analyses. If correlations were not published, we requested this data from the study authors by email. If authors did not provide the correlations, another study from the same sample was included instead when possible; if there were no other published studies available from the sample, it was not included in the analysis.
Analyses
Coding and selection of diagnoses
To retain data on symptoms with low endorsement rates (e.g., psychosis), many studies combined criteria from different diagnoses to estimate their models. To account for variation in how diagnoses were operationalized across studies, and to avoid loss of data, we coded some diagnoses with sparse representation as a single indicator. Schizophrenia and composites of psychotic symptoms used in the studies (e.g., psychotic episodes, delusional disorder, schizoaffective disorder) were coded as psychotic disorders; anorexia, bulimia, and composites of eating disorder symptoms were coded as anorexia/bulimia; and bipolar I and II and manic episodes were coded as bipolar disorders. We considered most diagnoses as defined by different versions of the DSM to be isomorphic. For diagnoses that were combined or separated in different DSM versions, and were thus operationalized differently across studies, we coded them as a single indicator. Specifically, we coded panic disorder with or without agoraphobia as panic disorder and drug or alcohol abuse and dependence as drug or alcohol use disorders. A complete list of how study diagnoses were coded for our analyses is in the online Supplementary material. Each element in the combined correlation matrix needed to be drawn from at least one study, so any diagnoses without enough data available across studies to estimate a complete correlation matrix were excluded.
Meta-analytic models
We meta-analytically estimated 1–11 factors representing the psychopathology dimensions above the syndrome/diagnosis level in the HiTOP framework. We used a two-stage procedure in which correlations between diagnoses were first pooled and then structural models were fit to the resulting pooled correlation matrix. The meta-analytic pooling of correlation matrices was performed in R (R core Team, 2018) using a univariate random effects approach (Hedges & Vevea, Reference Hedges and Vevea1998; Markon, Krueger, & Watson, Reference Markon, Krueger and Watson2005). Heterogeneity was assessed using the Cochran Q test. Tau2 (τ 2) was calculated to estimate between-study variance. Each correlation was independently estimated by taking the average correlation across studies that reported the effect, weighted for the study's sample size, and accounting for sampling variability. Thus, each meta-analytic correlation reflects an estimate of the population correlation, averaged across subpopulations.
In the second stage, we fit a series of structural models to the pooled correlation matrix using exploratory factor analysis (EFA) in Mplus (Muthén & Muthén, Reference Muthén and Muthén2020) with robust maximum likelihood estimation.Footnote †Footnote 1 Given the amount of variation in symptoms within diagnoses, and to account for interstitial features (i.e. those that load on or reflect multiple higher-order dimensions), we used EFA to allow diagnoses to freely cross-load onto all factors. We used Geomin oblique rotation because it is advantageous for models with complex loading structures (Browne, Reference Browne2001; McDonald, Reference McDonald2005), such as those expected for heterogenous diagnostic indicators. Because each cell in the pooled correlation matrix had a different sample size, we used the harmonic mean of the per-correlation N to obtain parameter estimates for the structural model. The harmonic mean is often used in cases that a single value is needed to represent unequal samples because it balances the influence of especially high or low Ns (Johnson, Carter, Davison, & Oliver, Reference Johnson, Carter, Davison and Oliver2001). We evaluated the models based on factor interpretability and model fit. Because the χ2 can be sensitive to ignorable sources of ill fit in large samples, we prioritized alternative fit indices. Model fit was assessed according to standard benchmarks [i.e. comparative fit index (CFI) ⩾0.95, root mean square error of approximation (RMSEA) ⩽0.06, and standardized root-mean-square residual (SRMR) ⩽0.08; Hu and Bentler, Reference Hu and Bentler1999]. For factor interpretation, we considered diagnoses with factor loadings ⩾|0.30| to be a marker of the factor. We also considered the precision of factor loadings in our data (i.e. s.e.) alongside the general parameter value threshold for interpreting the factors, but reiterate the caveat in footnote 1 that these s.e. should be interpreted with caution.
After estimating the factors, we adapted Goldberg's method (Goldberg, Reference Goldberg2006) to examine associations between psychopathology dimensions between sequential levels of the HiTOP framework. Typically, factor scores are correlated across levels with this method, but factor scores rely on individual-level data, which were unavailable for the pooled matrix. For our analyses, we instead calculated the congruence coefficients (r c) for factors across levels, which provided a comparable estimate of the cross-level associations between factors.Footnote 2
This modeling approach does not provide global model fit indices for a hierarchical model spanning the levels estimated here. Although the inability test overall fit of the model is a limitation of the method, other methods of estimating a hierarchical structure were impractical for the present study. A confirmatory factor analytic approach would make it difficult to reflect heterogeneity in the diagnoses because it presumes a sparse factor loading matrix and requires the investigator to specify all loadings a priori, and exploratory structural equation modeling requires individual-level data. Thus, instead of testing overall fit, this model allowed us to evaluate the HiTOP framework conceptually via interpretation of factors at each level as well as their interrelationships. Following Loehlin and Goldberg's (Reference Loehlin and Goldberg2014) recommendation, we considered |r c| ⩾ 0.90 between levels to indicate perpetuation of the same construct between levels of the hierarchy, and 0.30 ⩽ |r c| < 0.90 to indicate a higher-order dimension splitting into more specific lower-order dimensions.
Results
Correlation tables for each study included in the analysis are available on the Open Science Framework (https://osf.io/pqmtc/?view_only=521786c92eef4a8da6a70bdfbe42fae3).
Selection and inclusion of studies
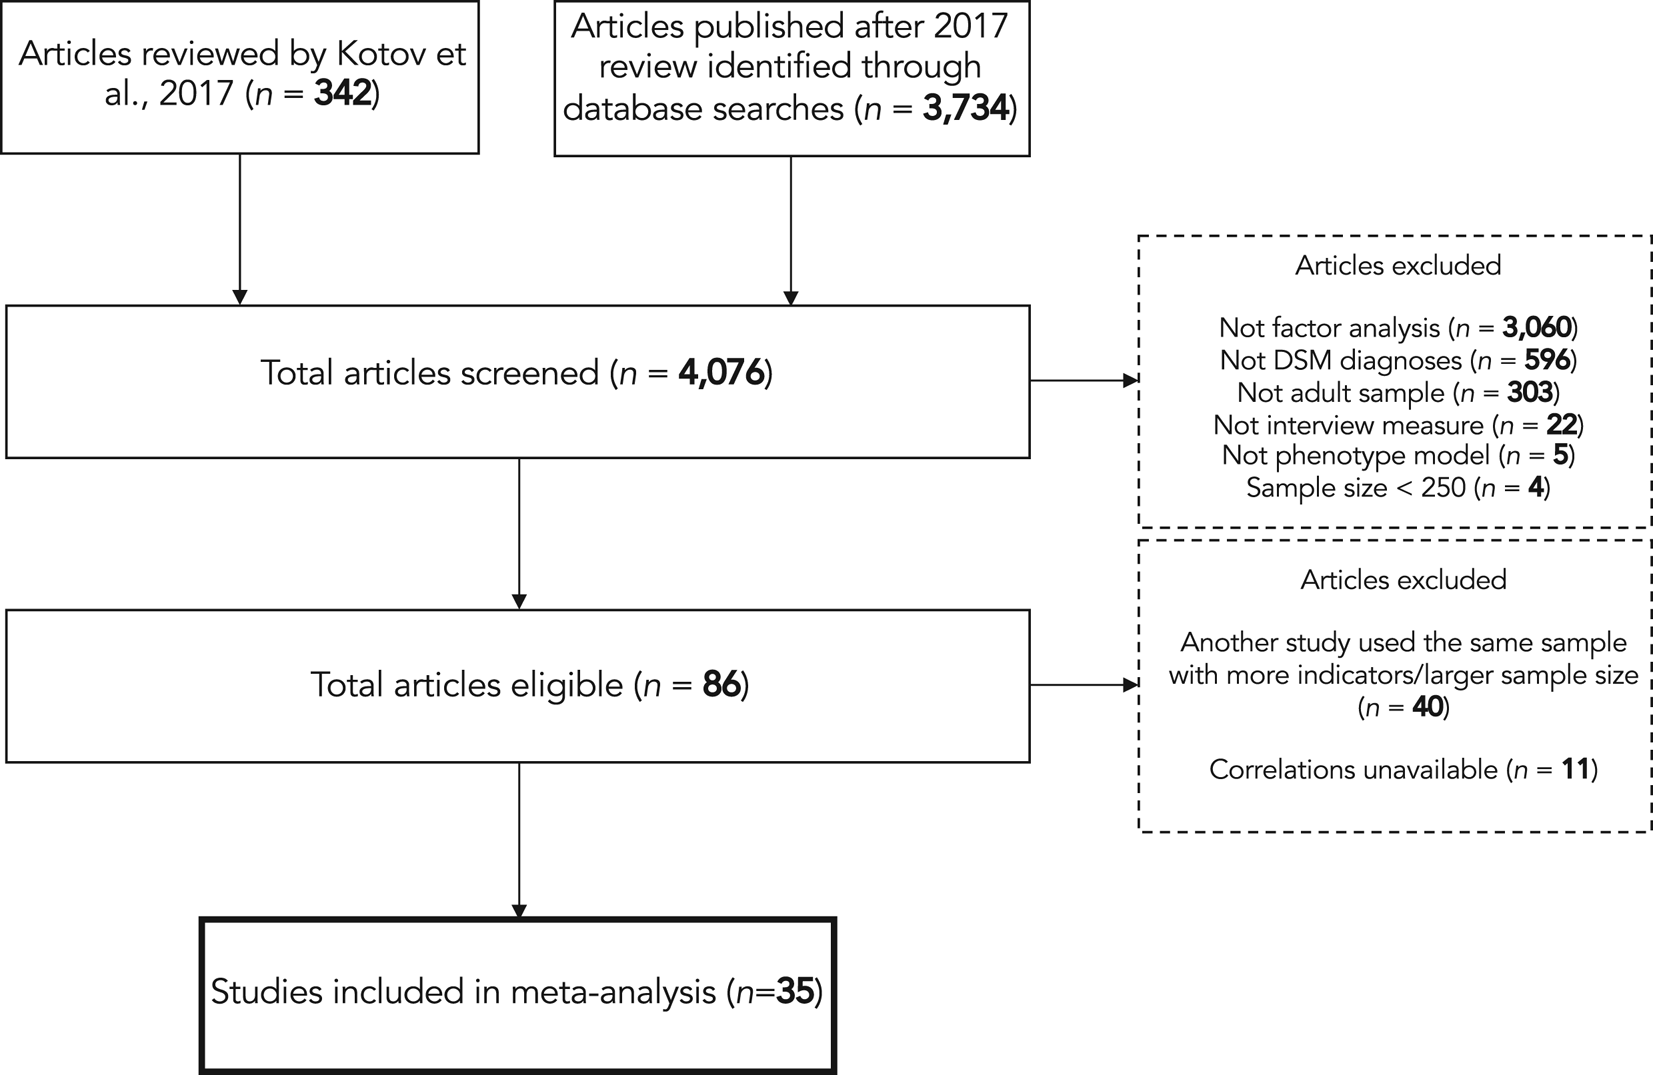
As shown in Fig. 2, 342 references from the previous HiTOP review and 3,734 articles identified through the database search were screened. A total of 86 studies representing 56 independent samples were eligible for inclusion.Footnote 3 We were unable to obtain correlation matrices from 8 samples (11 articles); thus, after selecting a single study per sample according to our criteria, 48 samples from 35 articles (N = 120,596) were included in the meta-analysis (study details are given in Table 1).
Flow chart of article selection process.
Participant characteristics and study details for samples included in the meta-analysis
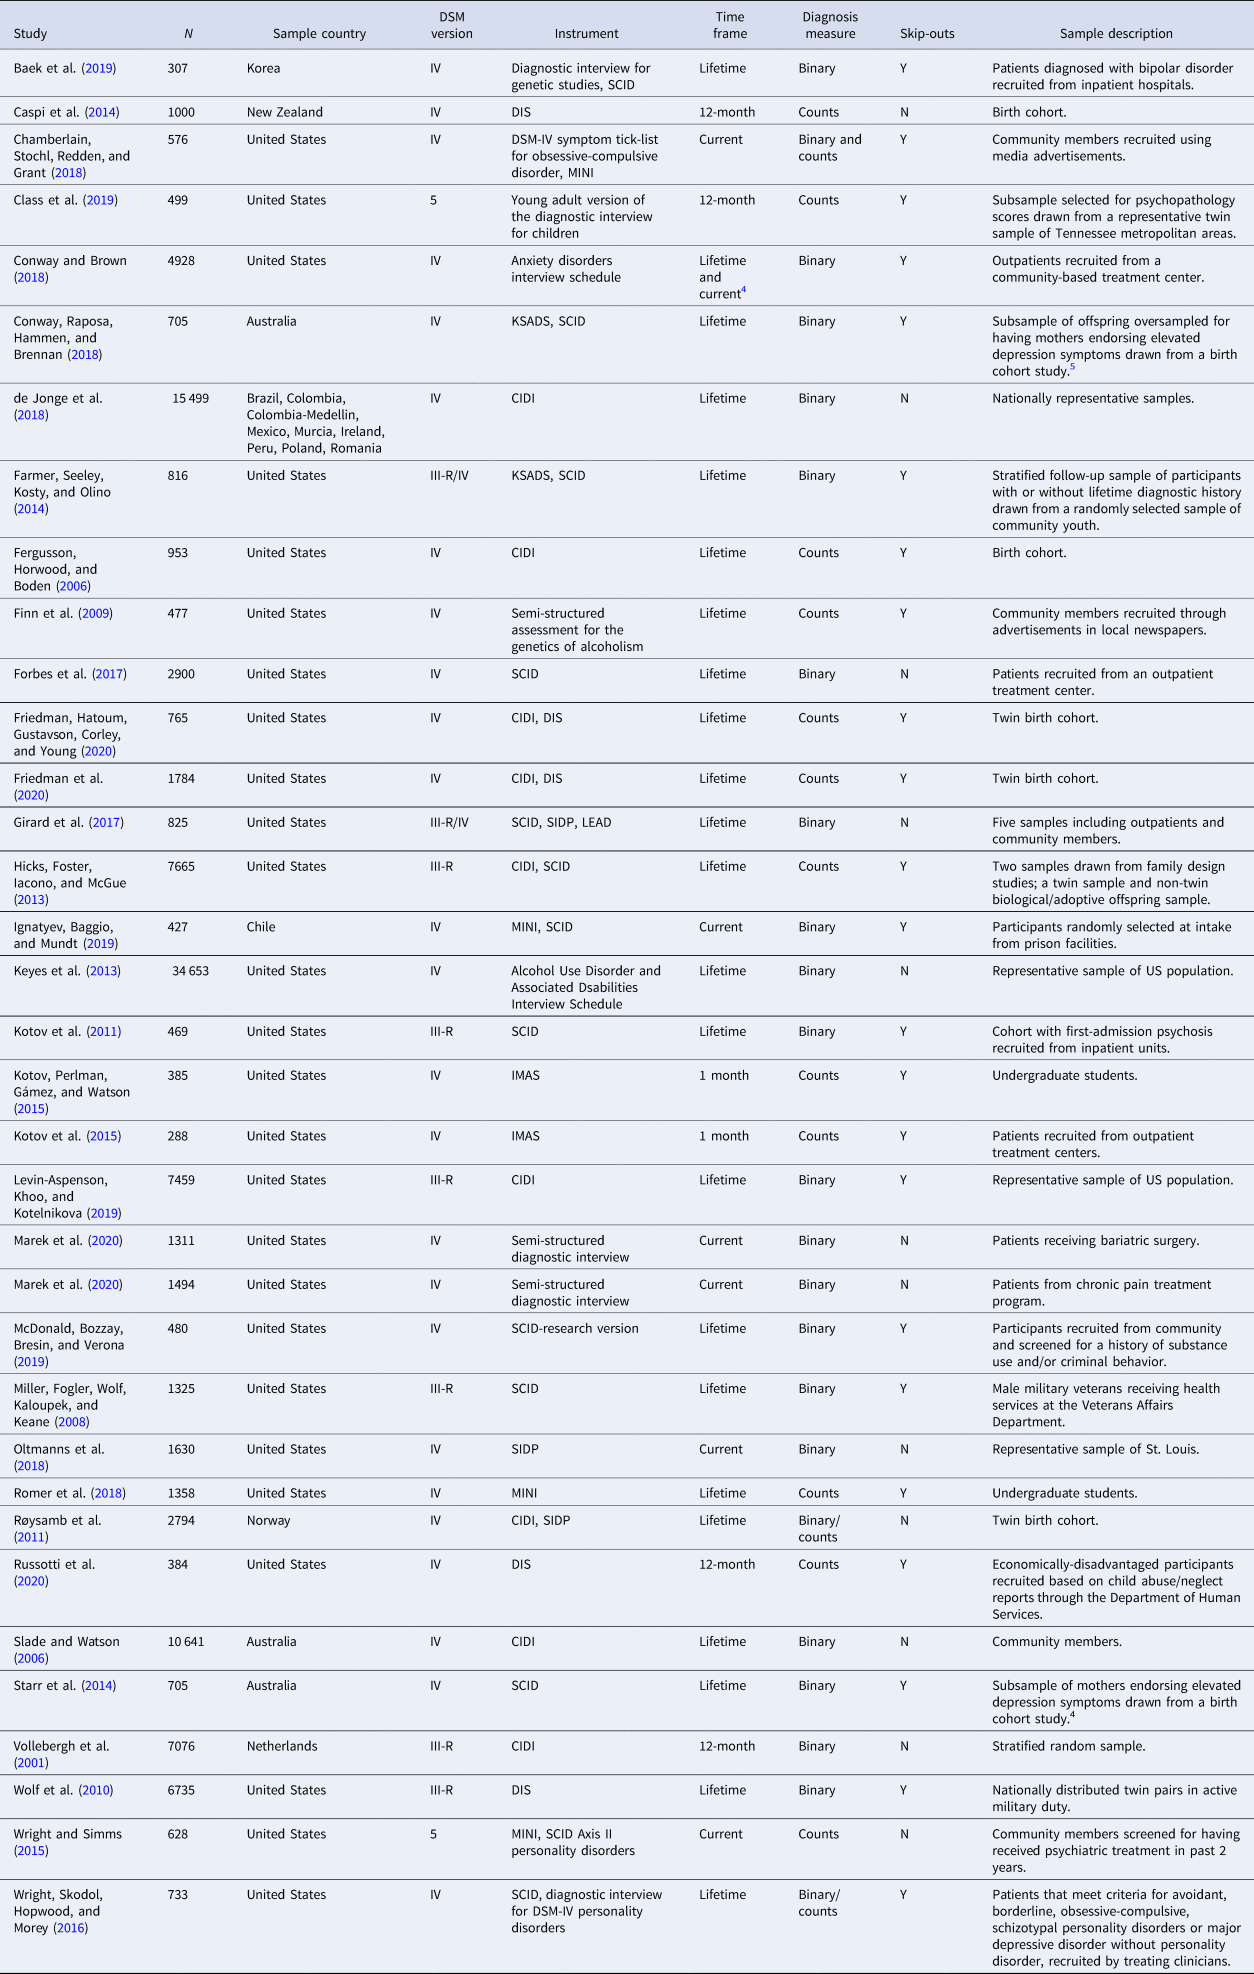
Time frame, time frame of assessed diagnoses; diagnosis measure, whether diagnosis was operationalized as binary indicator or dimensional symptom count; CIDI, composite international diagnostic interview; DIS, diagnostic interview schedule; IMAS, interview for mood and anxiety symptoms; KSADS, Kiddie schedule for affective disorders and schizophrenia; LEAD, longitudinal, expert, all data procedure; MINI, mini international neuropsychiatric interview; SCID, structured clinical interview for DSM; SIDP, structured interview for DSM personality.
4We used the correlation matrix for lifetime diagnoses in our main analysis, but using the correlation matrix for current diagnosis did not result in any substantive difference in the meta-analytic structure.
5Conway et al. (2018) and Starr et al. (2014) estimated the structures for offspring and mothers, respectively, from the same sample.
Meta-analytic structural models
Meta-analytic correlation matrix
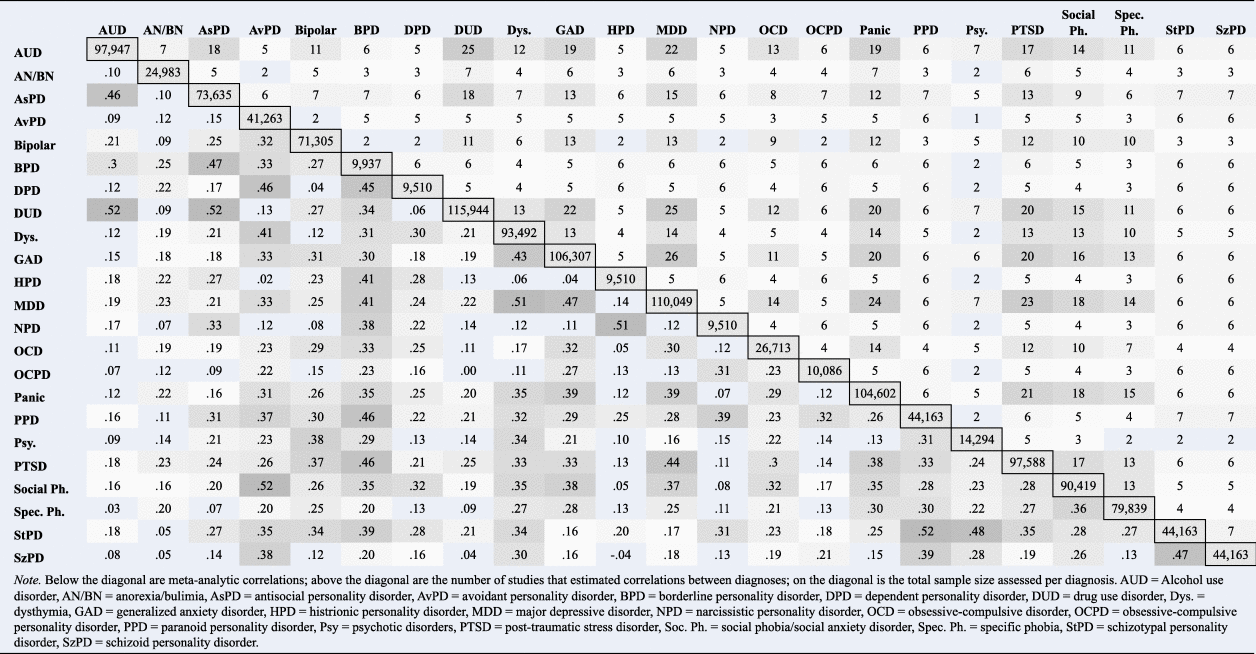
The pooled correlation matrix is shown in Table 2. Estimates of τ 2 and s.e. for each meta-analytic correlation are in the online Supplementary material. Twenty-three diagnoses had adequate data to be included, encompassing nearly all of the syndrome-level constructs specified by the HiTOP framework. Exceptions were that there were no indicators for sexual problems or somatoform psychopathology. There were also not enough data to model disorders with childhood onset (e.g. attention deficit hyperactivity, separation anxiety, and intermittent explosive disorders). Table 2 shows the sample size assessed for each diagnosis and number of studies that contributed to each correlation. The total sample size for each diagnosis ranged from 9510 to 115 944 and from 628 to 107 334 for each correlation. Major depression was assessed in the most studies (k = 30) whereas avoidant, dependent, histrionic, and narcissistic personality disorders (PDs) were assessed in the fewest (k = 6). The number of studies pooled to estimate each correlation in the matrix ranged from 1 to 26. A complete list of correlation sample sizes and studies per diagnosis is in the online Supplementary material.
Meta-analytic correlation coefficients and number of studies per diagnosis and per correlation
Factor-analytic models
Only one to four factors could be extracted from the pooled correlation matrix using EFA. Models with 5–11 factors did not converge. The four-factor model was interpretable, but the model fit indices suggested it was a poor fit to the data (CFI = 0.83, RMSEA = 0.09, SRMR = 0.05). Convergence issues in these models were likely due to dependent PD and bipolar disorder (i.e. identified Heywood cases). In models without dependent PD, a maximum of four factors could be extracted, but this model still had poor fit suggesting misspecification (CFI = 0.85, RMSEA = 0.08, SRMR = 0.04). Five and six-factor models with acceptable fit could be estimated after removing bipolar disorder, but including dependent PD. However, these models had some unexpected factor loadings that were difficult to interpret (e.g. dependent PD on an antagonism factor; results in online Supplementary material). Removing both bipolar disorder and dependent PD from the models allowed up to six factors to be estimated, but the six-factor model included a factor marked by a single indicator with a negative residual variance indicating factor overextraction. The five-factor structure achieved acceptable model fit (CFI = 0.92, RMSEA = 0.07, SRMR = 0.03) and had more interpretable factors compared to the models including dependent PD. Most factor loading s.e. rounded to 0.01 (full results in online Supplementary material). Thus, considering both model fit and interpretability, this model was selected as the final model.
In the final model, nearly all factor loadings were as expected based on the HiTOP framework's five-factor (spectra) level and could be interpreted as internalizing, detachment, thought disorder, antagonism, and disinhibition (bottom panel of Fig. 1 shows loadings ⩾0.30; complete factor loadings in Table 3). Although the subfactor level of the HiTOP framework lies between the syndrome/diagnosis and spectrum level, we could not recover the subfactor structure due to having zero indicators for two of the subfactors (i.e. sexual problems, mania) and only one indicator for two others (i.e. eating problems, antisocial behavior). Two results were inconsistent with the HiTOP framework. First, avoidant PD was expected to only load onto detachment, but it had a primary loading on internalizing and a secondary loading on detachment. Second, social phobia was expected only to load onto internalizing, but it had a marginal secondary loading on detachment [i.e. the point estimate was just short of our pre-determined threshold of |0.30|, but the 95% confidence interval (CI) contained 0.30; λ = .29, s.e. = 0.015, CI 0.26–0.32]. Similarly, the point estimate for the loading of antisocial PD on antagonism was also slightly below 0.30, but the threshold fell within the CI so we considered antisocial PD to be a marker of antagonism (λ = 0.28, s.e. = 0.013, CI 0.26–0.30). Additionally, our model showed that obsessive-compulsive PD (OCPD), which is not yet specified in the HiTOP framework, loaded primarily on antagonism and secondarily on detachment.
Factor loadings for the one to five-factor exploratory factor-analysis models
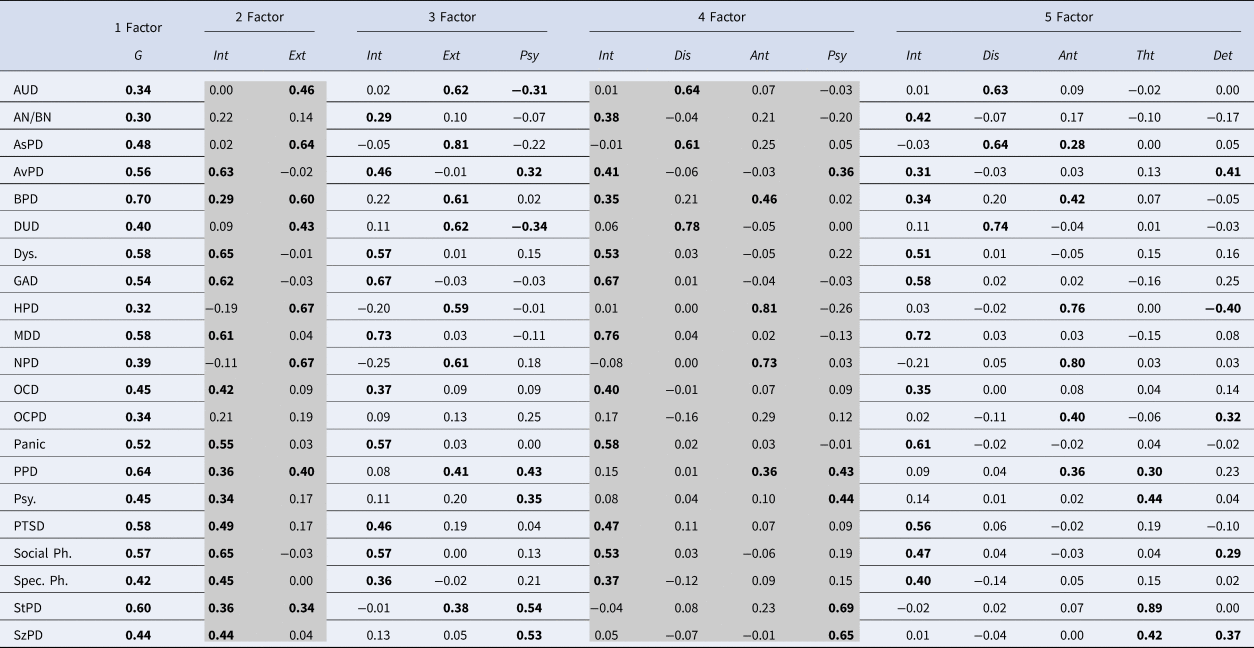
Note: Factor loadings with confidence intervals including >|0.30| are bolded. Nearly all standard errors for all factor loadings round to 0.01 (range = 0.004–0.021) and are reported in the online Supplementary material.
AUD, alcohol use disorder; AN/BN, anorexia/bulimia; AsPD, antisocial personality disorder; AvPD, avoidant personality disorder; BPD, borderline personality disorder; Dis, disinhibition; Det, detachment; DUD, drug use disorder; Dys., dysthymia; Ext, externalizing; G, general psychopathology; GAD, generalized anxiety disorder; HPD, histrionic personality disorder; Int, internalizing; MDD, major depressive disorder; NPD, narcissistic personality disorder; OCD, obsessive-compulsive disorder; OCPD, obsessive-compulsive personality disorder; PPD, paranoid personality disorder; Psy, psychotic disorders; PTSD, post-traumatic stress disorder; Soc. Ph., social phobia/social anxiety disorder; Spec. Ph., specific phobia; StPD, schizotypal personality disorder; SzPD, schizoid personality disorder; Tht, thought disorder.
Using the resulting EFA factors, we examined associations between psychopathology dimensions across levels of the hierarchy (associations shown in Fig. 1; factor loadings in Table 3; model fit indices in the online Supplementary material). We focused on the higher-order structure (i.e. levels from the spectra and above) rather than all five levels of the HiTOP framework because our analyses did not include symptom-level indicators (the lowest level of the HiTOP framework), and we were unable to recover the subfactor level for reasons noted above. All diagnoses loaded >0.30 onto a single higher-order factor, with borderline, paranoid, and schizotypal PDs as the strongest indicators. This general factor divided into externalizing (marked most strongly by histrionic and narcissistic PD) and internalizing (marked most strongly by social phobia and dysthymia) factors. At the third level, the psychosis factor split off from internalizing. At the fourth level, externalizing divided into antagonism and disinhibition. Finally, at the five-factor level, psychosis split into thought disorder and detachment – the latter of which was also associated with internalizing.
Moderators of between-study variance
We attempted to test study-level moderators of between-study variance by comparing factor-analytic models estimated in sample subgroups. We considered moderators that have been investigated in prior research including sample type (clinical or non-clinical), time frame of assessment (current or lifetime diagnoses), use of binary v. symptom counts, and use of skip-outs in assessing diagnoses (Kotov, Ruggero, Krueger, Watson, & Zimmerman, Reference Kotov, Ruggero, Krueger, Watson and Zimmerman2018). However, there was not enough data within any subgrouping of samples to estimate adequate five-factor models for comparison, so we were unable to assess these moderators.
Discussion
Our meta-analysis lends robust, quantitative evidence for the HiTOP framework. The meta-analytic structure represents a consensus among decades of empirical work from multiple countries, spanning diverse sample types, measurement instruments, and study designs. We found that a five-factor model resembling the HiTOP spectra fit the data well and the placement of DSM diagnoses were largely confirmed, showing the HiTOP framework is a reasonably accurate representation of research to date and supporting its validity for psychopathology classification.
In addition to providing evidence for the HiTOP framework's validity, our synthesis of the literature adds new insights into the structure and nature of transdiagnostic dimensions that could not be gleaned from the previous narrative review. In the current HiTOP framework, diagnoses are depicted as equivalent indicators of a given higher-order dimension, but we now quantify the strength of these associations with factor loadings. These parameters add greater precision to our interpretation of the HiTOP structure by indexing how much diagnoses reflect higher-order dimensions. As an example, we found that ~36% of the variance in panic disorder v. only ~10% in avoidant PD is accounted for by internalizing, despite sharing fearful, avoidant clinical presentations. Comparing these numeric estimates of the relationship between observed features and psychopathology dimensions provides key information for deciding how to classify psychopathology moving forward. The factor loadings we found that were unexpected based on the HiTOP model suggest several possible revisions and fresh directions for further inquiry. An especially novel finding, given that it is not yet included in the model, was that OCPD may be located in the antagonism and detachment spectra. This one meta-analytic parameter is not decisive, and more research is needed to explore the possibility – but recasting OCPD within the HiTOP framework would provide a way to rethink its core pathologies and leverage what is known about diagnoses with shared features (i.e. located in the same spectra) to open new avenues of research on this prevalent but understudied disorder (de Reus & Emmelkamp, Reference de Reus and Emmelkamp2012; Lenzenweger, Reference Lenzenweger2008; Zimmerman, Rothschild, & Chelminski, Reference Zimmerman, Rothschild and Chelminski2005).
HiTOP's higher-order structure fulfills the need for a phenotypic model that maps onto mounting evidence for non-specific genetic factors (Allegrini et al., Reference Allegrini, Cheesman, Rimfeld, Selzam, Pingault, Eley and Plomin2020; Kendler, Reference Kendler2005; Pettersson, Larsson, & Lichtenstein, Reference Pettersson, Larsson and Lichtenstein2016), brain structure abnormalities (Romer, Knodt, Houts, & Brigidi, Reference Romer, Knodt, Houts and Brigidi2018, Reference Romer, Elliott, Knodt, Sison, Ireland, Houts and Hariri2020), and pathophysiology (Elliott, Romer, Knodt, & Hariri, Reference Elliott, Romer, Knodt and Hariri2018; Kebets et al., Reference Kebets, Holmes, Orban, Tang, Li, Sun and Yeo2019) that cut across DSM categories. A practical obstacle to using the HiTOP framework for this purpose has been a lack of consensus evidence for the clinical presentation of higher-order dimensions (Levin-Aspenson, Watson, Clark, & Zimmerman, Reference Levin-Aspenson, Watson, Clark and Zimmerman2020), but our meta-analysis could help clarify these inconsistencies. For example, we found that personality pathologies (i.e. borderline, paranoid, and schizotypal) were among the strongest indicators for general psychopathology which adds to growing evidence that the cognitive, emotional, and behavioral dysregulation that distinguish these diagnoses in the DSM may actually be core, transdiagnostic symptoms. These findings align with theoretical (e.g. Carver et al., Reference Carver, Johnson and Timpano2017; Gray & McNaughton, Reference McNaughton and Gray2000; Spoont, Reference Spoont1992) and empirical work (e.g. Gluschokoff et al., Reference Gluschkoff, Jokela and Rosenström2020; Oltmanns, Smith, Oltmanns, and Widiger, Reference Oltmanns, Smith, Oltmanns and Widiger2018) and can serve as a springboard for research seeking to identify cross-cutting pathological features.
Our results on the higher-order structure may also provide a framework to better conceptualize evolving research on shared and specific risk pathways for psychosis. Recent work suggests affective/distress and negative symptoms differentially predict the transition to psychotic disorder (Binbay et al., Reference Binbay, Drukker, Elbi, Tanik, Ozkinay, Onay and Alptekin2012; Zavos et al., Reference Zavos, Freeman, Haworth, McGuire, Plomin, Cardno and Ronald2014), which could be due to influences at different levels of the hierarchy – specifically, increased risk associated with affective/distress symptoms (Legge et al., Reference Legge, Jones, Kendall, Pardiñas, Menzies, Bracher-Smith and Walters2019) may reflect the influence of the superordinate internalizing dimension whereas risk associated with negative symptoms may relate to specific factors in the subordinate detachment dimension. More refined conceptualization enabled by the HiTOP framework could eventually improve prognostic accuracy and lead to more targeted treatment.
Although our meta-analysis adds more certainty to many aspects of the HiTOP model, the fact that some constructs could not be included reveals areas of relative uncertainty that can inform ongoing research. Our analyses underscore how operationalizing psychopathology as meeting full DSM criteria means that less is known about diagnoses with lower base rates like psychotic disorders, eating disorders, and some of the PDs. Measuring these pathologies dimensionally would help address these gaps in the literature because it would allow for modeling subthreshold manifestations that occur at higher rates in the general population.
There are also forms of psychopathology observed in clinical practice but lack coverage in the DSM. For instance, interpersonal dependency can be a clinical problem, but dependent PD is one of the only diagnoses that captures such warm, submissive symptoms (e.g. difficulty disagreeing with others due to fear of losing support) (Zimmermann & Wright, Reference Zimmermann and Wright2017). Underrepresentation of this pathology in DSM constructs, along with the heterogeneity of dependent PD criteria, may be why we could not appropriately model the diagnosis – it includes some criteria that correlate strongly with other diagnoses and some criteria that are not similar to any other diagnoses. The HiTOP framework can easily incorporate pathologies like dependency with research using non-DSM measures that have better coverage of the construct (e.g. Simms et al., Reference Simms, Goldberg, Roberts, Watson, Welte and Rotterman2011) to produce a more comprehensive model than the DSM.
At the same time, some constructs have good coverage in the DSM but are rarely assessed in psychopathology research. The lack of research on some diagnoses meant we were either unable to evaluate their placement in the structure (e.g. somatoform symptoms, sexual problems), or their meta-analytic correlations were drawn from fewer samples (e.g. psychosis) which by definition makes those estimates less precise. It is difficult to know how variability in the precision of meta-analytic correlations may have impacted our results given the number of parameters in the models, but the dearth of studies on PDs is one likely reason we were unable to include bipolar disorders. Only two studies assessed bipolar disorders along with the PDs comprising antagonism, meaning there is little data on how bipolar disorders relate to an entire spectrum and thus its placement in the overall structure is uncertain.
Limitations
Several limitations of our study should be acknowledged. Our results indicate a prevailing limitation of the factor-analytic literature, which is that many studies use DSM constructs that are often unreliable, highly overlapping, and heterogenous. HiTOP aims to improve upon these constructs, so using them as the units of analysis acts as a barrier to uncovering the natural structure of psychopathology. It is reasonable to speculate that the structures derived from DSM diagnoses will differ from those using narrower, more homogenous constructs. Despite this limitation, modeling with DSM diagnoses still provides useful information about psychopathology structure because much of the heterogeneity in content is captured by cross-loadings across factors. Furthermore, the few studies that have estimated a comprehensive hierarchical model from narrow symptoms have found structures that are remarkably similar to what we found (e.g. Forbes et al., Reference Forbes, Sunderland, Rapee, Batterham, Calear, Carragher and Krueger2021), suggesting that models using DSM diagnoses do not necessarily produce fundamentally different results. Using DSM diagnoses in our analyses also served practical purposes. For example, as previously noted, using DSM diagnoses facilitates communication with clinicians and researchers who are primarily familiar with these constructs. Because much of the research underlying the HiTOP framework was based on DSM diagnoses, using these same constructs as indicators also allowed for direct comparisons between our meta-analytic models and HiTOP. And finally, pooling data across studies requires that the indicators are close to equivalent, so the widely used, standardized DSM criteria maximized the number of samples we could include.
There were also a number of questions that we were unable to address with our study which will be necessary for validating the HiTOP framework. Due to the sparseness of data, we could not test competing placements of diagnoses, the fit of provisional dimensions (e.g. somatoform), or moderators of the structure. Thus, additional research is needed to investigate questions such as whether bipolar disorders reflect internalizing and/or thought disorder spectra, as well as the extent to which severity of psychopathology in a sample impacts the overall structure and what this could mean for a literature that has largely relied on low pathology, epidemiological samples. A unique strength of the HiTOP framework is the explicit commitment to ongoing revisions based on new data, so we see our study as just one piece of a broader, iterative validation process.
Conclusion
Our meta-analysis adds quantitative validation of the HiTOP framework, enhances it with concrete information about its parameters, and clarifies an agenda for transdiagnostic research moving forward. Based on these results, we recommend that researchers interested in a quantitatively-based approach to studying psychopathology should (1) use more homogenous, empirically defined constructs like traits, narrow symptoms, and dimensional measures of psychopathology instead of DSM diagnoses, (2) assess a broader array of constructs, and (3) increase focus on areas of relative uncertainty in the model including somatoform symptoms, sexual problems, psychosis, eating pathology, personality pathology, and bipolar disorders. The HiTOP system will continue to evolve as research accumulates, but our study shows that a hierarchical, dimensional model has the empirical foundation needed to potentially transform how psychopathology is conceptualized, diagnosed, and treated.
Supplementary material
The supplementary material for this article can be found at https://doi.org/10.1017/S0033291721001902.
Financial support
This research received no specific grant from any funding agency, commercial, or not-for-profit sectors.
Conflict of interest
None.