Introduction
Before 2016, nothing was published on the population dynamics of chewing lice (Phthiraptera) that are ectoparasites of woodpeckers (Piciformes: Picidae), beyond basic infestation parameters on small samples of hosts (e.g., Keirans Reference Keirans1966; Clayton et al. Reference Clayton, Gregory and Price1992; González-Acuña et al. Reference González-Acuña, Ardiles, Moreno, Muñoz, Vásquez and Celis2014). Recently, however, the infestation parameters, seasonal patterns of infestation, and effects of host mass on population size were documented for seven species of lice on five woodpecker hosts (Galloway and Lamb Reference Galloway and Lamb2016, Reference Galloway and Lamb2017; Lamb and Galloway Reference Lamb and Galloway2016). As part of a long-term project to document chewing lice on birds in Manitoba, Canada, we now describe the stability of louse populations on northern flicker (Colaptes auratus (Linnaeus)) and yellow-bellied sapsucker (Sphyrapicus varius (Linnaeus)). Four species of lice (Phthiraptera) were found on these hosts: Menacanthus pici (Denny) (Amblycera: Menoponidae) from both hosts and three species of Ischnocera (Philopteridae): Penenirmus auritus (Scopoli) from yellow-bellied sapsucker and Penenirmus jungens (Kellogg) and Picicola porisma Dalgleish from northern flicker (Galloway and Lamb Reference Galloway and Lamb2016).
Our central hypothesis is that louse species will show species-specific levels of stability in annual abundance even when they live on the same host, subject to the same year-to-year fluctuations in environmental conditions. Trends in annual abundance and temporal variability in annual abundance (population variability, quantified by the metric PV (Heath Reference Heath2006)) are considered here to be components of population stability. Species-specificity of stability has been observed in other groups of insects, particularly Aphididae (Hemiptera) (Lamb and MacKay Reference Lamb and MacKay2010; Lamb et al. Reference Lamb, MacKay and Alyokhin2011, Reference Lamb, MacKay and Wool2012), as well as in Coleoptera and Lepidoptera (Lamb and Boivin Reference Lamb and Boivin2017). In previous studies of four chewing lice on feral pigeons, Columba livia Gmelin (Columbiformes: Columbidae), and one on common nighthawks, Chordeiles minor (Forster) (Caprimulgiformes: Caprimulgidae), there were species-specific patterns of abundance and population variability although these species of lice have similar feeding habits and often occur on the same individual birds (Galloway and Lamb Reference Galloway and Lamb2014, Reference Galloway and Lamb2015a, Reference Galloway and Lamb2015b). The population variabilities of all these louse species were relatively low in comparison with other species for which this aspect of population dynamics has been studied (Galloway and Lamb Reference Galloway and Lamb2014). The populations of lice on pigeons were stable in the sense that no trends in abundance were detected over a decade or more (Galloway and Lamb Reference Galloway and Lamb2014), whereas the prevalence of the louse on common nighthawks declined by 40% over two decades, possibly as a result of a decline in the host population (Galloway and Lamb Reference Galloway and Lamb2015b). Louse populations on woodpeckers were also documented over two decades, providing an opportunity to assess the generality of the patterns of population stability observed in previous studies.
Materials and methods
Woodpeckers and sapsuckers were salvaged from rehabilitation hospitals at the Wildlife Haven (Manitoba Wildlife Rehabilitation Organization, Île des Chênes, Manitoba, Canada) and Prairie Wildlife Rehabilitation Centre (Winnipeg and St. Adolphe, Manitoba, Canada), and processed as described in detail by Galloway and Lamb (Reference Galloway and Lamb2014, Reference Galloway and Lamb2016). We also examined birds that had died from traumatic injury and were submitted to the Oak Hammock Marsh Interpretive Centre or directly to us by the public. Juveniles and adults were both considered because they have similar numbers of lice and are often difficult to distinguish (Lamb and Galloway Reference Lamb and Galloway2016), but the few chicks that were sampled had no lice and were excluded. Lice were collected by washing birds twice in warm soapy water and once in clean water (Mironov and Galloway Reference Mironov and Galloway2002). The washing method removes nearly the entire population of lice infesting the host, except the majority of eggs (Clayton and Drown Reference Clayton and Drown2001; T.D.G., personal observation). Voucher specimens of lice were slide-mounted (Richards Reference Richards1964) or preserved in 70% or 95% ethanol, and deposited in the J.B. Wallis/R.E. Roughley Museum of Entomology, Department of Entomology, University of Manitoba (Winnipeg, Manitoba, Canada). Menacanthus pici is probably a species complex requiring revision, with the taxa being host-specific (Galloway and Lamb Reference Galloway and Lamb2016). Here, we consider M. pici on each host separately and so interpretation of data for members of such a complex could still be assigned to a particular species, once the taxonomy of this group of species has been clarified.
The following data were recorded for each individual bird: host species, collection date, numbers of adult females and males, and number of nymphs for each louse species (Galloway and Lamb Reference Galloway and Lamb2016). Only data for lice collected by washing birds were considered, for hosts acquired over 20 years, 1996–2015. These data were used to estimate mean annual values of population parameters for lice from birds sampled each year: abundance – number of lice per bird; prevalence – the proportion of birds infested; mean intensity – the mean number of lice on infested birds (Rózsa et al. Reference Rózsa, Reiczigel and Majoros2000); sex ratio – the ratio of males-to-females; ratio of nymphs-to-females – an index of reproductive success (Galloway and Lamb Reference Galloway and Lamb2016).
Parameters for different lice had different variances and often were not normally distributed. Therefore, Kruskal–Wallis one-way analysis of variance on ranks, followed by Tukey’s (when normally distributed but with different variances) or Dunn’s method (when not normally distributed) for all pairwise multiple comparison were used to compare parameters among louse species (SYSTAT Software 2009). Relationships between annual fluctuations in abundance parameters for different louse species were assessed by Pearson product moment correlations (SYSTAT Software 2009). Trends in the population parameters for each louse species were assessed by linear regression of annual estimates against year (SYSTAT Software 2009). The regression coefficients from these analyses were used to quantify one aspect of population stability, with the degree of instability increasing with the size of the coefficient defining the slope. A second aspect of the stability of louse abundance was assessed as population variability, defined as the temporal variability in annual abundance, quantified by the metric PV (Heath Reference Heath2006). The metric, PV, was calculated as a mean of the absolute values of differences for all pairs of annual estimates, where each difference was divided by the larger estimate for each pair (Heath Reference Heath2006). The result was a proportion between 0 and 1; a low value characterises low population variability and high stability. This metric is particularly suitable for comparisons among species, because population variability is measured on the same scale, regardless of mean abundance, and there is no assumption that estimates of population parameters are distributed normally.
Large samples of hosts were available for investigating louse populations: 280 yellow-bellied sapsuckers and 198 northern flickers. Nevertheless, given the length of the study, 20 years, and the vagaries of host collection, some years had too few hosts to provide precise estimates of population parameters. This sampling error might affect estimates of correlation and regression coefficients as well as PV. An effect of low sample size was observed previously for PV (Galloway and Lamb Reference Galloway and Lamb2015b). To assess the effects of sampling error, correlation and regression coefficients and PV values were re-estimated using subsets of the data excluding data for years with a few birds, the samples that might contribute most to error. Years when only one or two hosts were available were excluded from statistical analyses, leaving estimates of 18 or 19 years for the host species. Analyses were repeated with a further exclusion of years when four or six or fewer hosts were available, leaving 15–17-year time series for both hosts. A 15-year time series is sufficient to provide a precise estimate of PV (Lamb et al. Reference Lamb, MacKay and Alyokhin2017). Estimates for both the 18-year or 19-year and 15-year time series gave similar estimates, so data for the longest time series available are reported.
Results
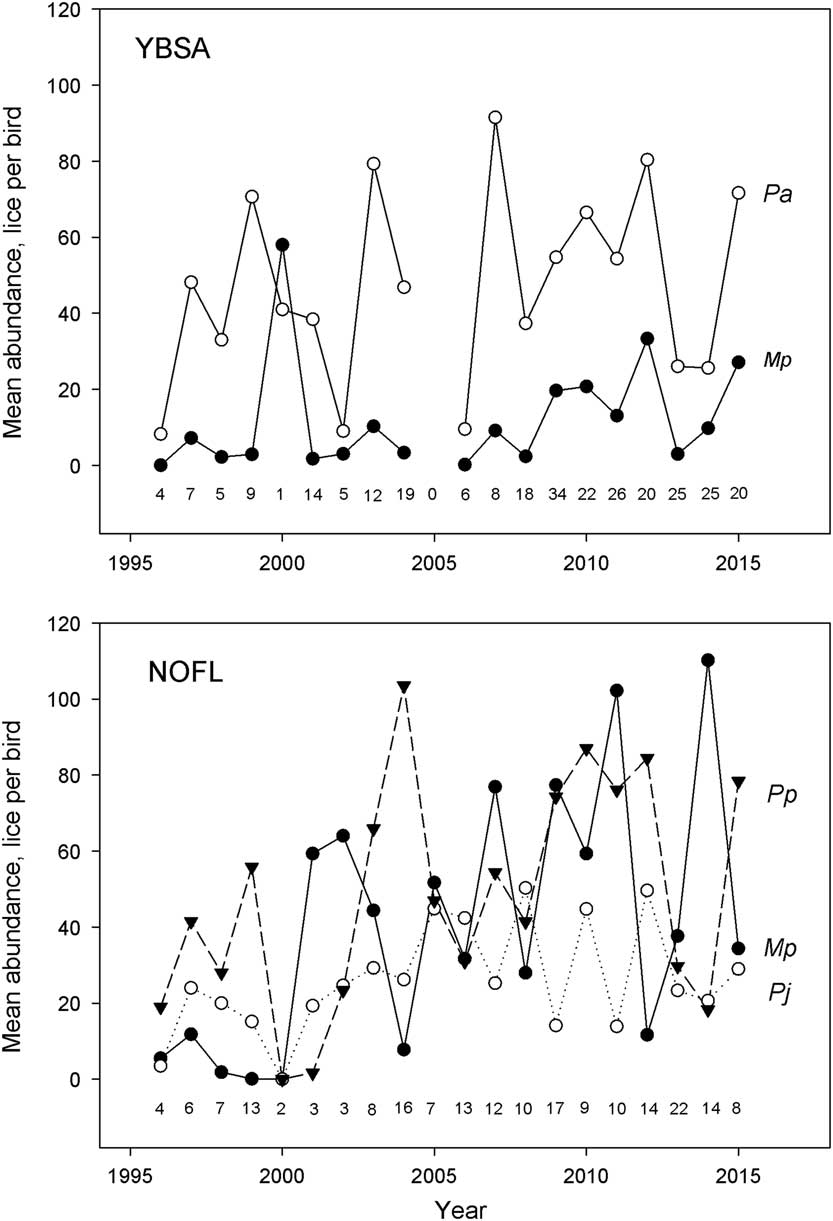
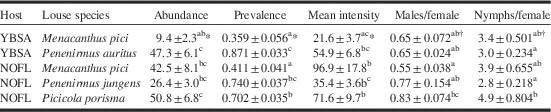
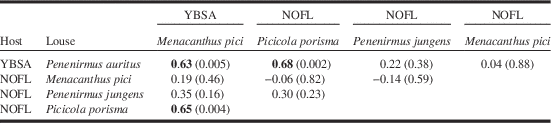
Mean annual abundance fluctuated from year to year, from zero for M. pici on yellow-bellied sapsuckers in 1996 to over 100 for the most abundant lice on northern flickers (Fig. 1). Some of the extreme fluctuations probably reflected sampling error. For example, the only yellow-bellied sapsucker collected in 2000 had the highest abundance of M. pici observed on that host (Fig. 1). In the same year, only two northern flickers were collected, and these birds had the fewest P. jungens and P. porisma observed (Fig. 1). When only one or two hosts were collected in a year, the data for such years were excluded from further analyses. Some species of lice were more abundant than others (P=0.001, Kruskal–Wallis test on ranks) (Table 1). On yellow-bellied sapsuckers, P. auritus was more abundant than M. pici, but M. pici on northern flickers was more abundant than M. pici on yellow-bellied sapsuckers and equally abundant to P. auritus (Table 1). Picicola porisma was the most abundant louse, with about 50 lice per flicker, on average (Table 1). Year-to-year variation in abundance was related only between M. pici and P. auritus on yellow-bellied sapsuckers, and between P. auritus on yellow-bellied sapsuckers and P. porisma on northern flickers, and not between M. pici on the two hosts (Table 2).
Annual mean abundance of four louse species infesting yellow-bellied sapsucker (YBSA) and northern flicker (NOFL) over 20 years. The numbers of hosts collected each year are given above the x-axes. Mp, Menacanthus pici; Pa, Penenirmus auritus; Pj, Penenirmus jungens; Pp, Picicola porisma.

Mean values for population parameters (±standard errors, n=18 years) for chewing lice on yellow-bellied sapsuckers (YBSA) and northern flickers (NOFL).

Notes: Values in a column followed by the same letter are not significantly different (P>0.05, Tukey’s test).
* Kruskal–Wallis one-way analyses of variance on ranks, Tukey’s test.
† One-way analysis of variance, Holm–Sidak all pairwise multiple comparison.
Pearson’s correlation coefficients (probability level, bold type for P<0.05, n=16–17 years) for the relationships between mean annual abundances of the chewing lice Menacanthus pici, Penenirmus auritus, Penenirmus jungens, and Picicola porisma on yellow-bellied sapsuckers (YBSA) and northern flickers (NOFL).

Note: Only years when the sample of both hosts was greater than four were included.
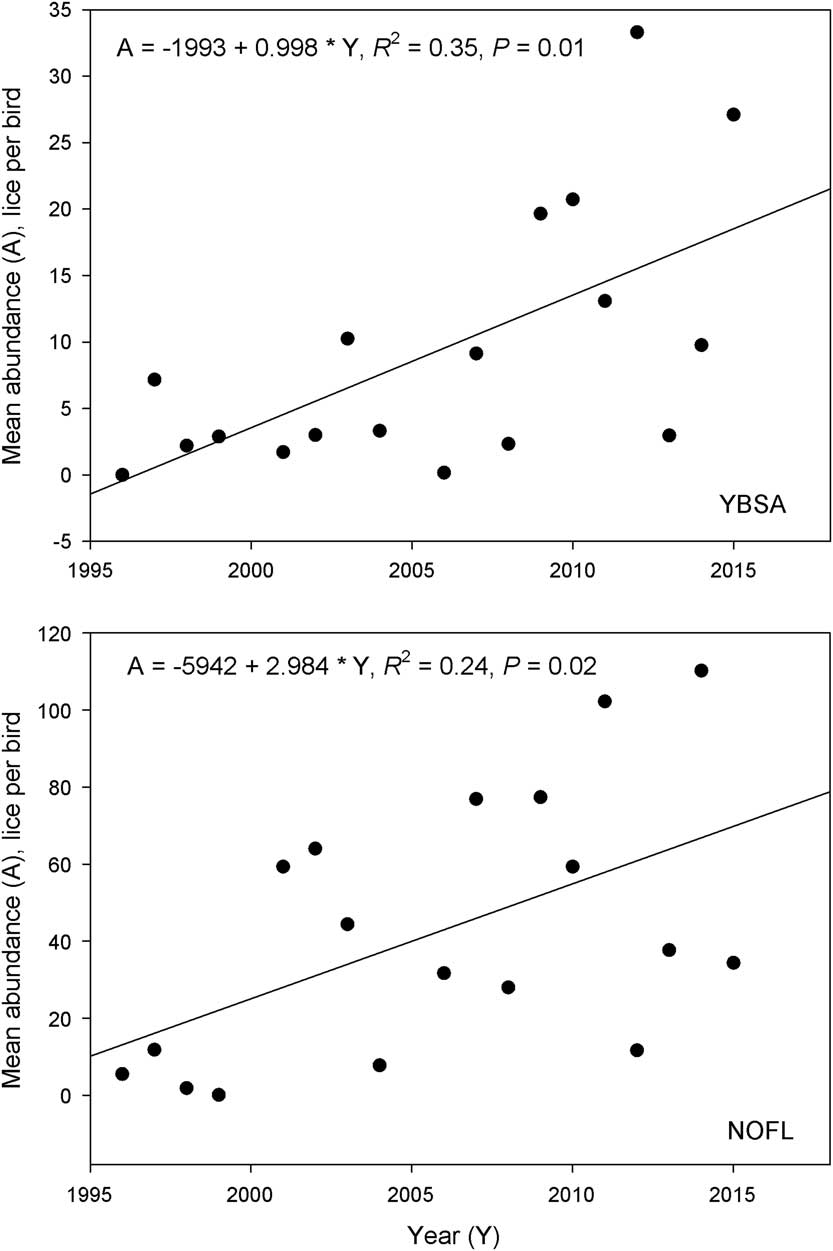
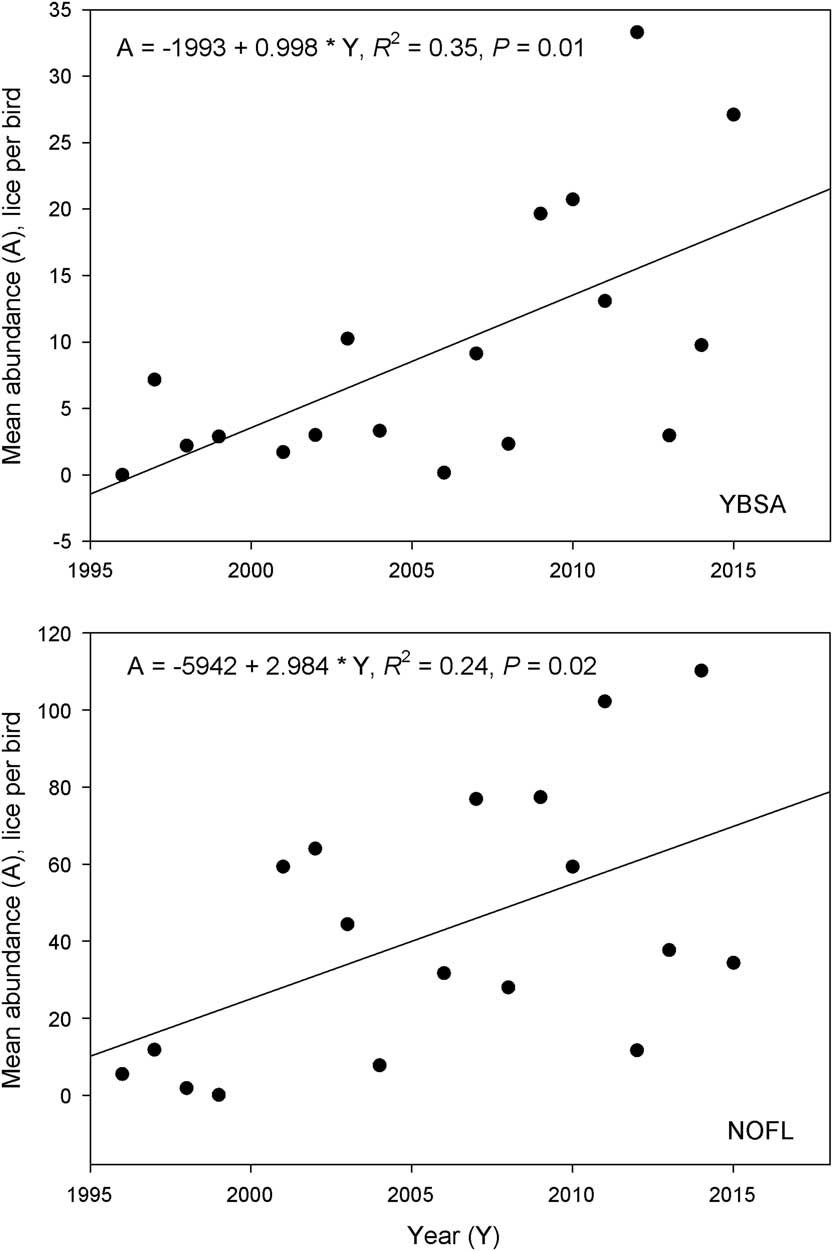
Only M. pici abundance had a significant (P<0.05) increase over the 20-year study, based on linear regression (Fig. 2). On yellow-bellied sapsuckers, M. pici increased 18-fold from 1996 to 2015, whereas on northern flicker, M. pici increased fivefold. This increase in abundance on sapsuckers resulted in a mean abundance of about 15 M. pici per bird in comparison with 54 for P. auritus in the second decade of the study. The population of P. auritus still exceeded that of M. pici despite its increase after 20 years (Fig. 1). In the second decade on northern flickers, the average abundance of M. pici was about 60 lice per bird, the same as that of the most abundant louse, P. porisma.
Linear regression relationships quantifying increasing trends in abundance for Menacanthus pici infesting yellow-bellied sapsucker (YBSA) and northern flicker (NOFL).
The patterns of annual change in abundance of the lice were further considered by partitioning abundance into prevalence and mean intensity (recall that abundance=prevalence×mean intensity) (Table 1). Annual estimates of prevalence and mean intensity were not significantly related for any of the louse species: the highest correlation coefficient was 0.46 (n=18, P=0.06) for M. pici on yellow-bellied sapsuckers, with other coefficients <0.2. For M. pici, the coefficient dropped to 0.38 (n=17, P=0.13) if the one year when prevalence and mean intensity were zero was excluded.
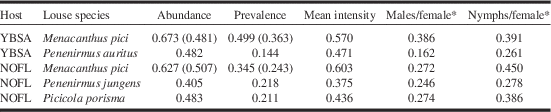
Year-to-year changes in prevalence were not correlated for any of the five species (P>0.08, n=18). Menacanthus pici had a similar prevalence on the two hosts, about half that for the other three louse species (Table 1). On both hosts, M. pici increased in prevalence over two decades (yellow-bellied sapsucker: −51+(0.03×year), R 2=0.40, P=0.003; northern flicker: −27+(0.01×year), R 2=0.18, P=0.05), whereas none of the other species did (P>0.05). In contrast, M. pici had the lowest mean intensity of the louse species on yellow-bellied sapsuckers, and the highest mean intensity of all lice on northern flickers (Table 1). Year-to-year changes in mean intensity followed a similar pattern to that of abundance (Table 2) with P. auritus correlated with P. porisma (r=0.48, P=0.05) and M. pici on yellow-bellied sapsuckers weakly correlated with P. auritus (r=0.42, P=0.08) and P. porisma (r=0.43, P=0.07). There were no significant trends in mean intensity for the louse species over two decades (P>0.05). The low annual abundance of M. pici on yellow-bellied sapsuckers was due to low prevalence and low mean intensity, whereas its relatively high annual abundance on northern flickers was due to high mean intensity (Table 1). Differences in annual abundance among louse species were due primarily to differences in mean intensity, except for M. pici, for which increasing prevalence over two decades explained trends in annual abundance.
Over two decades, the annual sex ratios (males-to-females) were female biased (<1 and similar) for all louse species, with only that for M. pici on northern flickers differing from that for P. porisma (Table 1). There was no significant trend in sex ratios over the two decades (P>0.05). Variation in the sex ratio from year to year for P. jungens was related to that for P. porisma (r=0.65, P=0.005, n=15), but there was no relationship between sex ratios for any other pair of species (P>0.1). The annual ratio of nymphs to females ranged from 2.8 to 4.9 per bird, with the two lowest values for the Penenirmus Clay species differing from that for P. porisma (Table 1). There was no significant trend in nymph to female ratios over the two decades. Variation in the nymph to female ratio from year to year for P. jungens was related to that for P. auritus (r=0.60, P=0.0001, n=18), for P. porisma and P. jungens (r=0.87, P=0.0001, n=18), for P. porisma and P. auritus (r=0.62, P=0.006, n=18), but there was no relationship for any other pair of species (P>0.1). Neither sex ratios nor nymph-to-female ratios were correlated (P>0.1) with annual abundance parameters (abundance, prevalence, and mean intensity).
Menacanthus pici had relatively high and similar PV values for annual abundance on both hosts, over 0.6 on a 0–1 scale, compared with the other three species. Penenirmus jungens had the lowest PV of 0.405 (Table 3). If, however, the PV values for M. pici were corrected for the increasing annual trend in abundance seen only for this species, PV dropped to nearly the same level observed for the other species (Table 3). The correction for the increasing trends was calculated using the residual errors from the regression line relating abundance and year (negative and positive residuals were added to mean annual abundance from Table 1, to centre variation on the mean rather than on the regression line), and then calculating PV for the residual errors.
Population variability (PV, see text) of population parameters for chewing lice on yellow-bellied sapsuckers (YBSA, n=18 years) and northern flickers (NOFL, n=19 years).

Notes: Values of PV in parentheses are corrected for the contribution due to the linear relationship between abundance or prevalence and year.
* PV values were based on 16–19 years because in some years, there were too few lice to estimate the ratio.
Population variability for prevalence was always less than that for abundance (Table 3). As was the case for abundance, correcting PV for a significant linear trend for M. pici reduced the estimate of PV on both hosts substantially, but still left M. pici with the highest PV of the louse species. Penenirmus auritus had the lowest PV (most stable prevalence) of 0.144. The PV values for mean intensity were high relative to prevalence and similar to those for annual abundance (Table 3). Population variability values for sex ratio were similar to those for prevalence, with the lowest value, 0.16, close to that for prevalence of P. auritus. Population variability values for the ratio of nymphs-to-females were intermediate between those for prevalence and mean intensity, with those for M. pici highest, as observed for other parameters.
With time series of 15 years or longer, PV values that differ by as little as 0.06 units are significantly different at least for the species so far studied (Lamb et al. Reference Lamb, MacKay and Alyokhin2017). On that basis, the PV of abundance for P. jungens differed from the other four species; the PV for prevalence of M. pici and P. auritus on sapsuckers differed from each other and from those for species on flickers; the PV for mean intensity for M. pici on both hosts differed from that of the other species (Table 3). For M. pici, populations on the two hosts tended to be more similar to each other and higher than those of the other species of lice, with the exception of PV for abundance, which was similar for all species (Table 3). The two Penenirmus species had PV values that were no more similar to each other than those of the other species (Table 3). For the three species and populations of M. pici on the two hosts (five taxa), PV for prevalence (Table 3) tended to be negatively correlated with mean abundance and prevalence (Table 1) (Pearson’s correlation coefficients (n=5) of −0.83, P=0.082, and −0.88, P=0.052, respectively), as was PV for mean intensity with prevalence (−0.81, P=0.01). Other correlations between abundance parameters and PV values for those parameters were <0.6 (P>0.3).
Discussion
Mean abundance for the four species of lice infesting yellow-bellied sapsuckers and northern flickers was in the same range as observed for lice on common nighthawks and feral pigeons in Manitoba (Galloway and Lamb Reference Galloway and Lamb2015a, Reference Galloway and Lamb2015b). The least abundant louse, M. pici on yellow-bellied sapsuckers, had about nine lice per bird on average over two decades, compared with about eight lice per bird for Mulcticola macrocephalus (Kellogg) on common nighthawks, although two of the lice on feral pigeons had two to three lice per bird. The most abundant louse, P. porisma, on northern flickers, had about 51 lice per bird compared about 57 lice per bird for Campanulotes compar (Burmeister) on feral pigeons. As was the case for four introduced species of lice on an introduced, non-migratory host, feral pigeon, the louse species co-occurring on the native, migratory woodpeckers showed species-specific patterns of abundance and population variability.
Most species of lice did not fluctuate together from year to year, suggesting that different environmental factors were contributing to the year-to-year changes in abundance for most of these species. However, the two most abundant species on the two hosts, P. auritus and P. porisma, did fluctuate synchronously. Environmental factors that might contribute to the significant relationships among species in year-to-year fluctuations are unknown. When correlations between the abundance of species of lice on the woodpeckers were detected, they were positive and so provided no evidence that the interaction may have been the result of competition between species.
Four other population parameters (prevalence, mean intensity, sex ratio, and nymph-to-female ratio) showed similar patterns of difference among species on the two woodpecker hosts to those for mean annual abundance. These patterns were consistent with those of lice on nighthawks and feral pigeons. Prevalence was about 0.35 to 0.85 on woodpeckers, as seen for the other hosts, except for Hohorstiella lata (Piaget) on pigeons, which had low prevalence and mean intensity (Galloway and Lamb Reference Galloway and Lamb2015a, Reference Galloway and Lamb2015b). Mean intensity of lice on woodpeckers ranged from 22 to 97, somewhat higher than for lice on the two previously studied hosts with mean intensities ranging from seven to 67, but not remarkably different. The female-biased sex ratio and the ratio of nymphs-to-females, often 2–3, were similar for louse species from all four hosts studied so far.
Two components of stability were quantified for populations of lice on the two woodpecker hosts: population trends and population variability. The annual abundance and particularly, the prevalence component of abundance of M. pici increased over the two-decade study on both host species, reflecting instability not evident in the other three species of lice, which showed no such trends. Although the rate of increase for M. pici was greater on yellow-bellied sapsuckers than on northern flickers, the absolute numbers for this louse were higher on northern flicker, perhaps reflecting the larger size of this host (Galloway and Lamb Reference Galloway and Lamb2017). This positive trend contrasts with the decline for M. macrocephalus on common nighthawks. Louse populations declined, especially in prevalence, over the same period of time that may have been associated with declines in host abundance (Galloway and Lamb Reference Galloway and Lamb2015b). The similar trend in population increase for M. pici on the two hosts suggests a widespread environmental or host-related factor affecting M. pici positively on both hosts without influencing the other species of lice on the same hosts. A multi-year trend in population size reflects instability: a trend cannot persist indefinitely because either a negative one leads to local extinction or a positive or negative trend eventually must reverse direction.
The second component of stability, population variability, also differed among the species of lice on these woodpecker hosts, although PV for mean abundance had a relatively narrow range 0.405–0.507 (when PV was corrected for the effect of the population trends of M. pici). These values are similar to those for three of the species of lice on feral pigeons, but both C. compar on pigeons and M. macrocephalus on nighthawks had lower PV values of about 0.32 (Galloway and Lamb Reference Galloway and Lamb2014, Reference Galloway and Lamb2015b). Population variability values for mean intensity, prevalence, sex ratios, and nymph-to-female ratios for lice on woodpeckers are in the same range as those for lice on feral pigeons and nighthawks (Galloway and Lamb Reference Galloway and Lamb2014, Reference Galloway and Lamb2015b).
The similarities and differences among lice on sapsuckers and flickers and those on feral pigeons beg an explanation. One possible explanation for the differences is that feral pigeons and their lice are introduced species whereas the woodpeckers and their lice are native. Introduced species sometimes exhibit higher PV values than native ones (Lamb and Boivin Reference Lamb and Boivin2017), but in this case, no such pattern is evident for the introduced lice on feral pigeons, because some of them have lower PV values than the native lice on woodpeckers. Taxonomic relationship has been posited to affect PV with more closely related species having more similar PV values than more distantly related ones (Lamb and Boivin Reference Lamb and Boivin2017, Reference Lamb and Boivin2018). For the lice on woodpeckers, the two M. pici populations have high and similar PV values for all three population parameters, but the two Penenirmus species have PV values that are no more similar to each other than to other species. Population size also has been posited to affect PV with less common species having higher PV values than more common ones, at least on feral pigeons (Galloway and Lamb Reference Galloway and Lamb2014). For the lice on sapsuckers and woodpeckers, the ranges of abundance are less than on feral pigeons, and therefore less likely to reveal an effect of mean abundance on PV. Nevertheless, the trend is for species of lice to show a higher PV for prevalence and mean intensity when mean abundance or prevalence of the species is low: the expected negative correlation.
In conclusion, the population parameters for four species of lice on two woodpecker hosts are in the same range as those for other chewing lice that have been studied, even though the lice on the different hosts are taxonomically diverse, as are their hosts and their life histories. The patterns of abundance and stability of lice on feral pigeons were characterised as species-specific, although the lice often infest the same bird (Galloway and Lamb Reference Galloway and Lamb2014). The differences in abundance and stability of the four species of lice on two species of woodpeckers support this hypothesis, although the population variabilities for lice on woodpeckers are more uniform than those on feral pigeons. The population dynamics of woodpecker lice are specific to the individual louse species, but the habitat, in this case an individual bird, can also influence louse populations. Host size is one such factor, where larger hosts support greater louse populations (Rózsa Reference Rózsa1997; Galloway and Lamb Reference Galloway and Lamb2017).
We have characterised the long-term population dynamics of nine species of chewing lice on four bird hosts (including four species described here that infest woodpeckers). These species of lice have a number of features in common: species-specific levels of abundance with levels of PV usually between 0.3 and 0.5, lower than that of most other species that have been studied (Galloway and Lamb Reference Galloway and Lamb2014). For all species, population variability tends to be lower for prevalence, sex ratio, and nymph-to-female ratio than for abundance and mean intensity. The stability of these populations is influenced by both population trends and population variability, and these types of stability can be quantified separately. Planned future studies of the dynamics include other communities of lice infesting a diversity of host taxa.
Acknowledgements
The authors especially thank the staff at the rehabilitation hospitals of the Wildlife Haven and the Prairie Wildlife Rehabilitation Centre for the care with which they handled the birds for this study; Paula Grieff kindly allowed us access to woodpeckers submitted at the Oak Hammock Marsh Interpretive Centre; thanks to the Canadian Wildlife Service for issuing scientific permits over the duration of this study. We thank Dave Holder, Lisa Babey, and the many students who helped by washing birds. This research was funded in part by Discovery Grants to T.D.G. from the Natural Sciences and Engineering Research Council of Canada and by Manitoba Conservation (Sustainable Development Initiatives Fund). The authors are grateful for the continued support of the Department of Entomology and the Faculty of Agricultural and Food Sciences at the University of Manitoba.