INTRODUCTION
Medieval and historical archaeology has sometimes viewed radiocarbon (14C) dating as a last resort, as stratigraphy, artifact typology, and written and pictorial sources can often date samples more precisely than the most precise 14C measurements. This is particularly the case with human remains, which may be subject to unknown offsets affecting both calendar dates and 14C ages. Offsets on the calendrical timescale stem from uncertainties in the collagen turnover rate in the skeletal element sampled, which are amplified by uncertainty in an individual’s age-at-death. Additional 14C age offsets are caused by dietary reservoir effects, which can only be estimated, based on quantitative reconstruction of individual diet and realistic estimates of 14C-depletion in the aquatic species consumed during the period of collagen formation. Our understanding of reservoir effects on 14C dates, dietary analyses using stable light isotopes and the employment of Bayesian chronological modeling in the interpretation of 14C dates have progressed over the last two decades, and studies are beginning to readdress this view (Millard Reference Millard2015). In this study, we aim to show that by combining archaeological, osteological, and paleodiet research in a Bayesian framework, it is now possible to 14C date a medieval event very precisely, opening up new research questions and the possibility to better relate archaeological finds with historically documented events.
St Alban’s Odense
Odense is situated on the island of Funen in central Denmark. During the medieval period, Odense was an important commercial town and a clerical center, with its own bishopric and numerous churches and monasteries. St Alban’s Church is believed to be one of the first churches on Funen, and is possibly identical to a church mentioned in AD 988. After having been used as consecrated burial ground for around 500 years, the church was abandoned in the wake of the Lutheran reformation in AD 1536 and demolished in the 1540s (Eliasen et al. Reference Eliasen, Johannsen, Johannsen and Vedsø2001). A series of archaeological excavations were carried out by Odense City Museums, most recently in 2015–2016 (Albrechtsen Reference Albrechtsen1956; Arentoft Reference Arentoft1985; Christensen Reference Christensen1999; Pedersen and Bjerregaard Reference Pedersen and Bjerregaard2016). Vital parts of the church and cemetery were destroyed in the 1950s when an underground carpark was constructed, but the excavations have given a rough idea of the building history of the church and the boundaries of the church yard (Eliasen et al. Reference Eliasen, Johannsen, Johannsen and Vedsø2001; Christensen and Bjerregaard Reference Christensen and Bjerregaard2017). The recent excavation (OBM3183) has revealed ca. 360 individuals buried east and north of the church. A group of graves with brick-built coffins are typologically dated to the mid-12th century to 13th century, while the remaining graves are only dated stratigraphically to AD 1100–1500. Following medieval burial practice, the large majority of the graves contained a single individual, but a handful of graves held two or more individuals (Pedersen and Bjerregaard Reference Pedersen and Bjerregaard2016). Multiple graves have been observed in medieval cemeteries throughout Scandinavia, most often containing juveniles and only more rarely adults (Ranåker Reference Ranåker2009). These graves reflect the contemporaneous death of the interred individuals, as burials in the Middle Ages usually took place within one or two days after death (Nilsson Reference Nilsson1987). We know little of the belief system behind this custom, but incidents of multiple death in a short period of time, caused by e.g. violence, accidents or epidemics, could lead to communal graves being dug in haste (Ranåker Reference Ranåker2009; Millard Reference Millard2015).
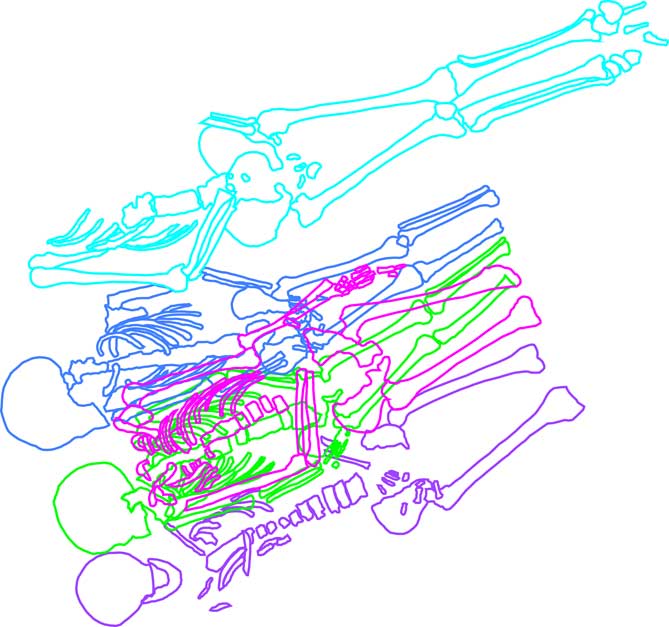
About 25 m east of the church, a multiple grave containing five juveniles received special attention during the 2015–2016 excavation. Because of the heavily mixed burial soil it was not possible to define the edges of grave 156, but based on the buried individuals it must have been minimum 1 m wide×1.7 m long. The grave was intercut by younger graves to the east. No coffin remains were found, but the presence of small bronze pin fragments next to burial x244 indicates it might have been wrapped in a shroud for burial, as is often the case for medieval burials. The five juveniles were placed partly overlapping in a supine position orientated roughly E–W, with the heads towards west. The internal stratigraphy in the grave was as follows; burials x241 and x243 placed side by side, partly overlain by burials x242 and x244, which in turn were overlain by burial x252 (Figure 1).
Multiple grave 156, St Alban’s Odense.

A study of long-term trends in medieval inhumation practices (Kieffer-Olsen Reference Kieffer-Olsen1993) found that in the earliest Christian burials, the arms were positioned beside the body (position A); in later burials, the hands were folded in the pelvic area (position B), and subsequently folded across the lower stomach (position C). In the latest burials, both hands were folded across the chest (position D). Arm positions therefore provide relative dates for the use of a burial ground, but at an individual level may be misleading, as the different positions overlap in time. The individuals buried in grave 156 had the arms placed in position B, indicating a possible date between mid-13th to mid-15th centuries, but it was not possible to confirm this stratigraphically.
Establishing Plague as Cause-of-Death
Paleopathology is a long-established interdisciplinary science, combining medicine, osteology and archaeology, yet it often struggles to establish a cause-of-death. Many diseases only affect the soft tissues, rendering it practically impossible to establish a cause-of-death based only on visual inspection of bones (Waldron Reference Waldron2009).
Acute infectious diseases such as common pneumonia, measles or smallpox could be fatal, but the great killer in the medieval period was the plague. It swept across Europe AD 1347–1352 and reappeared several times over the next centuries. The plague had a devastatingly high mortality rate, yet caused no visible pathological change of the skeleton (Roberts and Manchester Reference Roberts and Manchester2005). Thus, plague victims could only be identified from written sources, or their burial in known epidemic cemeteries, such as East Smithfield in London (DeWitte Reference DeWitte2010). This situation is changing, with on-going research into ancient DNA of Yersinia pestis (Luhmann et al. Reference Luhmann, Doerr and Chauve2017). Another approach could be to date potential plague victims precisely, and try to relate them to historically documented plague events.
Historian Lars Bisgaard (Reference Bisgaard2009) attempted to track Danish plague patterns from AD 1360–1500, hypothesizing that a plague epidemic would have caused a sudden increase in the number of “deeds of gift.” These gift letters, which usually have an exact date, concern endowments for perpetual masses and testaments and are connected with the general preparation for death, although not exclusively connected to the actual time-of-death. Deeds of gift would often be established as the rumor of a coming plague epidemic spread or afterward on behalf of the newly deceased, causing a spread of dates around the actual epidemic event. The preserved written records from Denmark are fragmentary, but it was possible to isolate peaks in the annual number of deeds, which could to varying degrees be confirmed as plague epidemics through documented references from neighbouring countries. Bisgaard was able to define 15 plausible plague epidemics in the period AD ca. 1350–1500, pointing to a decadal plague cycle.
MATERIAL AND METHODOLOGY
Sample Selection
It was decided to sample a lower first permanent molar (M1) from each of the five primary burials, disregarding any stray teeth. Using a dentist’s drill, the tooth was separated from the root with a horizontal cut just beneath the enamel-dentine junction. The crown was divided into two with a vertical cut down the middle. Next, using an abrasive drill bit, all the dentine was pulverized and removed as a bulk sample. Because of the individuals’ young ages-at-death, secondary dentine formation could be disregarded.
Laboratory Methods
All five samples were extracted and dated at the Leibnitz-Labor, Kiel, Germany. Dentine powder was ultrasonicated for 30 min in 10 mL acetone to remove any grease, then rinsed 5× with demineralized water. Samples were then demineralized in HCl (ca. 1%) at room temperature. Next they were treated with 1% NaOH (20ºC, 1 hr) to remove mobile humic acids and finally again with 1% HCl (20°C, 1 hr). Collagen was gelatinized overnight in demineralized water at 85ºC at pH=3, filtered through a 0.45 µm pore silver filter to remove insoluble particles, and freeze-dried before analysis (Grootes et al. Reference Grootes, Nadeau and Rieck2004).
For AMS 14C dating, an aliquot of collagen was combusted with copper oxide and silver wool at 900ºC in pre-combusted quartz tubes. The obtained CO2 was reduced with H2 over about 2 mg of Fe powder as catalyst, and pressed into a target holder for AMS measurement. Background and known-age bones were extracted and dated concurrently, with satisfactory results.
An aliquot of collagen from each sample was sent to Aarhus AMS Center, Denmark, for duplicate measurements of %C, %N, δ13C, and δ15N using a continuous-flow IsoPrime IRMS coupled to an Elementar PyroCube elemental analyzer. δ13C and δ15N values are normalized to the VPDB and AIR scale respectively using an in-house gelatin standard, GelA. Repeated measurement (n=15) of the GelA standard yielded a standard deviation for δ13C<0.2‰ and for δ15N<0.4‰.
RESULTS AND DISCUSSION
Osteology
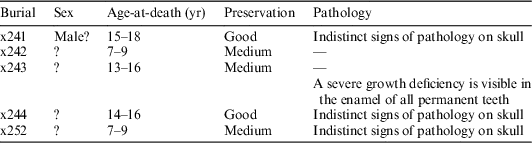
The osteological analysis of grave 156, St Alban’s Odense, builds on an unpublished museum report from ADBOU, the Unit of Anthropology at Southern Denmark University (Olsen Reference Olsen2016) and on analyses carried out by the first author. Age determinations of juveniles rely on dental development and eruption, length of long bones, and ossification of epiphyses (Bass Reference Bass1995; Scheuer and Black Reference Scheuer and Black2000). Sex determination is only possible when the primary pelvic bones (ilium, ischium, and pubis) have completely ossified around the age of 16 yr (Bass Reference Bass1995). The preservation of the skeletons was medium-good, compared to the norm of Danish medieval human material. No clear cause-of-death or signs of violent trauma were recognized. Osteological information, given in Table 1, is inconclusive, but it is possible that the five individuals were killed by an acute infectious disease.
Osteological results.

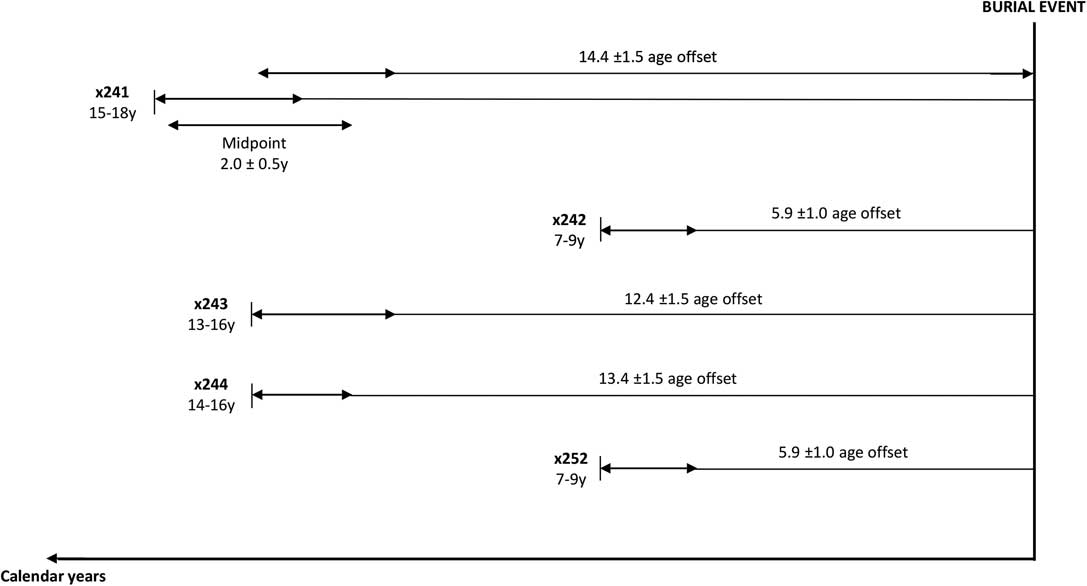
Unlike bone collagen, collagen in dentine is not remodeled over time. Following the London Atlas the M1 starts forming dentine at 0.3±0.1 yr and the crown is complete at 3.5±0.5 yr (AlQahtani et al. Reference AlQahtani, Hector and Liversidge2010; Beaumont and Montgomery Reference Beaumont and Montgomery2015). Applying the quoted variation, a conservative formation period for M1 crown dentine is 0.2–4.0 yr of age, with a midpoint of 2.0±0.5 yr. Using the midpoint of dentine formation and ages-at-death (Table 1) we calculated individual age offsets between 5.3±1.0 yr and 14.4±1.5 yr for the five burials (Figure 2). The offsets between dentine formation and age-at-death are needed to estimate the date of the burial event, given the 14C events embodied in the samples. By sampling the same tooth in individuals with different ages-at-death, we ensured that collagen formation in our samples was not exactly contemporaneous (and in fact may have spanned a decade). Short-term changes in diet due to e.g. famine will therefore not have affected all five individuals. This strategy aimed to increase the potential dietary differences between individuals, and therefore to maximize potential differences in dietary reservoir effects.
Schematic illustrating of individual age offsets, using age-at-death estimates and midpoint 2.0±0.5 yr of M1 crown dentine formation.

Isotopic Results
Samples from all five individuals had acceptable collagen yields of 2.1–2.9% and satisfactory atomic C/N ratios, well within the commonly quoted range of 2.9–3.6 (DeNiro Reference DeNiro1985). Details of AMS and EA-IRMS results for grave 156 are given in Table 2.
AMS and EA-IRMS results.

The five AMS dates are conventional 14C ages and corrected for fractionation using δ13C measured by AMS (Stuiver and Polach Reference Stuiver and Polach1977). A combination of the dates show them to be statistically inconsistent [T=21.4, T’(5%)=9.5, ν=4] (Ward and Wilson Reference Ward and Wilson1978).The difference between burials x242 and x252 is 125±25 yr (5 σ), which is highly significant. Both x243 and x241 are also significantly older in 14C age (by >2 σ) than x242, and x252’s 14C age is significantly older those of all four of the other burials. The 14C calibration curve is relatively steep in this period, and even small differences in the actual date of dentine formation might lead to differences in 14C ages, but x242 and x252 had the same intrinsic ages (both individuals died at 7–9 years of age). Unless x252 actually pre-dates x242, therefore, their 14C age difference must be due to dietary reservoir effects. Given the archaeological stratigraphic information (see above), x252 was the last individual interred in the grave, but it is the oldest in 14C years. Thus, even if a single-event interpretation were to be rejected, dietary reservoir effect corrections would be necessary to reconcile the 14C ages with the sequence of burials.
The IRMS analyses were carried out in duplicate, only the IRMS δ13C values were used for dietary analysis. Reported measurement uncertainties were small (δ13C±0.1, δ15N±0.2) and the repeated measurement standard errors are consistent with the reported uncertainties (δ13C 0.2, δ15N 0.3). Burials x243 and x244 died at similar ages and show comparable 14C ages and stable isotope values. This might be a case of twins, but as aDNA analyses have not been performed it is not possible to test whether they were indeed related.
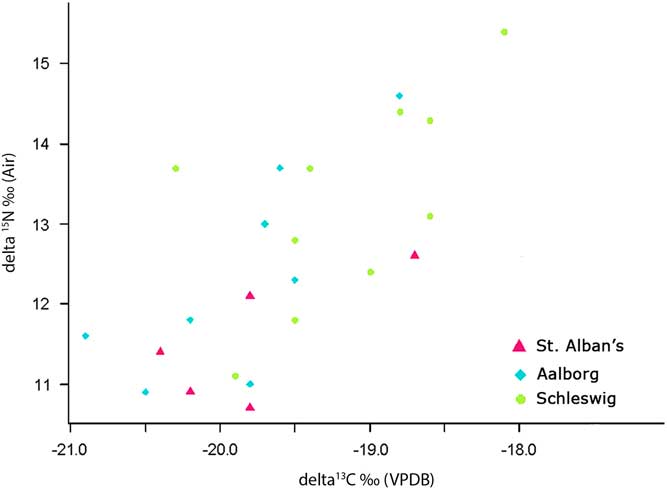
Stable isotope values for St Alban’s and two other medieval populations of comparable age-at-death are shown in Figure 3: eight juveniles from Aalborg, Northern Jutland (mean age=2.9 yr) (van der Sluis et al. Reference van der Sluis, Reimer and Lynnerup2016) and 10 juveniles from the late phase at Rathausmarkt in Schleswig, Northern Germany (mean age=1.6 yr) (Grupe et al. Reference Grupe, Von Carnap-Bornheim and Becker2013). The overall pattern approximates a mixing line between marine (higher δ13C and δ15N) and terrestrial diets. The St Alban’s individuals mainly cluster in the bottom left part of the plot, suggesting marine food might have played less of a role in medieval Odense than in contemporary Aalborg and Schleswig.
Stable isotope values from St Alban’s Odense, Aalborg Northern Jutland (van der Sluis et al. Reference van der Sluis, Reimer and Lynnerup2016) and Schleswig Northern Germany (Grupe et al. Reference Grupe, Von Carnap-Bornheim and Becker2013).

A single outlier from Schleswig has a significantly elevated δ15N signal, relative to its δ13C value, probably due to delayed weaning. When a child is breastfed, its δ15N values will become elevated, one trophic level higher than the mother, and gradually come down when other food sources are introduced. The duration and termination of this transition can vary between populations (Richards et al. Reference Richards, Mays and Fuller2002; Burt Reference Burt2013). Although it is possible that the Odense individuals were weaned within the period of M1 dentine formation, we expect any breastfeeding effect in our samples to be blurred and hard to detect as a result of bulk sampling (compared to incremental dentine samples: van der Sluis et al. Reference van der Sluis, Reimer and Lynnerup2016). However, the Odense δ15N values are relatively low compared to Aalborg and Schleswig, and give no indication of nursing effects.
DIETARY ANALYSIS
Human consumption of marine foods causes 14C age offsets, as marine organisms have global average 14C age of ca. 400 yr (Reimer et al. Reference Reimer, Bard, Bayliss, Beck, Blackwell, Ramsey, Buck, Cheng, Edwards, Friedrich, Grootes, Guilderson, Haflidason, Hajdas, Hatté, Heaton, Hoffmann, Hogg, Hughen, Kaiser, Kromer, Manning, Niu, Reimer, Richards, Scott, Southon, Staff, Turney and van der Plicht2013). The actual marine offset is defined by the difference between the marine and terrestrial calibration curves at any given point in time, which compared to the long-term average increased during the first half of the 15th century (Reimer et al. Reference Reimer, Bard, Bayliss, Beck, Blackwell, Ramsey, Buck, Cheng, Edwards, Friedrich, Grootes, Guilderson, Haflidason, Hajdas, Hatté, Heaton, Hoffmann, Hogg, Hughen, Kaiser, Kromer, Manning, Niu, Reimer, Richards, Scott, Southon, Staff, Turney and van der Plicht2013). To estimate the size of the offsets in individual samples, we need to quantitatively reconstruct the individual diet and give realistic estimates of 14C-depletion in the aquatic species consumed during the period of collagen formation. The 14C ages are correlated with the stable isotope values, and the dietary reservoir effects in our samples can therefore be attributed to high 15N and 13C foods. We would not expect this pattern if they had consumed significant amounts of freshwater fish from this region (Grupe et al. Reference Grupe, Von Carnap-Bornheim and Becker2013), which is why we choose not to consider 14C freshwater reservoir effects. Our focus is on dating the burials correctly, not on reconstructing the diet in great detailFootnote 1 .
Linear Mixing Model
We applied a linear mixing model to estimate the proportion of marine protein in the diet (Arneborg et al. Reference Arneborg, Heinemeier, Lynnerup, Nielsen, Rud and Sveinbjörnsdóttir1999), using δ13C endpoints of –21.7 for 100% terrestrial and –10.1 for 100% marine diets (Fischer et al. Reference Fischer, Olsen, Richards, Heinemeier, Sveinbjörnsdóttir and Bennike2007). Endpoints are corrected for 1‰ trophic-level shift from diet to consumer. These values were derived from Mesolithic and Neolithic faunal and marine species from Denmark, but we do not expect baseline values to have been significantly different in the medieval period. The linear mixing model approach does not provide a clear method for the propagation of uncertainties.
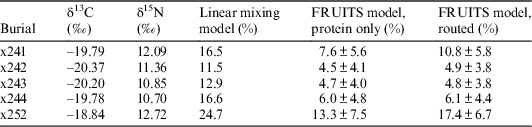
The linear mixing model estimates the five individuals to have consumed 11.5–24.7% marine protein; with x252 having consumed on average 10% more than the others (Table 3).
Estimated marine fish consumption, using different dietary models.

Bayesian Dietary Reconstruction
Next, a Bayesian dietary reconstruction model was applied to estimate the proportion of marine protein in the diet. We used the multi-proxy mixing model FRUITS (vers.3.), which allows us to consider the contribution of each food group to each isotope value and to incorporate the uncertainty in their isotopic values (Fernandes et al. Reference Fernandes, Millard, Brabec, Nadeau and Grootes2014a).
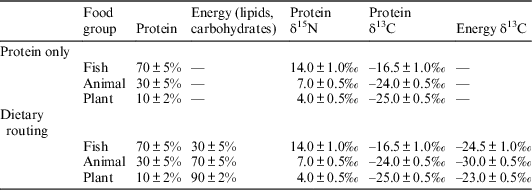
Our basic model assumes that three food groups were significant: plants, animals, and marine fish, and that protein was the only carbon source for human collagen. Stable isotope data on cereals (oats, hulled barley, rye) from three medieval sites in Odense (Hammers Reference Hammers2017) are used to estimate parameter values for plant foods. Isotope values for domestic animals (cattle, pig, sheep) on material from Viking Age Schleswig and medieval Schleswig (Doppler et al. Reference Doppler, Vohberger, von Carnap-Bornheim, Heinrich, Peters and Grupe2010) are used to estimate parameter values for animal foods. Parameter values for plant and animal foods are corrected for –2‰ carbon offset from collagen to protein and a –2‰ nitrogen offset from bulk to protein (Fernandes et al. 2012, Reference Fernandes, Millard, Brabec, Nadeau and Grootes2014a).
For marine fish (cod, perch, haddock, garfish, plaice, sturgeon), we used isotope values from Haithabu and Schleswig (Doppler et al. Reference Doppler, Vohberger, von Carnap-Bornheim, Heinrich, Peters and Grupe2010). These values are not weighted by species prevalence, and significantly do not include herring. In the Middle Ages, the herring markets in the Øresund exported vast quantities of salted herring to all of Northern Europe, but by the beginning of the 15th century the herring stock started to dwindle and the trade soon lost its importance (Etting Reference Etting2004). The St Alban’s AMS dates point towards a burial event after AD 1400, where herring most likely did not contribute significantly to the marine diet and can therefore be ignored. Marine parameter values are corrected by –2‰ carbon and +2‰ nitrogen offsets from collagen to protein (Fischer et al. Reference Fischer, Olsen, Richards, Heinemeier, Sveinbjörnsdóttir and Bennike2007; Fernandes et al. Reference Fernandes, Meadows, Dreves, Nadeau and Grootes2014b).
It is difficult to define a specific food group, but from other studies we expect the population of Medieval Odense to have consumed animal products like milk, cheese and eggs, but very little actual flesh, animal or fish (Yoder Reference Yoder2010; Ervynck et al. Reference Ervynck, Boudin, van den Brande and van Strydonck2014). As a consequence the prior constraint that plant food consumption will exceed that of animal foods is imposed. A diet to collagen offset of 4.8±0.5‰ for δ13C and 4.5±1.0‰ for δ15N is assumed (Fernandes et al. Reference Fernandes, Millard, Brabec, Nadeau and Grootes2014a). Table 4 summarizes the parameter values applied in our basic model.
Parameter values for three food groups used in FRUITS models.

The Bayesian dietary reconstruction model cannot distinguish plant and animal foods, which given the uncertainty in diet-collagen offsets are too isotopically similar. It is able to identify marine food as it has more distinct isotopic values, and estimates the five individuals to have consumed 4.5–13.3% marine protein, but with large uncertainty levels, reflecting the combined uncertainties of the model.
Dietary Routing
A dietary proxy signal not only reflects the consumed food groups, but more specifically the food group fractions such as e.g. carbohydrates and lipids. These macronutrients do not contribute proportionately to the proxy signal in collagen, which is formed predominantly from dietary protein, but they do have some influence. Dietary routing can be incorporated in FRUITS to provide more accurate dietary estimates (Fernandes et al. Reference Fernandes, Millard, Brabec, Nadeau and Grootes2014a).
We constructed a model considering both protein and energy macronutrients (carbohydrates and lipids) as food fractions; human collagen is assumed to derive 75±5% of its carbon from protein, and the balance from energy macronutrients. The same offset values from bulk and collagen to protein values apply as in the model above, but a –2‰ carbon offset from bulk to energy is added for plant values and likewise from collagen to energy for animal values (Fernandes et al. Reference Fernandes, Nadeau and Grootes2012; Fernandes et al. Reference Fernandes, Millard, Brabec, Nadeau and Grootes2014a). Marine parameter values include a –10‰ δ13C offset from collagen to energy (Fischer et al. Reference Fischer, Olsen, Richards, Heinemeier, Sveinbjörnsdóttir and Bennike2007; Fernandes et al. Reference Fernandes, Meadows, Dreves, Nadeau and Grootes2014b). As above the model assumes a diet to collagen fractionation of 4.8±0.5‰ for δ13C and 4.5±1.0‰ for δ15N (Fernandes et al. Reference Fernandes, Millard, Brabec, Nadeau and Grootes2014a). Again the prior constraint that plant food consumption will exceed that of animal foods is imposed, and protein intake is limited to 10–40% of total calories consumed. Table 4 summarizes the parameter values applied in the model.
As before, the dietary routing model cannot distinguish plant and animal foods, but is able to identify marine food. It estimates the five individuals to have consumed 4.8–17.4% marine calories, again with large uncertainty levels.
The three dietary reconstruction models report differing intakes of marine food, but not alarmingly so given the large uncertainties. Nevertheless, all models appear to under-estimate the marine contribution to diet, given 14C-age differences between individuals. If the marine foods had a reservoir effect close to the global marine average, a dietary reservoir effect of >100 yr in individual x252 would require at least 25% of the carbon in this sample’s collagen to be derived from marine foods. The linear mixing model provides this, whereas the two FRUITS models give more conservative estimates (Table 3). When we take into account that the marine offset was slightly higher than the long-term mean in the first decades of the 15th century when the collagen was formed, this could explain some of the apparent underestimation in the FRUITS model. Another factor could be that our preferred plant δ13C parameter values in the FRUITS model are too positive, or that there is a more 14C-depleted food source (i.e. freshwater fish). The linear mixing model employs such slightly lower δ13C values for terrestrial end-members and slightly higher values for marine end-members, but we are more confident using actual isotope data for the different food groups. The dietary routing model incorporates more information on food group fractions and isotopic offsets, and better reflects what we know about the potential diets of these individuals.
Diet and Dating: OxCal Model for Grave 156, St Alban’s Odense
We use OxCal v4.3.2 and the IntCal13 and Marine13 international calibration curves with the resolution set to one year (Bronk Ramsey Reference Bronk Ramsey2009; Reimer et al. Reference Reimer, Bard, Bayliss, Beck, Blackwell, Ramsey, Buck, Cheng, Edwards, Friedrich, Grootes, Guilderson, Haflidason, Hajdas, Hatté, Heaton, Hoffmann, Hogg, Hughen, Kaiser, Kromer, Manning, Niu, Reimer, Richards, Scott, Southon, Staff, Turney and van der Plicht2013). The five 14C dates are calibrated with a mix of terrestrial and marine carbon inputs, defined by the FRUITS dietary routing model (Table 4 and footnoteFootnote 2 ). Individual calendar age offsets between 5.3±1.0 yr and 14.4±1.5 yr are applied.
The marine 14C age varies at the regional level and requires offset correction using local ΔR values. It was difficult to determine the geographical origin of the consumed marine food and thereby finding an appropriate ΔR value for our OxCal model. A new ancient DNA study of cod from Viking-age Haithabu has revealed its origin to be Arctic, probably caught at Lofoten and traded as dried fish as far as Northern Germany (Star et al. Reference Star, Boessenkool, Gondek, Nikulina, Hufthammer, Pampoulie, Knutsen, André, Nistelberger, Dierking, Petereit, Heinrich, Jakobsen, Stenseth, Jentoft and Barrett2017). The mean of the nearest 100 ΔR data points to Odense on Chrono Marine Reservoir DatabaseFootnote 3 , which cover the Baltic, eastern North Sea and the Norwegian Sea, was statistically no different from zero (32±18 SE) and it was therefore decided not to include a local ΔR correction. The marine component was therefore calibrated using the global marine calibration model (Reimer et al. Reference Reimer, Bard, Bayliss, Beck, Blackwell, Ramsey, Buck, Cheng, Edwards, Friedrich, Grootes, Guilderson, Haflidason, Hajdas, Hatté, Heaton, Hoffmann, Hogg, Hughen, Kaiser, Kromer, Manning, Niu, Reimer, Richards, Scott, Southon, Staff, Turney and van der Plicht2013).
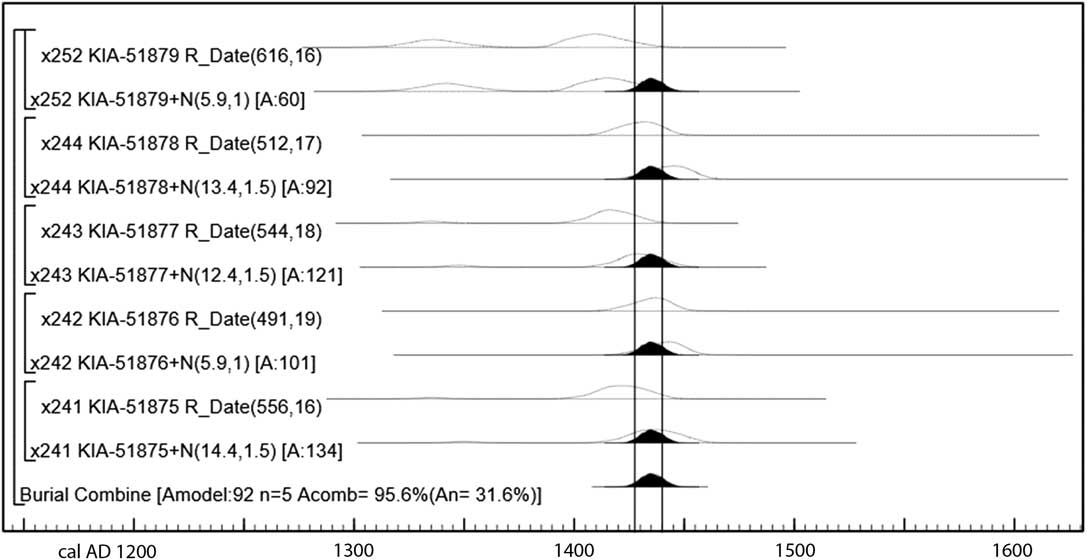
The archaeological excavation information shows the five burials to be contemporaneous, but their combined calibrated dates are statistically inconsistent (see above). When applying the estimated marine consumption given by the linear mixing model, the OxCal output gives a 95.4% probability of the burial date to be AD 1438–1452, but with a very poor index of agreement (Amodel=33.6), whereby the model is rejected. When applying the estimates from the FRUITS protein-only model, the OxCal output gives a 95% probability of the burial date to be AD 1423–1443 (Amodel=78). The index is satisfactory for the model, but poor for the individual date of x252 (A: 37), whose diet-correction is insufficient to fit the single-event model. We therefore choose to reject this model as well. Finally when applying the estimates from the dietary routing model, the OxCal output gives a 95% probability of the burial date to be AD 1425–1445 with a mean of 1435±5 (Amodel=92, Figure 4). Individual x252 (A: 60) has a satisfactory index showing the diet-correction to be sufficient to be compatible with a single event and we accept the model.
Estimated burial date of St Alban’s grave 156 using the routed diet reconstruction proposed in this paper (above). OxCal indices for individual dates (A) are at or above the >60 threshold, indicating satisfactory agreement of individual calibrations assuming the five individuals are contemporary. Vertical lines indicate plague events AD 1427–1428 and 1440 discussed in this paper (below).

The archaeological context of the grave provides very little prior information besides the five individuals being buried with an arm position B, which has a wide date range between mid-13th to mid-15th centuries. Few arm position B are expected to date to the 15th century, but given the large chronological overlap of positions, the archaeological information does not contradict our proposed date of the burial.
Given the results above we can now try to relate the burial event to the historical information on plague epidemics in Denmark. Bisgaard mentions two events possibly coinciding with St Alban’s grave 156; AD 1427–1428 and 1440. He states the first event to be uncertain although not improbable, whereas the latter event is reasonably certain (Bisgaard Reference Bisgaard2009). The 95% probability range of our FRUITS routed dietary model overlap both events, making it difficult to decide which is more likely.
Given the 14C-age differences of the individuals we expected a dietary reservoir effect of >100 yr in individual x252 (i.e., at least 25% of the carbon in x252’s collagen should be from marine foods). The model estimated x252 to have consumed 17.4% marine protein, which appears to underestimate the marine contribution to the diet. Increasing the marine contribution would make the burial younger, which is why we believe the real calendrical date of the burial is likely somewhere in the younger part of the range. Accordingly we find the younger plague event AD 1440 to be the most plausible. Whether the five individuals were indeed plague victims or instead died from some other epidemic disease around the same time is impossible to ascertain given our current understanding.
CONCLUSION
We have shown, by exploiting differences in dietary reservoir effects it is possible to refine the dates of multiple burials, and potentially date such events to within a range of <20 years. By combining archaeological, osteological and paleodiet research in a Bayesian framework we were able to date St Alban’s grave 156 to AD 1425–1445 (95% probability), an interval in which two plague epidemics took place in Denmark. It was not possible to establish a positive link between the grave and a plague event, as to do so would require aDNA analyses.
ACKNOWLEDGMENTS
Analyses were funded through the Center for Baltic and Scandinavian Archaeology (ZBSA)’s Man and Environment research theme, including subproject G1: Timescales of Change - Chronology of cultural and environmental transformations of the Collaborative Research Center Scales of Transformation: Human-environmental Interaction in Prehistoric and Archaic Societies (DFG-SFB 1266). The authors would like to thank Odense City Museum for giving access and permission to sample the teeth. We would also like to thank the anonymous reviewers for their constructive comments and valuable input on the manuscript.