





1 Introduction
When focused light intensity of the petawatt-scale femtosecond laser reaches
${10}^{22-23}\;\mathrm{W}/{\mathrm{cm}}^2$
 , unprecedented phenomena of the quantum electrodynamics (QED) and ultrafast transient high-energy-density physical processes can be induced in the laboratory, which makes it a unique utility for fundamental and cutting-edge research[
Reference Liseykina, Popruzhenko and Fedotov
1
,
Reference Shou, Wu, Pae, Ahn, Kim, Kim, Yoon, Sung, Lee, Gong, Yan, Choi and Nam
2
]. Petawatt lasers are now widely employed in the study of secondary radiative sources[
Reference Midorikawa
3
], particle acceleration[
Reference Caizergues, Smartsev, Malka and Thaury
4
] and laboratory astrophysics[
Reference Despotopulos, Gharibyan, Moody, Yeamans, Velsko and Shaughnessy
5
]. Over the past decades, more than 200 laser systems, delivering output powers ranging from hundreds of terawatts to several petawatts, have been constructed[
Reference Danson, Haefner, Bromage, Butcher, Chanteloup, Chowdhury, Galvanauskas, Gizzi, Hein, Hillier, Hopps, Kato, Khazanov, Kodama, Korn, Li, Li, Limpert, Ma, Nam, Neely, Papadopoulos, Penman, Qian, Rocca, Shaykin, Siders, Spindloe, Szatmari, Trines, Zhu, Zhu and Zuegel
6
, Reference Li, Leng and Li
7
], while projects aiming at tens to hundreds of petawatts of peak power are currently under development[
Reference Li, Gan, Yu, Wang, Liu, Guo, Xu, Xu, Hang, Xu, Wang, Huang, Cao, Yao, Zhang, Chen, Tang, Li, Liu, Li, He, Yin, Liang, Leng, Li and Xu
8
–
Reference Khazanov, Shaykin, Kostyukov, Ginzburg, Mukhin, Yakovlev, Soloviev, Kuznetsov, Mironov, Korzhimanov, Bulanov, Shaikin, Kochetkov, Kuzmin, Martyanov, Lozhkarev, Starodubtsev, Litvak and Sergeev
12
]. Key parameters defining the beam quality of these high-power petawatt laser systems for strong-field experiments include pulse contrast (traditionally referring to the value several picoseconds to several hundreds of picoseconds before the main pulse peak), spatial profile of the focal spot and peak intensity achieved on target. Significant efforts have been devoted to addressing these challenging issues, leading to the development of advanced techniques for laser system optimization. A typical petawatt femtosecond laser system usually consists of three main components: a millijoule-level frontend, a hundreds-of-joules-level amplification chain and a vacuum target chamber equipped with a pulse compressor and diagnostic suite. Firstly, the frontend seeder must exhibit high stability and achieve an extremely high pulse contrast, reaching or exceeding
${10}^{12}$
 , which has been extensively studied and addressed through various configurations developed by numerous laboratories. Supercontinuum spectrum generation has enabled the successful development of millijoule-level seeder systems with tens-of-femtosecond durations at the European Extreme Light Infrastructure (ELI) facilities[
Reference Indra, Batysta, Hribek, Novak, Hubka, Green, Antipenkov, Boge, Naylon, Bakule and Rus
13
–
Reference Nagymihály, Kalashnikov, Lehotai, Pajer, Bohus, Csernus-Lukács, Csontos, Tóth, Tari, Balciunas, Kucinskas, Stanislauskas and Börzsönyi
15
], while multistage optical parametric chirped pulse amplification (OPCPA) has been employed at the ELI, Station of Extreme Light Science (SEL)[
Reference Wang, Liu, Lu, Chen, Long, Li, Chen, Chen, Bai, Li, Peng, Liu, Wu, Wang, Li, Xu, Liang, Leng and Li
16
], Appllon[
Reference Papadopoulos, Ramirez, Genevrier, Ranc, Lebas, Pellegrina, Le Blanc, Monot, Martin, Zou, Mathieu, Audebert, Georges and Druon
17
], Shanghai Superintense Ultrafast Laser Facility (SULF)[
Reference Yu, Xu, Liu, Li, Li, Liu, Li, Wu, Yang, Yang, Wang, Lu, Leng, Li and Xu
18
] and Gwangju petawatt laser system in the Republic of Korea[
Reference Sung, Lee, Yoo, Yoon, Lee, Yang, Son, Jang, Lee and Nam
19
]. There are three primary types of main amplifier employed to boost the chirped pulse energy up to the hundreds-of-joules level. Neodymium-doped glass amplifiers represent the first and most widely adopted type in laser fusion laboratories, designed to generate kilojoule-level picosecond pulses for fast ignition applications[
Reference Williams, Crane, Alessi, Boley, Bowers, Conder, Di Nicola, Nicola, Haefner, Halpin, Hamamoto, Heebner, Hermann, Herriot, Homoelle, Kalantar, Lanier, LaFortune, Lawson, Lowe-Webb, Morrissey, Nguyen, Orth, Pelz, Prantil, Rushford, Sacks, Salmon, Seppala, Shaw, Sigurdsson, Wegner, Widmayer, Yang and Zobrist
20
–
Reference Musgrave, Galimberti, Boyle, Hernandez-Gomez, Kidd, Parry, Pepler, Winstone and Collier
23
]. These systems can support beam apertures up to the meter scale, but are limited to only a few nanometers of bandwidth. Ti:sapphire crystals serve as the gain medium in the second type of main chirped pulse amplification (CPA) system, operating at a central wavelength of 800 nm and supporting pulses as short as approximately 30 fs. This conventional configuration has been widely adopted in most ultrashort, ultrahigh-intensity femtosecond laser systems, including the SULF 10 PW laser in Shanghai[
Reference Li, Gan, Yu, Wang, Liu, Guo, Xu, Xu, Hang, Xu, Wang, Huang, Cao, Yao, Zhang, Chen, Tang, Li, Liu, Li, He, Yin, Liang, Leng, Li and Xu
8
], ELI-NP’s dual-10 PW beams in Romania[
Reference Lureau, Matras, Chalus, Derycke, Morbieu, Radier, Casagrande, Laux, Ricaud, Rey, Pellegrina, Richard, Boudjemaa, Simon-Boisson, Baleanu, Banici, Gradinariu, Caldararu, Boisdeffre, Ghenuche, Naziru, Kolliopoulos, Neagu, Dabu, Dancus and Ursescu
9
], Gwangju-4.2 PW in the Republic of Korea[
Reference Sung, Lee, Yoo, Yoon, Lee, Yang, Son, Jang, Lee and Nam
19
], ELI-Beamlines L2 and L3 in Czech Republic, BELLA, HAPLS, ALEPH and DIOCLES in the United States, J-KAREN in Japan, Gemini in the UK, VEGA-3 in Spain, DRACO and ATLAS in Germany, among others[
Reference Danson, Haefner, Bromage, Butcher, Chanteloup, Chowdhury, Galvanauskas, Gizzi, Hein, Hillier, Hopps, Kato, Khazanov, Kodama, Korn, Li, Li, Limpert, Ma, Nam, Neely, Papadopoulos, Penman, Qian, Rocca, Shaykin, Siders, Spindloe, Szatmari, Trines, Zhu, Zhu and Zuegel
6
]. The third type of main amplifier chain is OPCPA, first proposed by Ross et al. in 1997[
Reference Ross, Matousek, Towrie, Langley and Collier
24
]. It offers a significantly broader gain spectrum and a smoother spectral profile compared to Ti:sapphire amplifiers. Moreover, it can maintain pulse widths as narrow as below 10 fs, owing to the intrinsic suppression of gain shifting and saturation effects. Several petawatt-level peak powers have been successfully achieved using this amplifier configuration[
Reference Zhu, Xie, Sun, Kang, Yang, Guo, Zhu, Zhu, Gao, Liang, Cui, Yang, Zhang and Lin
25
, Reference Zeng, Zhou, Zuo, Zhu, Su, Wang, Wang, Huang, Jiang, Jiang, Guo, Xie, Zhou, Wu, Mu, Peng and Jing
26
]. To achieve the smallest possible focal spot, a deformable mirror for wavefront correction is typically positioned before or after the compressor, with spot sizes as small as 2–3 μm reported in several ultrahigh-power femtosecond laser systems. The target and pulse compressor are all housed in a vacuum environment, equipped with physical detectors and pulse parameter diagnostics. Upon laser firing, the light intensity on the target can reach up to
${10}^{22}\;\mathrm{W}/{\mathrm{cm}}^2$
 . This demands a pulse contrast better than
${10}^{11}$
 requiring the pre-pulse intensity to remain below
${10}^{12}\;\mathrm{W}/{\mathrm{cm}}^2$
 to prevent premature target evaporation prior to the main interaction. Numerous techniques have been developed and implemented throughout petawatt laser systems to enhance pulse contrast. A plasma mirror (PM)[
Reference Thaury, Quéré, Geindre, Levy, Ceccotti, Monot, Bougeard, Réau, d’Oliveira, Audebert, Marjoribanks and Martin
27
] is often placed before the target to sharpen the leading edge of the focused laser pulse by two to four orders of magnitude. In OPCPA configurations, precise spatial and temporal overlap between the signal and pump beams is maintained to minimize fluorescence during amplification. In the frontend seeder, methods such as saturable absorbers[
Reference Fourmaux, Payeur, Buffechoux, Lassonde, St-Pierre, Martin and Kieffer
28
], self-diffraction[
Reference Liu, Okamura, Kida and Kobayashi
29
], crossed-polarized wave generation[
Reference Chvykov, Rousseau, Reed, Kalinchenko and Yanovsky
30
] and picosecond optical parametric amplification[
Reference Papadopoulos, Ramirez, Genevrier, Ranc, Lebas, Pellegrina, Le Blanc, Monot, Martin, Zou, Mathieu, Audebert, Georges and Druon
31
–
Reference Chalus, Pellegrina, Ricaud, Casagrande, Derycke, Soujaeff, Rey, Radier, Matras, Boudjemaa, Simon-Boisson, Laux and Lureau
36
] are commonly combined to achieve pulse contrasts of
${10}^{11}$
 or better. However, this often results in a highly complex frontend structure, potentially compromising the overall laser system stability. As recognized in high-power femtosecond laser engineering, the shortest pulse duration, smallest focal spot and highest pulse contrast are inherently interrelated due to spatiotemporal coupling effects[
Reference Akturk, Gu, Zeek and Trebino
37
, Reference Jeandet, Jolly, Borot, Bussière, Dumont, Gautier, Gobert, Goddet, Gonsalves, Irman, Leemans, Lopez-Martens, Mennerat, Nakamura, Ouillé, Pariente, Pittman, Püschel, Sanson and Sylla
38
]. Maintaining all parameters at their optimal levels is a significant challenge. Extensive efforts have been devoted by research laboratories worldwide to address this issue. Herein, this study investigates theoretical frameworks and practical approaches to enhance pulse contrast and focal spot quality within the Shenguang II (SG-II) petawatt laser system, which has been operational and utilized for physical experiments since 2018[
Reference Zhu, Xie, Sun, Kang, Yang, Guo, Zhu, Zhu, Gao, Liang, Cui, Yang, Zhang and Lin
25
]. Without employing specialized techniques specifically aimed at maximizing pulse contrast, we designed a multistage OPCPA scheme operating on a nanosecond timescale. By optimizing the pump energy distribution across the two OPCPA stages, we successfully achieved a pulse contrast of
${10}^{11}$
 . A spatial dispersion compensator and a deformable mirror were placed before the main pulse compressor, enabling more than 65% of the enclosed pulse energy to be concentrated within a 4-μm focal spot. Regarding on-target pulse contrast, several factors can degrade the performance, including pump fluorescence originating from the main amplifiers and spatiotemporal coupling induced by the surface roughness of large optical components. In the absence of any contrast-enhancement techniques, the measured on-target pulse contrast was approximately
${10}^8$
 . In this work, the effectiveness of a PM is evaluated and experimentally validated at the full energy of about 30 J, resulting in a final on-target pulse contrast exceeding
${10}^{11}$
 . These findings are of significant importance for the future operation of the SG-II femtosecond petawatt laser system and offer valuable insights for researchers working in the field of ultrashort, ultrahigh-power lasers. Further details are provided in the following sections.
2 Overview of the Shenguang II femtosecond petawatt laser
The SG-II femtosecond petawatt laser, illustrated schematically in Figure 1, employs a fully OPCPA architecture. Initially, femtosecond pulses from a commercial Ti:sapphire oscillator are stretched to approximately 2.5 ns. These pulses then pass through a cascading tiny compressor – designed for fine-tuning the final pulse duration – shortening the duration to 2.2 ns. Subsequently, the pulses are amplified by a non-collinear OPCPA preamplifier, producing a 1.0 Hz, 160 mJ, 2.2 ns chirped pulse train. The master optical parametric chirped pulse amplifier utilizes the seventh beam of the SG-II nanosecond facility as the pump source and, positioned after a spatial dispersion compensator, boosts the chirped pulse energy to approximately 45 J in single-shot operation. The end area comprises a main pulse compressor and an off-axis parabolic mirror, delivering pulses of about 21 fs duration and 37 J energy onto the target. The system operates at a central wavelength of 800 nm and is synchronized with the SG-II nanosecond facility with a timing jitter of less than 10 ps (root mean square, RMS) under routine operational conditions.
Schematic of the SG-II femtosecond petawatt laser system. The BBO-crystal-based OPCPA frontend utilizes a commercial mode-locked Ti:sapphire laser centered at 808 nm as the signal, pumped by a 450 mJ, frequency-doubled Nd:YAG laser. It generates a 1 Hz, 2.2 ns pulse train, delivering approximately 160 mJ energy and 80 nm bandwidth to the OPCPA master amplifier that employs an LBO crystal as the gain medium and is pumped by the harmonic of the SG-II Nd:glass laser facility, which produces a pulse with energy exceeding 45 J and spectral width of approximately 60 nm.

Figure 1 Long description
The flowchart is divided into two main sections.
Bottom Layer:
- At the bottom left, a Ti:S oscillator (7 fs, 150 m W, 78 M Hz) sends a red signal through a pulse stretcher (25.5 ps per nm) and a mini compressor (4.2 ps per nm).
- The signal passes through spatial filter S F 1 and enters a series of B B O crystals (B B O-1 through B B O-4) arranged in an O P C P A configuration.
- A parallel pump line starts at a C W fiber laser (10 m W, 1064 nm), passing through an A M and A W G, into a Regenerative Amplifier / Y A G, and then a Rod amplifier (K D P: 450 m J, 2.2 ns).
- This green pump beam is split and directed into the B B O crystals to amplify the red signal.
- A synchronization system includes a 1 Hz clock, fast detector, and Syn. out module with four channels.
Top Layer:
- The amplified signal from the bottom layer enters the top section through spatial filter S F 3 and two lambda over 4 plates.
- It passes through S F 4 and enters a large L B O crystal.
- A high-energy green pump beam (From S G - I I 2 omega, 120 J, 526.5 nm, 1.6 ns) is injected into the L B O crystal, with unused energy caught by a Birdcage dump.
- The signal continues through S F 5 and an A O element.
- A final pump beam (From S G - I I 2 omega, 200 J, 526.5 nm, 2.0 ns) enters the target chamber area.
- The red signal beam enters a large vacuum compressor containing four gratings before being focused by an O A P (Off-Axis Parabola) onto the Target inside the main chamber.
The SG-II femtosecond petawatt laser has been operational for physical experiments since 2018. It has achieved a maximum peak power exceeding 1.76 PW, delivering an on-target intensity of approximately
${10}^{20}\;\mathrm{W}/{\mathrm{cm}}^2$
 and a pulse contrast superior to
${10}^{11}$
 . Over the past years, numerous collaborative experiments have been conducted on this system, demonstrating its reliability and stability within the ultrafast and ultrahigh-power laser community[
Reference Xia, Kong, He, Guo, Zhang, Yang, Cheng, Li, Yan, Liang, Zhu, Xie, Zhu, Li, Lin, Ma and Yan
39
, Reference Liang, Yi, Li, Zhu, Xie, Liu, Mu, Liu, Guo, Kang, Yang, Zhu, Gao, Sun, Lu, Ma, Mondal, Papp, Majorosi, Lécz, Andreev, Kahaly, Kamperidis, Hafz and Zhu
40
].
3 Contrast enhanced preamplifiers
High pulse contrast is critical for petawatt-scale and even higher-power femtosecond laser systems. As focused laser intensities now exceed
${10}^{22}\,\mathrm{W}/{\mathrm{cm}}^2$
 , the pedestal or pre-pulses preceding the main pulse can reach
${10}^{9}-10^{12}\;\mathrm{W}/{\mathrm{cm}}^2$
 , potentially causing premature target damage before the peak of the pulse arrives in an interaction experiment. Consequently, pulse contrast has become a major interest in ultrafast and ultrahigh-power laser research. Temporal contrast is generally categorized into two types: coherent and incoherent. Coherent contrast arises from higher-order dispersion, spatial modulation and secondary reflective sub-pulses – effects that are theoretically predictable and can be mitigated using various optical compensation techniques. Meanwhile, incoherent contrast originates from light fluctuations, amplification fluorescence and spatiotemporal coupling induced by optical surface roughness, which may degrade or intensify during high-energy saturable amplification. We investigated pulse contrast enhancement in the frontend of the SG-II femtosecond petawatt laser, employing a two-stage OPCPA preamplifier configuration, as illustrated in Figure 2. Each OPCPA stage consists of two beta barium borate (BBO) crystals that are cut in Type I phase-matching at an angle of
$23.8{}^{\circ}$
 and an internal non-collinear angle of
$2.36{}^{\circ}$
 . All BBO crystals have a wedge angle of
$1.0{}^{\circ}$
 to prevent parametric oscillation and post-pulse generation, and are coated with antireflection dielectric film at 532 nm and 808 ± 60 nm. The lengths of the two BBO crystals used in stage 1 are both 23 mm, while the other two in stage 2 are 13 and 10 mm, respectively. A frequency-doubled neodymium-doped yttrium aluminum garnet (Nd:YAG) laser, whose original seed was sheared from a continuous-wave (CW) fiber laser by an integrated optical amplitude modulator, triggered by femtosecond pulses of the femtosecond oscillator at a synchronizing resolution of 3 ps (RMS), delivers a 1 Hz, 450 mJ pulse train with top-hat spatial and temporal profiles, serving as the pump source. The laser exhibits an RMS stability of 1.1% and a full width at half maximum (FWHM) duration of 2.2 ns. The beam is split into two arms by a beam splitter – comprising a half-wave plate and a polarizer – to independently pump the two OPCPA stages. The signal pulses are generated by a commercial Ti:sapphire oscillator, delivering a pulse duration of approximately 7 fs, repetition rate of 75 MHz and average power of 150 mW. These pulses are temporally stretched to 2.2 ns using an Öffner stretcher and the tiny compressor. In the first OPCPA stage, two BBO crystals are employed to achieve a gain of approximately
$5\times {10}^7$
 . The second stage produces an output signal energy of approximately 160 mJ. The two stages yield a net gain of
$8\times {10}^8$
 for the entire frontend. The final chirped pulse is then directed into a four-grating Treacy compressor for pulse duration and contrast characterization.
OPCPA preamplifiers of the SG-II femtosecond petawatt laser system.

Figure 2 Long description
A technical diagram illustrating the laser beam path through several components.
* At the top center, a Ti sapphire oscillator approximately 10 f s serves as the source.
* To the left, the beam enters a stretcher labeled 25.5 p s forward slash n m, enclosed in a blue box.
* Below the oscillator, the beam splits. One path leads to a 450 m J green pump beam.
* The main path enters O P C P A 1, a dashed blue enclosure at the bottom. This section contains two yellow crystals labeled B B O 1 and B B O 2. A 52 m J energy label is positioned near the input.
* The green pump beam passes through a 398 m J stage and a time delay box before entering O P C P A 2.
* O P C P A 2, a dashed blue enclosure at the top right, contains two yellow crystals labeled B B O 3 and B B O 4.
* The amplified beam finally enters a compressor labeled 25.5 p s forward slash n m on the far right.
* The output at the bottom right is a pulse labeled 20 f s.
* Various mirrors, lenses, and beam splitters are indicated by black rectangles and diagonal lines throughout the path.
We investigate the incoherent noise at the frontend of the SG-II femtosecond petawatt laser system. In the optical parametric chirped pulse amplifier, only photons satisfying the phase-matching condition are effectively amplified and thus experience significant gain, while off-phase-matched components remain negligibly small and can be ignored initially. To analyze the evolution of pulse contrast during amplification, we propose a model treating the signal and noise as two distinct laser modes that competitively amplify within a single OPCPA stage. Given the initially weak nature of the noise, its behavior can be evaluated by solving the coupled wave equations under the slow-varying envelope approximation, yielding the total gain G [ Reference Ross, Matousek, Towrie, Langley and Collier 41 ]:

where
$\alpha$
 is the gain coefficient,
$L$
 is the crystal length and
${I}_\mathrm{p}$
 is the pump intensity. However, for large signals, analytical solutions are unavailable, and the behavior of the noise can only be studied through numerical simulations, except in the near-saturation regime where the pump energy is nearly fully converted into the signal. In this case, solving the coupled wave equations yields the total gain
$G\sim L$
 , which is typically several orders of magnitude lower than that observed for small signals (i.e., the noise). Assuming the input seeder intensity is sufficiently low, evidently, its gain is nearly identical to that of the phase-matched noise, as minimal mode competition occurs in the small-signal amplification regime where the pump intensity remains almost constant. To evaluate the evolution of pulse contrast, we consider the original femtosecond pulse from the Ti:sapphire oscillator, which has a typical contrast of approximately
${10}^4$
 . After stretching, the pulse duration is chirped to the nanosecond level and then injected into the optical parametric chirped pulse amplifier. Since the noise component is uncompressible, the pulse contrast after the optical parametric chirped pulse amplifier can be approximately estimated by the following:

where
$\mathrm{SN}_0$
 denotes the input pulse contrast, which is filtered by the stretcher and further reduced by the phase-matching condition of the OPCPA preamplifier, and can be nearly zero or improved by several orders of magnitude compared to the contrast at the oscillator output. Here,
${\tau}_\mathrm{chirp}$
 and
${\tau}_\mathrm{femto}$
 are the widths of the chirped pulse and original femtosecond seed pulse, while
${G}_\mathrm{signal}$
 and
${G}_\mathrm{noise}$
 are the gain of the signal and noise, respectively. For small-signal amplification, the typical contrast usually ranges from
${10}^9$
 to
${10}^{12}$
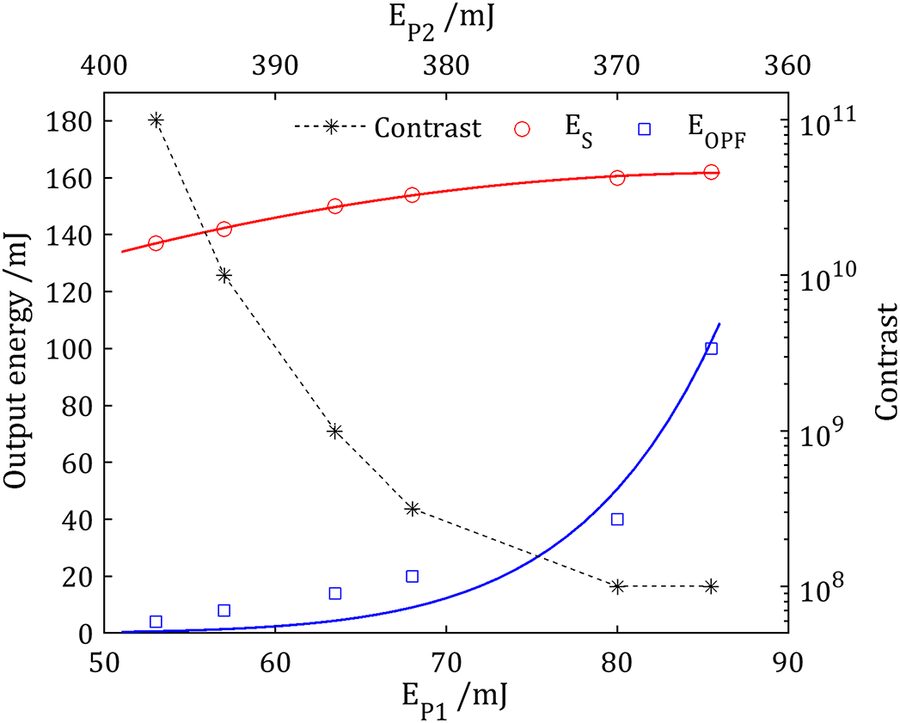
 , as the gains of the signal and noise are nearly equal. The evolution of pulse contrast in high-energy optical parametric chirped pulse amplifiers is highly complex and can deteriorate, improve or remain unchanged depending on specific operating conditions. In particular, in cascaded amplifiers, noise generated in the preceding stage often satisfies the phase-matching condition of the subsequent stage. When operating at moderate gain, this noise can extract a significant portion of the residual pump energy and experience higher amplification, leading to degraded pulse contrast. However, in the near-saturation regime, most of the pump energy is converted into the signal, leaving little for noise amplification. Consequently, the noise gain may equal to or even fall below that of the signal, resulting in stabilized or enhanced pulse contrast. Currently, there is no model that perfectly describes pulse contrast evolution in high-energy OPCPA systems. To suppress noise gain, an effective approach is to employ thinner nonlinear crystals and higher pump intensities. To experimentally investigate the trend of contrast evolution and maintain high pulse contrast in the frontend of the SG-II femtosecond petawatt laser system, we studied the evolution of optical parametric fluorescence (OPF) at the second OPCPA preamplifier by putting a shutter in the optical path of the signal to block it, as well as its impact on pulse contrast. Meanwhile, fluorescence at stage 1 is too low to measure and is not determinative. Since gain plays a critical role in noise suppression while preserving high output energy, the total pump energy was kept constant at 450 mJ, with pump energy distribution adjusted between the two OPCPA preamplifiers. The compressed pulse was characterized using a third-order cross-correlator (Sequoia 800, Amplitude Technologies) for pulse contrast evaluation.
The results of output signal energy, fluorescent noise (with signal blocked) and final pulse contrast are presented in Figure 3. It can be observed that as the pump energy E
P1 increases from 53 to 88 mJ, the fitted curves show a rapid rise in OPF from 4 to 120 mJ, while the signal energy increases only slightly from 142 to 162 mJ. The total gain ranges from
$7.1\times {10}^8$
 to
$8\times {10}^8$
 , indicating that the signal output remains stable, whereas the fluorescence grows significantly with increasing pump energy in the first preamplifier. Clearly, the second OPCPA preamplifier primarily serves to boost energy, achieving a conversion efficiency of nearly
$40\%$
 and a signal gain of approximately 20. However, the noise exhibits a much higher gain – reaching several tens of orders – leading to a degradation in the final pulse contrast from
${10}^{11}$
 to
${10}^8$
 . The measured pulse contrast under different pump energy configurations in the two preamplifiers is illustrated in Figure 4, revealing an optimal combination: 52 mJ for the first preamplifier and 398 mJ for the second. Under these conditions, a pulse contrast exceeding
${10}^{11}$
 is finally obtained. Meanwhile, in the embedded figure, pulse contrast close to the pulse peak is quite complicated as it is dominated primarily by the level of residual dispersion rather than OPF. Even though relatively high values are retained, they do not coincide with the allocation of the pump energy. This is why we see that the contrast around the main pulse is poorer for 52 mJ first pump energy than that for 57 mJ. We think this may be caused by dispersion fluctuations between the laser pluses. We do not show results of the wider range at the other side of the pulse peak, because they are not usually of concern for strong-field physical experiments.
Measured pulse contrast versus pump energy allocation between two OPCPA preamplifiers at the frontend of the SG-II femtosecond petawatt laser system (black dotted curve). E P1 and E P2 are pump energies for the first and second OPCPA preamplifiers, while E S (red curve) and E OPF (blue curve) are the energies of the chirped pulse and optical parametric fluorescence with signal blocked at the second preamplifier, respectively.

Figure 3 Long description
The graph features two X-axes and two Y-axes. The bottom X-axis represents E sub P 1 forward slash m J ranging from 50 to 90. The top X-axis represents E sub P 2 forward slash m J ranging from 400 down to 360. The left Y-axis represents Output energy forward slash m J from 0 to 180. The right Y-axis is a logarithmic scale for Contrast ranging from 10 super 8 to 10 super 11.
Three data series are plotted:
* Contrast (black dotted line with asterisks): Starts at the top-left at approximately 10 super 11 and follows a steep exponential decay as E sub P 1 increases, leveling off near 10 super 8 at the far right.
* E sub S (red solid line with open circles): Represents chirped pulse energy. It shows a gradual, slightly concave-down increase from 135 m J at the left to approximately 165 m J at the right.
* E sub O P F (blue solid line with open squares): Represents optical parametric fluorescence. It remains low near 0 m J until E sub P 1 reaches 70, then exhibits a sharp exponential increase, reaching 100 m J at the far right.
Pulse contrast of the frontend measured by the Sequoia equipment for different pump energy allocation in two OPCPA preamplifiers. The noise is evaluated by the base line of the measurements since they are close to the limit of the Sequoia equipment. The sub-figure shows the detail in the 10 ps region.

Figure 4 Long description
A line graph plots Normalized intensity on a logarithmic Y-axis from 10 super -12 to 10 super 0 against Time forward slash p s on an X-axis from -500 to 200. A sharp central peak reaches 10 super 0 at time zero. Five data series are shown as jagged horizontal noise floors. From top to bottom, they correspond to the following pump energy pairs in m J: black at 80 and 370, blue at 68 and 382, red at 63 and 387, green at 57 and 393, and gold at 52 and 398. The noise floors descend vertically as the first pump energy decreases, ranging from approximately 10 super -9 for the black line to 10 super -12 for the gold line. An inset graph in the top-left quadrant focuses on the time range from -10 to 0 p s. In this region, the lines show a steep exponential rise toward the central peak. The black line maintains the highest noise floor throughout the inset, while the green and gold lines show the lowest baseline before rising sharply after -2.5 p s.
4 Investigation of the on-target pulse contrast
In the SG-II femtosecond petawatt laser system, the optimized output of an approximately 160 mJ signal pulse corresponds to the highest pulse contrast operation, and is injected into the subsequent master amplifier to boost the energy to approximately 45 J. The amplified pulse is then compressed and delivered to the target chamber for experiments. At the lithium triborate (LBO) crystal, the beam size is 55 mm × 55 mm, pumped by a 150 J, 2.0 ns harmonic pulse from the seventh beam of the SG-II nanosecond facility. The final beam is expanded to an aperture of 290 mm × 290 mm and focused by an off-axis parabola (OAP) with focal length of 800 mm. To minimize fluorescent noise, the LBO crystal thickness is optimized to 19 mm, achieving a maximum conversion efficiency of 41.9%[ Reference Zeng, Zhou, Zuo, Zhu, Su, Wang, Wang, Huang, Jiang, Jiang, Guo, Xie, Zhou, Wu, Mu, Peng and Jing 26 ]. Apart from higher-order dispersion and pump-induced fluorescence, two additional factors – spatial dispersion and surface roughness of large-aperture optical components – can degrade the final pulse contrast; these are discussed in detail herein.
4.1 Compensation of the spatial dispersion
The beam aperture of the entire laser system is expanded from initial 2.3 mm × 2.3 mm to 290 mm × 290 mm through multiple spatial filters, necessitating the use of large-aperture lenses with significant thickness along the beam path. Due to material dispersion, the propagation of broadband laser pulses through these optics induces an additional spatial chirp across the beam diameter, leading to a spatially varying pulse width. This phenomenon is known as propagation time delay (PTD). The PTD effect can be evaluated according to the following equation[ Reference Bor 42 ]:

where
${f}_i$
 and
${n}_i$
 represent the focal length and corresponding refractive index for each lens, while
${r}_i$
 describes the beam radius. According to Equation (3), PTD is proportional to
${r}_i$
 and inversely proportional to
${f}_i$
 ; thus, to change the value of PTD it is necessary to continuously adjust the beam radius or focal length of the large-size lens.
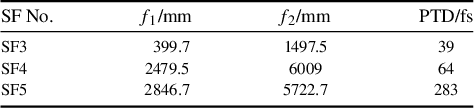
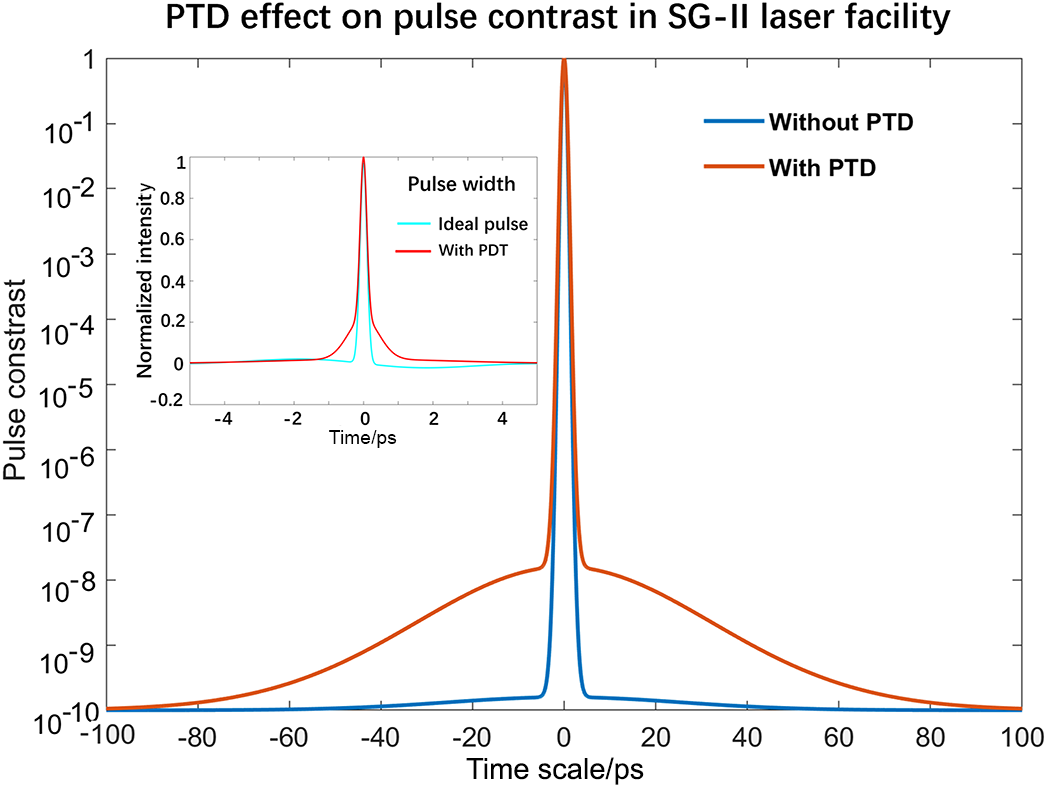
In the design of the SG-II femtosecond laser system, five spatial filters equipped with BK7 glass lenses are employed. Since PTD primarily arises in large optical elements, its effect was evaluated for the final three spatial filters, with the results summarized in Table 1. The cumulative maximum PTD reaches approximately 380 fs. Numerical simulations were performed to analyze the pulse width and contrast at the focal spot, as presented in Figure 5. When integrated over the focal spot, the PTD-induced broadening in pulse width is negligible – only a few femtoseconds – whereas the pulse contrast is degraded by two to three orders of magnitude, manifesting as a pedestal extending over approximately 100 ps before the main pulse peak.
PTD effect of the SG-II femtosecond PW laser system.

Table 1 Long description
The table consists of four columns and four rows including the header.
Column headers from left to right are: S F No., Lens-1 (mm), Lens-2 (mm), and P T D (fs).
Data rows are as follows:
* Row 1: S F 3, Lens-1 is 399.7, Lens-2 is 1497.5, P T D is 39.
* Row 2: S F 4, Lens-1 is 2479.5, Lens-2 is 6009, P T D is 64.
* Row 3: S F 5, Lens-1 is 2846.7, Lens-2 is 5722.7, P T D is 283.
PTD effect on pulse contrast in the SG-II femtosecond petawatt laser system. The effect on the integrated pulse width is negligible. However, a pulse contrast degradation of two to three orders of magnitude is observed beyond 100 ps relative to the main pulse peak. The sub-figure illustrates the influence of PTD on pulse width.

Figure 5 Long description
The main line graph plots Pulse contrast on a logarithmic Y-axis from 10 super minus 10 to 1 against Time scale in p s on a linear X-axis from minus 100 to 100. Two curves are shown. The blue curve, labeled Without P T D, shows a sharp central peak at 0 p s that drops rapidly to a baseline of 10 super minus 10 beyond plus or minus 10 p s. The orange curve, labeled With P T D, follows the same central peak but exhibits significant degradation, with the contrast level remaining higher at approximately 10 super minus 8 at plus or minus 20 p s and tapering slowly to 10 super minus 10 at the edges of the scale.
An inset graph in the top-left quadrant titled Pulse width plots Normalized intensity on the Y-axis from minus 0.2 to 1 against Time in p s from minus 5 to 5. It compares an Ideal pulse in cyan with a With P D T pulse in red. Both pulses show nearly identical narrow peaks centered at 0 p s, indicating the integrated pulse width remains largely unaffected by P T D.
To compensate for the pulse contrast degradation caused by the PTD, we developed a chromatic aberration pre-compensator with the configuration illustrated in Figure 6. Compared with using the traditional achromatic lenses, it has the following advantages:
-
(1) maintaining a better beam quality;
-
(2) larger capability of compensation for a single pass;
-
(3) capability of continuously turning the chromatic aberrations.
Layout of the chromatic aberration compensator in the SG-II fs laser system. L1, positive lens; L2 and L3, plane-concave lenses; M3, aspherical mirror; P1, quarter-wave plate; P2, half-wave plate; BS, beam splitter.

Figure 6 Long description
The diagram illustrates the laser beam path using a thick red line.
1. The beam enters from the top right, reflecting off mirror M 1 and passing through a B S beam splitter.
2. It reflects off mirror M 2, passes through a P 1 quarter-wave plate, and enters a horizontal Vacuum chamber.
3. Inside the chamber, the beam passes through a Pinhole and a positive lens L 1.
4. Exiting the chamber, the beam expands into a cone shape and passes through two plane-concave lenses, L 2 and L 3, which are mounted on a Translation stage.
5. The beam terminates at an aspherical mirror M 3 on the far left.
6. A secondary path branches from the B S beam splitter, reflecting off mirrors M 4 and M 5, passing through a P 2 half-wave plate, and reflecting off mirror M 6 toward the top left.
It comprises two concave lenses L2 and L3, each having a focal length of –391.5 mm and an aperture of 100 mm, a spherical mirror M3 (focal length –175 mm and aperture 200 mm), along with an achromatic quarter-wave plate, a half-wave plate and a beam splitter. This compensator was installed at the entrance of the third spatial filter (SF3) to correct chromatic aberrations across the entire system. The compensation is accomplished by precisely adjusting the separation between lenses L1 and L2. To preserve the real image relay, the relative distance between optical components must be adjusted precisely along the optical axis. By employing BK7 as the lens material, L2 has a diameter of 100 mm, larger than that of L1. The maximum PTD induced by L2 reaches 320 fs when the focal length is set to 800 mm, increasing to 1.4 ps at 200 mm. The PTD value near 380 fs is equivalent to the focal length of L2 of 760 mm. Through simulation, after the additional chirp is fully compressed by slightly adjusting the tiny compressor in the frontend, the pulse contrast at the focal spot is significantly improved, approaching the ideal Gaussian profile closely, with contrast exceeding
${10}^{12}$
 in the 100 ps region.
4.2 Spatial-temporal coupling of the surface roughness
The main optical parametric chirped pulse amplifier of the SG-II femtosecond PW laser system operates at a stable workpoint to minimize fluctuations, where fluorescence and other scattered light noise primarily arise from mismatches in the temporal width and spatial overlap between the pump pulse and the signal. As discussed, such mismatches lead to gain differences between the noise and signal, ultimately determining the level of uncompressible noise. Near the saturable region, the spectrum profile of the signal tends to conform to the temporal profile of the pump pulse. Assuming a super-Gaussian pulse as the pump, numerical calculations show that only super-Gaussian orders higher than 10 can achieve a picosecond-scale pulse contrast exceeding
${10}^8$
 . For the main optical parametric chirped pulse amplifier in the SG-II femtosecond PW laser system, the temporal profile of the pump has been specifically tailored into a flat-topped square shape to optimize performance.
In analyzing the pulse contrast on the focal spot, other crucial factors beyond the previously mentioned pump fluorescence during amplification must be considered. Due to the unavoidable use of large-size optical components in the terminal zone of the petawatt femtosecond laser, manufacturing roughness and wavefront distortions introduced by the nonuniform phase distribution across the entire beam aperture are expected to degrade pulse contrast through spatial-temporal coupling. For a credible evaluation, we assume the manufacturing capability of large-size optical elements as peak-to-valley values, PV =
$\lambda /10$
 , with a PV surface gradient of approximately
$\lambda /75$
 per millimeter. Assuming the original femtosecond laser pulse with a spatial distribution in amplitude, it be expressed as
$E\left(x,y,t\right)\cdot \exp \left(i{\omega}_0t\right)$
 . We then transfer the pulse into the frequency domain:

After propagating a distance z, which endures a wavefront distortion or surface roughness
$\exp \left( i\phi \left(x,y\right)\right)$
 , it is then transferred in the same way:

The laser pulse at z can be evaluated by the following:

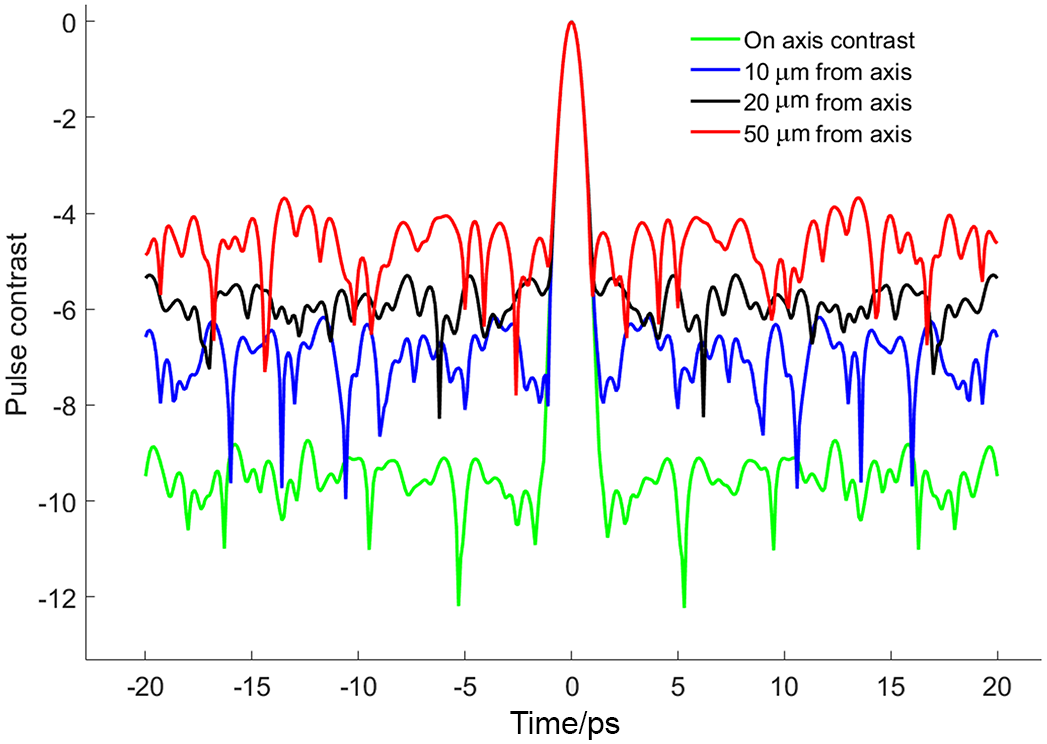
We then calculate the on-focus distribution using the traditional Franhoffer diffraction formula. We calculate the pulse contrast integrated over and distributed across the whole beam size of the focal spot with respect to the manufacturing errors. Without loss of generality, we assume the input pulse to be Gaussian, and the manufacturing errors and wavefront distortions are solely imposed on the OAP, with a simplified beam dimension of 290 mm × 290 mm. The distributed pulse contrasts as well as its integration over the whole beam size are respectively depicted in Figures 7 and 8. From Figure 7, it is evident that even at the ultimate manufacturing capability (PV = 0.1λ), the PV gradients – representing surface roughness of optical elements – can become a significant contributor to the degradation of the final pulse contrast. A surface with defects or laser-induced wavefront distortions equivalent to 0.2λ/mm leads to a deterioration of the pulse contrast to between
${10}^{-6}$
 and
${10}^{-10}$
 within several tens of picoseconds around the pulse peak.
Focused pulse contrast integrated over the beam aperture versus manufacturing errors at PV = 0.1λ and different PV gradients.

Figure 7 Long description
A line graph with the y-axis labeled S N Contrast ratio ranging from minus 14 to 0 and the x-axis labeled p s ranging from minus 20 to 25.
At the center of the x-axis (0 p s), all four data lines converge at a sharp peak reaching a value of 0. Moving away from the center in both positive and negative directions, the lines drop sharply and then transition into noisy horizontal bands.
The vertical distribution of these noisy bands corresponds to the P V gradient values listed in the top-right legend.
* The green line (P V equals 0.1 lambda, P V gradient equals 0.2 lambda forward slash mm) maintains the highest noise floor, fluctuating around minus 6.
* The dark blue line (P V gradient equals 0.034 lambda forward slash mm) sits below the green, fluctuating around minus 7.
* The magenta line (P V gradient equals 0.01 lambda forward slash mm) sits further down, fluctuating around minus 8.
* The light blue line (P V gradient equals 0.0046 lambda forward slash mm) has the lowest noise floor, fluctuating between minus 9 and minus 11.
Lower P V gradients result in a lower noise floor and higher contrast ratio away from the central pulse.
Pulse contrast distribution at the focal spot at PV = 0.1λ and PV gradient of 0.0046λ/mm. The green line represents the result on the optical axis, while blue, black and red are the results calculated at places that deviate 10, 20 and 50 μm from the optical axis.

Figure 8 Long description
A line graph with the horizontal axis labeled p s ranging from minus 20 to 20 and the vertical axis labeled Pulse contrast ranging from minus 12 to 0.
All four data series converge at a single sharp peak at 0 p s reaching a pulse contrast of 0. Outside of this central peak, the series fluctuate as noise at different vertical levels.
* The red line, representing 50 micrometers from axis, maintains the highest baseline noise level between minus 4 and minus 6.
* The black line, representing 20 micrometers from axis, fluctuates between minus 5 and minus 8.
* The blue line, representing 10 micrometers from axis, fluctuates between minus 6 and minus 10.
* The green line, representing On axis contrast, maintains the lowest baseline noise level between minus 9 and minus 12.
A legend in the top right corner identifies the four colored lines accordingly.
As shown in Figure 8, each curve represents the evolution of pulse contrast at a specific location on the focal plane. Compared to the integrated pulse contrast, these curves remain relatively constant as the temporal observation window widens. The highest pulse contrast, reaching approximately
${10}^{10}$
 , occurs on the optical axis, but decreases to nearly
${10}^5$
 at a radial distance of 50 μm off-axis. This indicates that, in practice, a small focal spot and high pulse contrast are inherently correlated in a petawatt-level femtosecond laser system. To maintain high pulse contrast, such a laser must sustain a focal spot approaching the diffraction limit.
4.3 Pulse contrast enhancement with a plasma mirror
Since there are many factors that can degrade the on-target pulse contrast, it is crucial to effectively clean the pulse edge before delivering it to the experiment. High-order dispersion control, spatial chromatic compensation and fluorescence minimization have proven effective in addressing these issues prior to laser focusing. However, spatial-temporal coupling induced by optical element roughness and wavefront distortions can only be corrected at the focal spot itself. A promising solution is the use of a PM positioned just before the target. In principle, a PM is an optical plate coated with a highly efficient antireflection film. When a femtosecond laser pulse impinges on it, the low-intensity leading edge transmits through the plate. As the pulse intensity increases and approaches its peak, the surface of the plate is ionized, generating a plasma whose electron density exceeds the critical threshold, resulting in strong reflection. This reflected pulse thus exhibits enhanced contrast. The reflectivity of a PM typically reaches a maximum of approximately 80%[
Reference Ziener, Foster, Divall, Hooker, Hutchinson, Langley and Smith
43
] for vertically polarized light at an intensity of
${10}^{16}$
 $\mathrm{W}/{\mathrm{cm}}^2$
 .
In the SG-II femtosecond petawatt laser system, a PM is implemented in the target chamber to enhance the on-target pulse contrast, as schematically illustrated in Figure 9. Figure 9(a) illustrates the experimental setup, where the PM is positioned between the OAP and the focal spot to ensure an incident light intensity of approximately
${10}^{16}$
 $\mathrm{W}/{\mathrm{cm}}^2$
 on the PM surface. Experiments of the target normal sheath acceleration (TNSA) of protons are performed to compare the pulse contrast before and after pulse cleaning. An X-ray pinhole camera is employed to monitor changes of the focal spot, while a radiochromic film (RCF) stack is used to measure the proton cutoff energy. To investigate the stimulated temporal characteristics, we employ a 160 mJ, 20 fs laser pulse from the frontend OPCPA preamplifier to initiate the PM, while simultaneously using an uncompressed, low-intensity chirped pulse to detect the start window in sync. Figure 9(b) illustrates the three distinct phases of chirped mirror startup captured by the spectrometer. Phase 1 represents the initial stage where noise preceding the pulse peak begins to ionize the PM surface. As laser intensity increases, the system transitions into Phase 2, characterized by the emergence of a higher reflectivity window. Finally, in Phase 3, the PM surface is completely damaged, leading to a significant decrease in reflectivity. As the rapid rise and fall of the spectrum reflectivity represent the start and stop of the PM ignited by a femtosecond laser pulse, only wavelengths that temporally overlap the duration of the PM (with higher reflectance) can be monitored by the spectrometer. Thus, the temporal reflectivity carries the PM property of the time. We can easily obtain the temporal window by equation
$\Delta t=C\cdot \left({\lambda}_2-{\lambda}_1\right)$
 , where C is the chirp rate and
${\lambda}_2$
 ,
${\lambda}_1$
 are the beginning and end spectra, respectively, recorded by the spectrometer. In our experiment, the spectral interval recorded near the wavelength of 818.5 nm is about 0.354 nm, and the chirp rate of the detecting pulse is approximately 25 ps/nm. Thus, the temporal window of the PM is about 8.85 ps. Figure 9(c) demonstrates the PM’s ability to enhance pulse contrast and maintain focal spot quality before and after its activation, as captured by the X-ray pinhole camera. The leading edge of the low-intensity, flat-topped laser pulse is suppressed by two orders of magnitude relative to the pulse peak. This indicates that the PM can improve the pulse contrast by up to two orders of magnitude with a single pass, while the pinhole camera images show minimal impact on focal spot variations.
Schematic of the plasma mirror experiment and results of the pulse contrast enhancement. (a) Setup of the experiment where PM is the plasma mirror, an X-ray pinhole camera is used for the focal spot monitoring and an RCF stack is used for proton detection in testing the result of pulse cleaning. (b) Gate window of the plasma mirror measured with a chirped laser pulse. (c) Capability of the plasma mirror to enhance the pulse contrast.

Figure 9 Long description
Panel a is a flowchart of a laser system. It begins at the top left with an f s laser source 750 to 900 n m at 85 M H Z, followed by a Stretcher. The beam passes through Multiple-stage O P C P A amplifiers and spatial filters, then into a Compressor with four blue rectangular blocks. The beam, now red, reflects off two mirrors into a vacuum chamber. Inside the chamber, the beam hits an O A P mirror, reflects to a P M, and then to a Target. Surrounding the target are an R C F Stack, Electron spectroscope, Questar, X-ray pinhole camera, and a Vacuum calorimeter. Panel b is a line graph with a logarithmic Y-axis for Intensity in arbitrary units and a dual X-axis for Time in p s from negative 2000 to 1500 and Wavelength in n m from 900 to 760. A sharp peak at 0 p s is labeled Phase 2. Two dashed red boxes indicate Phase 1 before the peak and Phase 3 after the peak. An inset graph shows Intensity versus Wavelength with a flat-topped peak between 780 and 850 n m. Panel c is a line graph showing Intensity in arbitrary units on a logarithmic Y-axis from 10 super minus 3 to 10 super 0, and Time in p s on the X-axis from negative 300 to 50. The data shows a noisy baseline around 10 super minus 2 until a sharp rise to a peak at 0 p s.
To assess the pulse contrast after the PM in the SG-II femtosecond petawatt laser system, we directly measured the cleaning performance of the 160 mJ, 30 fs pulse reflected from the PM. Focusing the beam to a spot size of several tens of micrometers readily achieves an intensity of
${10}^{16}$
 $\mathrm{W}/{\mathrm{cm}}^2$
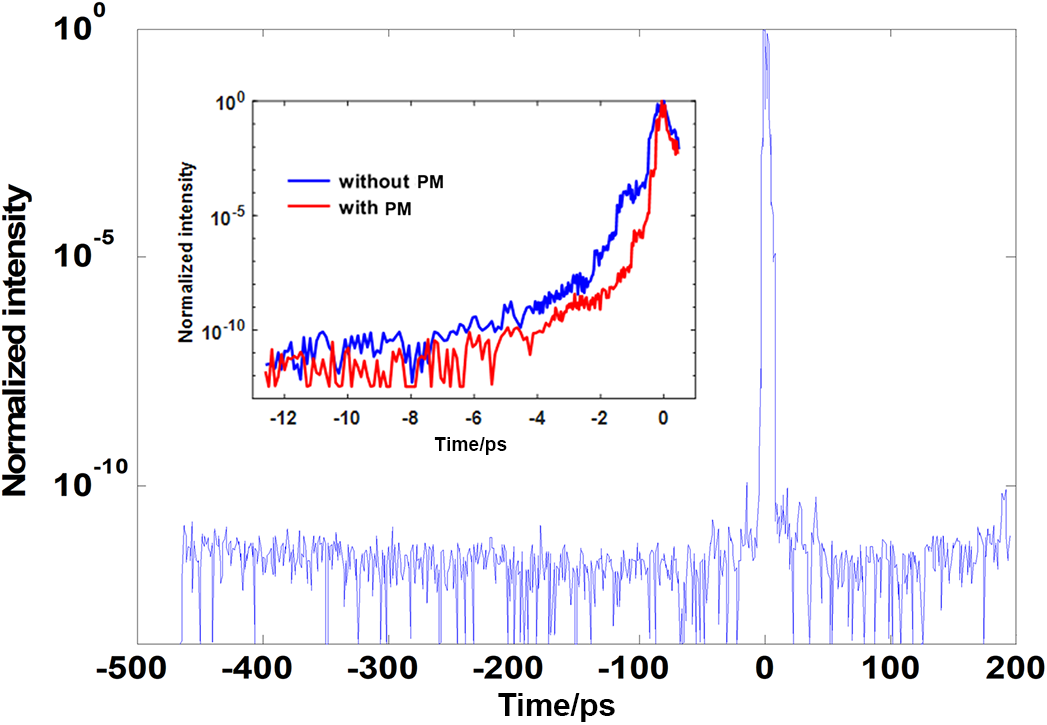
 . Figure 10 displays the pulse contrast measurement obtained when the laser system operates at full energy using a PM. A portion of the laser energy is split off and reflected toward the Sequoia equipment, showing that the pulse contrast reaches over
${10}^{11}$
 . Compared with previous value[
Reference Zhu, Xie, Sun, Kang, Yang, Guo, Zhu, Zhu, Gao, Liang, Cui, Yang, Zhang and Lin
25
] obtained without the PM, this represents nearly a four-order-of-magnitude improvement, exceeding the expectations. The Figure 10 inset depicts the pulse contrast measurements recorded within the temporal window of the PM prior to the main pulse peak. It is evident that the pulse contrast value achieved with the PM is two orders of magnitude higher than that obtained without it. The final four-order enhancement is primarily attributed to both the PM and difference in focal spot sizes: the prior measurement used a 20 μm diameter spot, whereas the current one is approximately 4 μm.
On-focus pulse contrast cleaned by the plasma mirror.

Figure 10 Long description
The main line graph plots Normalized intensity on a logarithmic Y axis from 10 super minus 10 to 10 super 0 against Time in p s on the X axis from minus 500 to 200. A sharp vertical peak occurs at 0 p s, reaching 10 super 0, while the baseline noise floor sits around 10 super minus 8.
An inset graph focuses on the temporal window from minus 12 to 0 p s. It contains two data series.
* The blue line labeled without P M shows a gradual exponential increase in intensity starting from 10 super minus 11 at minus 12 p s and rising to 10 super 0 at 0 p s.
* The red line labeled with P M shows a suppressed intensity compared to the blue line, maintaining a lower floor until approximately minus 2 p s, where it rises sharply to meet the blue line at 0 p s, indicating improved pulse contrast.
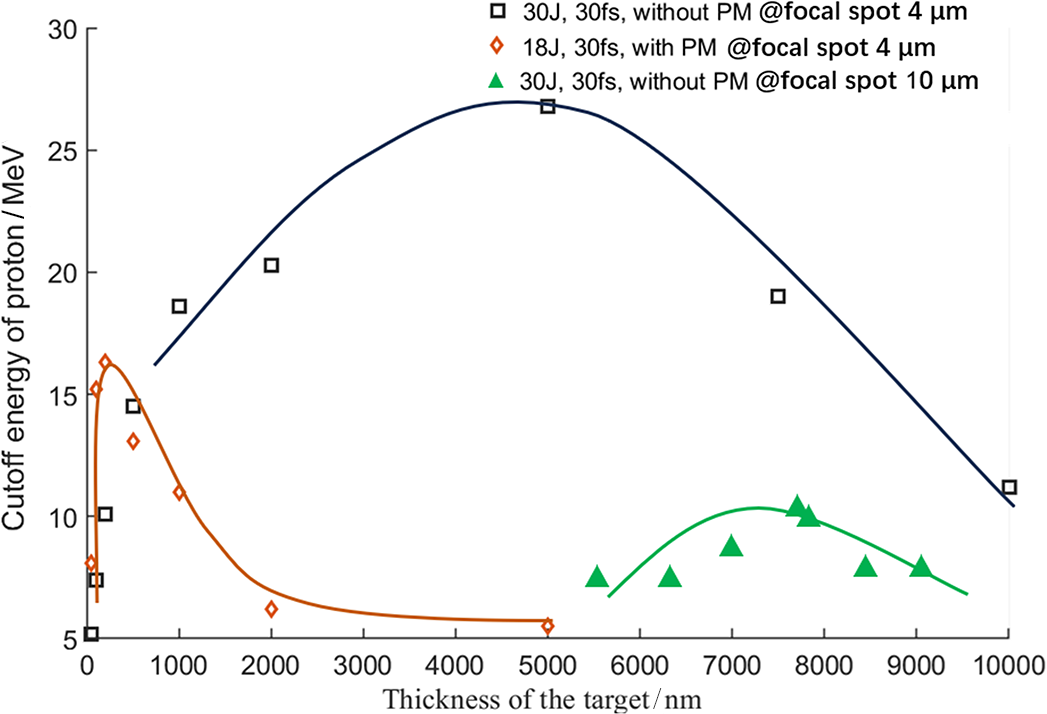
The SG-II femtosecond petawatt laser operates in single-shot mode, making it challenging to measure pulse contrast at high energy using a repetitive third-order autocorrelator. To obtain a comprehensive understanding of pulse contrast enhancement, TNSA proton acceleration experiments are conducted to compare the pulse contrast with and without the PM. Since the target thickness yielding the highest proton cutoff energy is highly sensitive to pulse contrast, it serves as an effective indicator for qualitatively assessing the improvement. Figure 11 displays the results of the TNSA proton acceleration experiments with the copper flat targets. For the same focal spot of 4 μm, the optimal target thickness for maximum cutoff energy is approximately 5 μm without the PM and reduces to about 200 nm when the PM is employed. This significant reduction clearly indicates a substantial improvement in pulse contrast.
Cutoff energy for proton acceleration in the SG-II femtosecond PW laser. The black squares are results for pulse energy of 30 J and width of 30 fs without a plasma mirror at focal spot 4 μm; the orange diamonds represent the results for 18 J, 30 fs with a plasma mirror at focal spot 4 μm; and the green triangles represent the results for 30 J, 30 fs at focal spot 10 μm.

Figure 11 Long description
The X-axis represents Thickness of the target in n m, ranging from 0 to 10000. The Y-axis represents Cutoff energy of proton in M e V, ranging from 5 to 30.
Three data series are plotted:
* Black squares (30 J, 30 f s, without P M at focal spot 4 mu m): This series follows a broad parabolic curve. It starts near 5 M e V at low thickness, peaks at approximately 27 M e V around 5000 n m, and descends to 11 M e V at 10000 n m.
* Orange diamonds (18 J, 30 f s, with P M at focal spot 4 mu m): This series shows a sharp peak at very low thickness. It reaches a maximum of approximately 16 M e V at roughly 250 n m before rapidly decaying and plateauing near 5 M e V for thicknesses beyond 2000 n m.
* Green triangles (30 J, 30 f s, without P M at focal spot 10 mu m): This series is concentrated in the higher thickness range from 5500 to 9500 n m. It forms a shallow curve peaking at approximately 10 M e V around 7500 n m.
Diagram of the adaptive optics for the SG-II femtosecond petawatt laser system. Two Hartmann wavefront sensors are used before and after the main pulse compressor. After the closed-loop correction, wavefront distortion is decreased from PV = 9.588λ, RMS = 1.65λ to PV = 0.655λ, RMS = 0.111λ.

Figure 12 Long description
The image is divided into six sections.
1. Top Right: A schematic flowchart of the laser system. It begins with an Oscillator and Lenses connected to a Stretcher and Dispersion regulator. The beam passes through three O P C P A stages (I, II, and III) containing B B O crystals and S F spatial filters. The beam enters a Grating Compressor and then an Adaptive Optics loop. This loop includes a Deformable Mirror and two Hartmann sensors, H S 1 and H S 2. The final beam is directed via an Off-axis Parabolic Mirror and Collimator into a Target Chamber.
2. Top Left: A 3D surface plot titled P V equals 9.588 lambda, R M S equals 1.663 lambda. It shows a highly distorted wavefront with a deep blue valley and high red peaks. The x and y axes represent space in millimeters from 0 to 290, and the z-axis represents wavefront error all over lambda from minus 5 to 5.
3. Bottom Left: A 3D surface plot titled Wavefront of A O Close loop by H S 2. The values are P V equals 0.898 lambda and R M S equals 0.132 lambda. The surface is significantly flatter than the first plot, showing minor yellow and blue fluctuations.
4. Bottom Center: A 3D surface plot titled Wavefront of A O Close loop by H S 1. The values are P V equals 0.665 lambda and R M S equals 0.111 lambda. This plot shows the most uniform surface with minimal deviation across the 290 by 290 millimeter area.
5. Bottom Right: Three photographs showing the physical hardware. The top photo shows the Deformable Mirror with a grid of actuator points. The two lower photos show the Hartmann Sensor units in a laboratory setting.
5 Focusing the laser to the diffraction limit
A small focal spot in femtosecond petawatt lasers is crucial not only for achieving peak laser intensity but also for preserving high on-target pulse contrast. In the SG-II femtosecond petawatt laser system, following the pulse compressor, an off-axis parabolic mirror with a focal length of 800 mm focuses the 290 mm × 290 mm laser beam onto the target. Theoretically, for a laser wavelength of 800 nm and an OAP f-number of 1.95, the diffraction limit spot size is approximately 4 μm. To achieve the smallest possible focus, the system incorporates adaptive optics: two Hartmann wavefront sensors – positioned before and after the main compressor – along with a deformable mirror placed near the first Hartmann wavefront sensor, and a chromatic compensator integrated into the amplification chain. These components work together to correct wavefront distortions and counteract material dispersion, thereby minimizing focal spot enlargement.
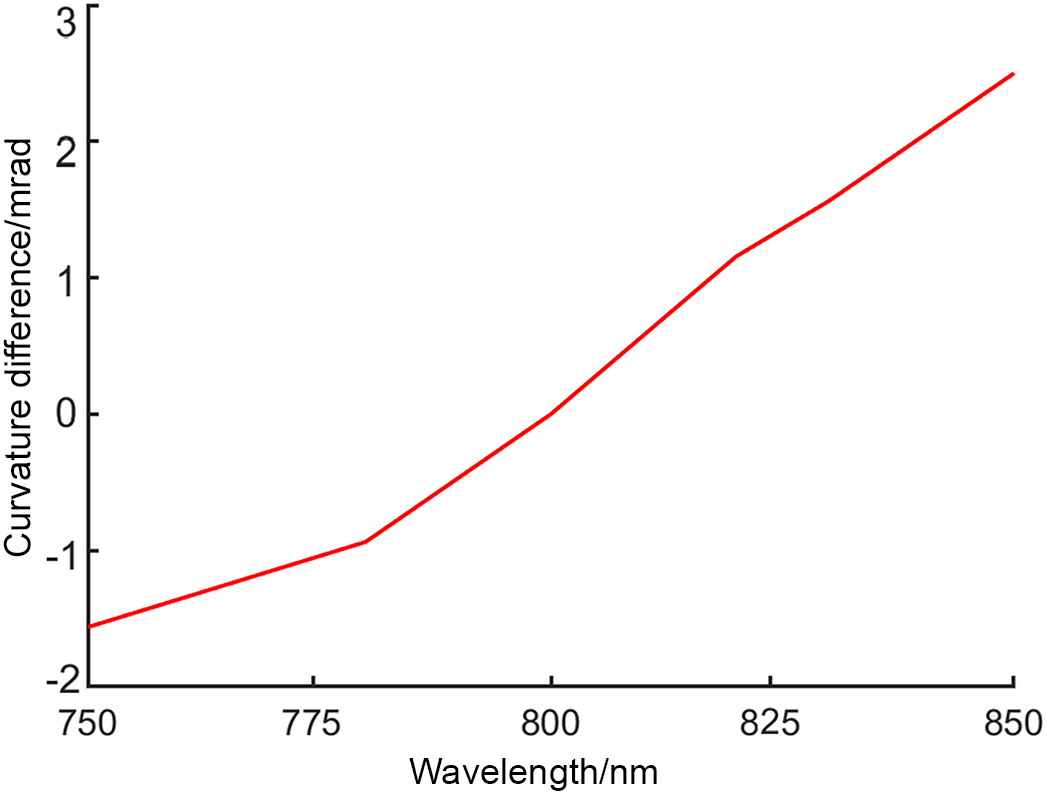
Curvature difference calculated for the SG-II femtosecond petawatt laser.

Figure 13 Long description
The line graph plots wavelength in n m on the x-axis against curvature difference in m Rad on the y-axis. The x-axis ranges from 750 to 850 with major tick marks every 25 units. The y-axis ranges from minus 2 to 3 with major tick marks every 1 unit. A single red line represents the data. Starting at 750 n m, the curvature difference is approximately minus 1.6 m Rad. The line shows a steady linear increase to approximately minus 0.9 m Rad at 780 n m. From 780 n m, the slope steepens, crossing the zero point at 800 n m. The upward trend continues linearly, reaching approximately 1.2 m Rad at 820 n m and ending at approximately 2.6 m Rad at 850 n m.
Focal spot improvement by the spatial compensator. (a), (b) Focal spot images taken by a CCD camera; the pixel size of the CCD camera is 4 μm each. (c), (d) Calculated intensity distribution along the horizontal direction. After the compensation, the focal spot diameter decreases from nearly 20 to 4 μm.

Figure 14 Long description
The multi-panel display consists of two C C D camera heatmaps on the left and two corresponding line graphs on the right.
* Panel a (top-left): A heatmap on a 60 by 60 pixel grid. It shows a broad, irregular yellow-green intensity region centered around pixel coordinates (35, 32), surrounded by a large blue halo indicating a wide focal spot.
* Panel b (bottom-left): A heatmap on the same grid scale after compensation. The intensity is now concentrated into a tiny, sharp yellow dot at the center, with almost no surrounding halo.
* Panel c (top-right): A line graph plotting Intensity in a.u. on the y-axis from 0 to 1 against Number of pixel (4.4 mu m per pixel) on the x-axis from -10 to 10. Two curves, Vertical (solid red line with circles) and Horizontal (dashed blue line with stars), show broad peaks. The Vertical curve has a wide base spanning from -10 to 10, while the Horizontal curve shows a jagged peak with significant width between -5 and 5.
* Panel d (bottom-right): A line graph with the same axes as panel c. Both the Vertical and Horizontal curves now show extremely sharp, narrow peaks centered at 0. The intensity drops to near zero within 2 pixels of the center, demonstrating the focal spot diameter decrease to 4 mu m.
5.1 Adaptive optics and wavefront corrections
The adaptive optics system is employed to correct both static and dynamic wavefront aberrations in the SG-II femtosecond petawatt laser, as illustrated in Figure 12. The deformable mirror has a clear aperture of 320 mm
$\times$
 320 mm and consists of 77 piezoelectric ceramic transducer (PZT) actuators. The Hartmann sensor employs a narrowband filter centered at 808 nm with a 3 nm bandwidth to restrict the laser spectrum to a narrow range, enabling accurate measurement of wavefront distortions. The first and second Hartmann wavefront sensors share the same deformable mirror, forming two closed-loop systems for automated wavefront correction. After the first closed loop, wavefront distortion at the entrance of the main compressor is decreased from PV = 9.588
$\lambda$
 , RMS = 1.65
$\lambda$
 to PV = 0.655
$\lambda$
 , RMS = 0.111
$\lambda$
 . After the second closed loop, wavefront distortion on the OAP is corrected to PV = 0.898
$\lambda$
 , RMS = 0.132
$\lambda$
 . The focal spot is significantly improved, reducing from a diameter of 20 μm (FWHM) without correction to approximately 10 μm with correction. TNSA proton acceleration experiments confirm this enhancement, achieving a maximum cutoff energy of 10 MeV (Figure 11 in green), indicating that the on-target intensity reaches
$(1-5)\times {10}^{19}$
 $\mathrm{W}/\mathrm{cm}^{2}$
 .
5.2 Chromatic compensation to diffraction limit focus
Due to the dispersion inherent in optical materials, large-size optical components such as spatial filter lenses exhibit wavelength-dependent focal lengths. As broadband laser light propagates through these lenses, it acquires varying wavefront curvatures across different wavelengths, resulting in distinct spot diameters at the focal plane of the off-axis parabolic mirror. This leads to significant energy decentralization. Such chromatic effects cannot be corrected by conventional adaptive optics, which are typically designed for a single central wavelength. We analyze the variation in focal length across different wavelengths by calculating the cumulative effect of PTD on the wavefront curvature for all spatial filter lenses. Using the parameters listed in Table 1 and assuming the spatial filters are set for a central wavelength of 800 nm, we compute the curvature differences in radians. As shown in Figure 13, when using a parabolic mirror with an f-number of 1.95, the curvature difference between 830 and 780 nm reads approximately 2.1 mrad, equivalent to approximately 4.0 mm (
$1.95\times 2.1$
 ) difference in focal length.
However, a chromatic aberration pre-compensator has been implemented (see Figure 6), effectively compensating not only for the pulse temporal dispersion (PTD) to improve pulse contrast but also for wavelength-dependent focal length variations. The focal length differences were calculated using the designed compensator parameters, revealing that the wavelength-dependent focal variations in the SG-II femtosecond petawatt laser system can be fully compensated. Specifically, the focal length discrepancy between 830 and 780 nm is reduced from 4.0 mm to nearly zero.
Measurements of the focal spot improvement were systematically conducted within the target chamber, where the spatial intensity distribution of the focused laser beam was captured using a 16-bit, 2048
$\times$
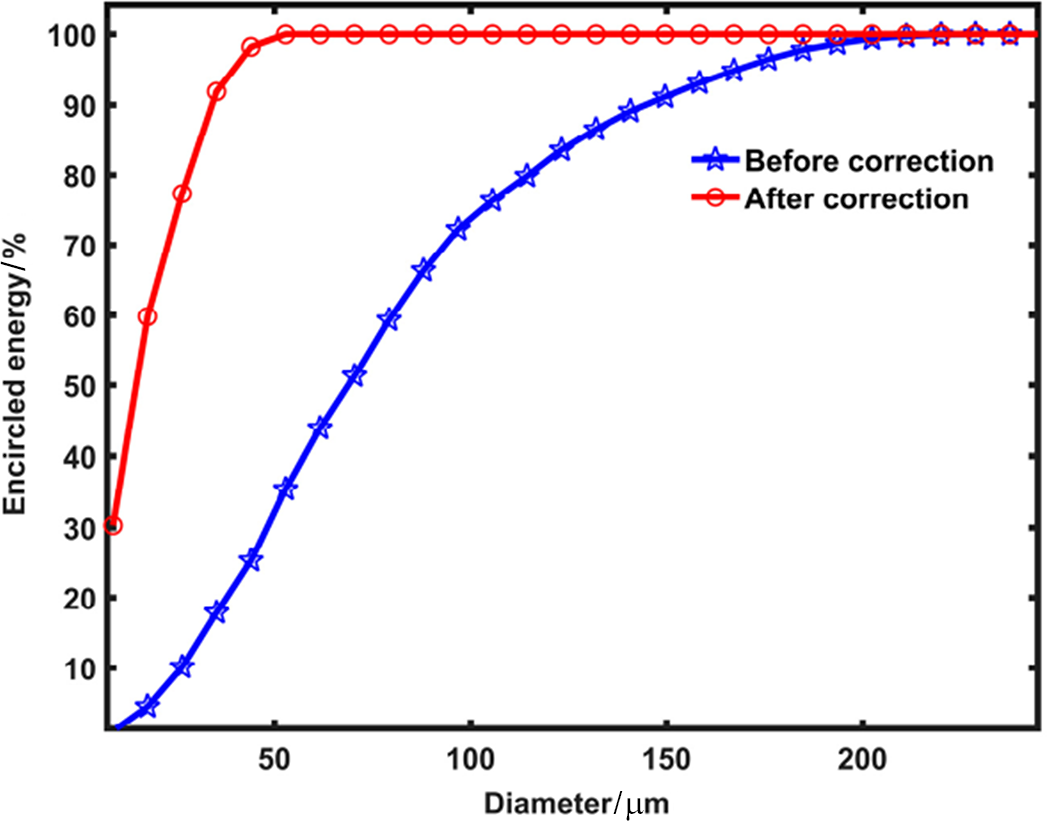
 2048-element scientific charge-coupled device (CCD) camera (SP620U Spiricon). With a pixel size of approximately 4 μm, the system successfully resolved the light spot at the single diffraction limit when focused by an f-number 2 off-axis parabolic mirror, allowing for accurate characterization of the focal profile before and after wavefront compensation. The experimental results are illustrated in Figures 14 and 15, which provide a direct comparison of the laser focus quality under compensated and uncompensated conditions. As clearly shown in Figure 14, following the application of the chromatic aberration pre-compensator, the focal spot diameter is dramatically reduced from an initial value of nearly 20 μm to less than 4 μm, representing a more than fivefold improvement in spatial confinement, approaching the theoretical diffraction limit, indicating highly effective correction of wavelength-dependent phase distortions. Concurrently, Figure 15, presents the radial energy encirclement data, demonstrating that the enclosed energy within a 4 μm diameter aperture increases significantly from approximately 20% to over 65%. This substantial enhancement in energy concentration confirms the success of the compensator in aligning multiple wavelength components to a common focal plane, thereby maximizing peak intensity. To further validate the practical impact of this improved focusing, a test experiment was performed using the TNSA mechanism for laser-driven proton acceleration. The results reveal a clear increase in the maximum cutoff energy of the generated proton beam, which is increased to 26 MeV (Figure 11 in black) – indicative of a stronger accelerating electric field at the target surface. This corresponds to an estimated on-target laser intensity of up to
$2\times {10}^{20}$
 $\mathrm{W}/\mathrm{cm}^{2}$
 , a critical threshold for enabling efficient particle acceleration and other high-field physics experiments. These findings not only confirm the technical effectiveness of the chromatic compensation scheme but also highlight its essential role in achieving high-contrast, high-intensity laser–matter interactions in broadband petawatt laser systems such as the SG-II facility.
The energy concentration improved by the spatial compensator. Enclosed energy within 4 μm diameter is increased from approximately 20% to more than 65%.

Figure 15 Long description
The X axis is labeled Diameter in mu m with a scale from 0 to 250. The Y axis is labeled Encircled energy percent with a scale from 0 to 100. Two data series are plotted.
* The Before correction curve is blue with star markers. It shows a gradual logarithmic increase, starting near 0 at the origin, passing through 50 percent energy at approximately 70 mu m, and reaching nearly 100 percent energy at 250 mu m.
* The After correction curve is red with circle markers. It shows a much steeper, rapid increase, starting at approximately 30 percent energy at the origin and reaching a plateau of 100 percent energy at approximately 50 mu m.
The comparison shows that the spatial compensator significantly concentrates energy into a smaller diameter.
6 Conclusion
In this paper, we present our work on pulse contrast enhancement and wavefront compensation for the SG-II femtosecond petawatt laser system. Through careful control of pump-induced fluorescence in the OPCPA preamplifier, a high-contrast frontend has been successfully achieved. With the aid of a PM, noise arising from spatiotemporal coupling due to optical surface roughness and wavefront distortion is effectively suppressed. The final pulse contrast reaches over
${10}^{11}$
 . For focal spot optimization, adaptive optics combined with a chromatic aberration pre-compensator are employed, enabling the femtosecond petawatt laser to be tightly focused into a near-diffraction-limited spot of 4 μm, with enclosed pulse energy nearly three times that of the previous record. This work is of significant importance for the future operation of the SG-II femtosecond petawatt laser system.
Acknowledgements
The authors gratefully acknowledge the contributions of the SG-II femtosecond petawatt laser facility team for their support in system operation and assistance with parameter diagnostics. The work was funded by the National Key R&D Program of China (Grant No. 2025YFF0515000), the National Natural Science Foundation of China (NSFC) (Grant Nos. 62575295 and 12574368), the Science and Technology Commission of Shanghai Municipality (Grant No. 25692112900) and the Chinese Academy of Sciences (Grant No. XDA25020105).









 Open access

