Implications
Modelling nutrient use by ruminants in relation to feed intake and composition implies modelling nutrient exchanges between tissues and organs. The liver has two afferent blood flows and one efferent blood flow. This work provides empirical response relationships that allow the prediction of hepatic portal, arterial and venous blood flows in relation to changes in feed intake in sheep. These relationships can be integrated into models to predict the amount and nature of nutrients available to peripheral tissues, thereby forming a basis for the possible revision of feeding systems for ruminants.
Introduction
Feeding systems developed for ruminants are designed to adjust feed allowances to fit the production potential of the animals. New developments in ruminant nutrition are directing feeding systems towards nutrient-based systems (Reynolds, Reference Reynolds2000). In these systems, diets are described by the amount and nature of the nutrients absorbed by the portal-drained viscera (Loncke et al., Reference Loncke, Ortigues-Marty, Vernet, Lapierre, Sauvant and Nozière2009), and subsequent prediction models of the fate of nutrients have to consider the liver, which is a key organ in the metabolic coordination of tissues for the utilisation of nutrients. The liver filters most absorbed nutrients, transforms them and releases them into peripheral tissues. In this context, in-vivo studies on hepatic metabolism have been developed based on arteriovenous methods. The liver has two afferent blood vessels (the portal vein and the hepatic artery) and one efferent blood vessel (the hepatic vein). Hepatic venous blood flow and the respective contribution of the two afferent vessels to hepatic venous blood flow have a major quantitative impact on the calculated and (or) predicted net fluxes (Barnes et al., Reference Barnes, Comline and Dobson1986). Also, it is essential to quantify changes in hepatic blood flow when comparing different dietary conditions. Inconsistent findings have been published on the influence of intake on portal venous and hepatic arterial flows relative to hepatic venous blood flows. The contribution of hepatic arterial to hepatic venous (hepatic arterial/venous) blood flow, as calculated from portal and hepatic venous blood flow data reported in the literature, has shown varied response to increased metabolisable energy intake (MEI). When MEI was increased, the hepatic arterial/venous blood flow decreased numerically (Katz and Bergman, Reference Katz and Bergman1969; Bergman and Wolff, Reference Bergman and Wolff1971; Heitman et al., Reference Heitman, Sensenig, Reynolds, Fernandez and Dawes1986), remained unchanged (Freetly et al., Reference Freetly, Ferrell, Jenkins and Goetsch1995) or increased numerically (Burrin et al., Reference Burrin, Ferrell, Eisemann and Britton1991), depending on the study.
Currently available experimental techniques do not allow the same precision when measuring blood flows through different vessels. A commonly used technique to measure hepatic blood flows relies on the dilution of the marker p-aminohippuric acid (PAH). This technique allows the measurement of the portal and hepatic venous blood flows, while the hepatic arterial blood flow (HABF) is calculated by difference and is associated with errors that are cumulative (coefficients of variation associated with calculated values can be as high as 76%; Isserty et al., Reference Isserty, Ortigues and Remond1998). Lack of precision in the dilution technique in addition to differences in the laboratory analysis of PAH may explain the inconsistent findings obtained.
Meta-analyses are used to carry out quantitative literature reviews (Sauvant et al., Reference Sauvant, Schmidely and Daudin2005; Vernet et al., Reference Vernet, Lapierre, Nozière, Léger, Sauvant and Ortigues-Marty2005a). The statistical method of meta-analysis can be applied when a significant number of publications are available in the relevant field. The iterative processing used allows more robust conclusions to be drawn than those derived from a single experimental study or a qualitative literature review. Also, the within-paper incremental responses found can be clearly separated from any between-paper differences.
As a first step towards the empirical modelling of the net hepatic nutrient release following dietary changes, we set out to explore all the available published information to establish prediction equations for the hepatic blood flows following changes in the level of intake at constant diet composition in sheep. Within studies, only intake varied, while the chemical composition of the diets was constant. The method used was mainly within-study meta-analysis. To avoid possible bias, it was important to consider the possible between-study influence of variables of the diet composition on the relationships of hepatic blood flows as a function of intake.
The study was limited to sheep. Preliminary results have already been presented (Vernet et al., Reference Vernet, Nozière, Sauvant, Léger and Ortigues-Marty2005b).
Material and methods
For the present study, the FLORA (FLuxes across Organs and tissues in Ruminant Animals) database of bibliographical results obtained by arteriovenous methods in ruminants was used. It contains all the published results on blood flows and fluxes of nutrients through the splanchnic tissues, together with feeding conditions and the associated experimental designs (Vernet and Ortigues-Marty, Reference Vernet and Ortigues-Marty2006).
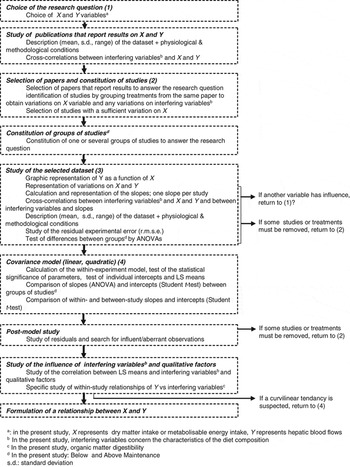
Meta-analyses were carried out using a within-study approach as described by Sauvant et al. (Reference Sauvant, Schmidely and Daudin2005) and Vernet et al. (Reference Vernet, Lapierre, Nozière, Léger, Sauvant and Ortigues-Marty2005a). This analysis is based on separating the within-study variations observed (related to experimental treatments), from the between-study variation observed (linked to experimental factors such as differences in analytical techniques or different personnel involved in experimentation; Sauvant et al., Reference Sauvant, Schmidely and Daudin2005). Minitab (2003) software was used for the graphic layouts and to perform meta-analyses. SAS (GLM procedure; 1999–2000) was used to test for differences between slopes. The main steps in the methodology used for meta-analyses are summarised in Figure 1.
Methodology used for the meta-analysis.

Selection of papers and identification of studies
First, all papers that presented results on hepatic blood flows in sheep were selected from FLORA. All the relevant information was not necessarily reported in the selected papers. If the chemical composition and nutritional value of feeds was missing from the paper it was estimated from feeding tables (NAS, 1969; INRA, 1988). When not reported in the papers, the values of HABF were calculated by difference between hepatic and portal venous blood flows. Intake and blood flow were expressed as a function of body weight (BW1.0), to allow the comparison of results between cattle and sheep (Vernet et al., Reference Vernet, Lapierre, Nozière, Léger, Sauvant and Ortigues-Marty2005a; Bermingham et al., Reference Bermingham, Nozière, Vernet, Lapierre, Léger, Sauvant and Ortigues-Marty2008).
All available data (animals, experimental treatments, diets) from the dataset were described in terms of frequencies, averages, standard deviation (s.d.), ranges and correlations between variables of intake, diet composition and blood flows. Subsequently, studies for the meta-analysis were defined by grouping the within-paper treatments that changed with intake only (determined as dry matter intake, DMI or MEI; Vernet et al., Reference Vernet, Lapierre, Nozière, Léger, Sauvant and Ortigues-Marty2005a). To calculate a reliable within-study response a minimum variation of the s.d. of DMI was set at 4 g/kg BW per day for DMI and 20 kJ/kg BW per day for MEI (Sauvant et al., Reference Sauvant, Schmidely and Daudin2005). This variation represented 20% of the average value in the pre-selected dataset.
Constitution of groups for level of intake
On the basis of preliminary results suggesting that responses differed between below- and above-maintenance fed animals (Vernet et al., Reference Vernet, Nozière, Sauvant, Léger and Ortigues-Marty2005b), studies were split into two groups. The first group (Below Maintenance) comprised the studies for which the average level of intake was below maintenance level, with the maintenance metabolisable energy (ME) requirements set at 150 kJ MEI/kg BW per day at the average BW of 50 kg (INRA, 1988). The second group (Above Maintenance) comprised the studies for which the average level of intake was above maintenance level. Finally, a combined group (Below + Above Maintenance) was constituted by pooling Below Maintenance and Above Maintenance studies.
Study of the selected dataset
Graphical representation of the within-study relationships between independent and dependent variables, of the slopes of the within-study relationships and the correlations between individual slopes and interfering variables (characteristics of diet composition such as ME, crude fibre (CF) and total nitrogen concentration, proportion of concentrate in the diet, organic matter digestibility (OMD)) was used in an initial investigation to search for hypothetical links with specific experimental conditions, interfering variables and qualitative factors.
Representativeness of data and risk of possible bias were evaluated by calculating all possible cross-correlations between all the characteristics of diet composition and intake (DMI or MEI).
The quantitative variables (intake, diet composition and blood flows) were described in terms of average, s.d. and range. The qualitative variables (physiological stage of the animals and methodological conditions of blood flow measurement) were described in terms of frequencies.
A more specific study of the experimental residual mean square error (r.m.s.e.) on hepatic blood flows was then conducted. The factors of variation studied were physiological stage, method of PAH determination, research group, number of animals and experimental design. The study was carried out by factorial ANOVA.
Finally, all the differences between Below Maintenance and Above Maintenance groups were tested by one-way ANOVAs.
Covariance model
The statistical models used to study the within-study relationships were all covariance models. First, linear models (Y = α + αi + β 1X + ε) were tested on Below Maintenance and Above Maintenance. Second, quadratic models (Y = α + αi + β 1X + β 2X 2 + ε) were tested on Below + Above Maintenance. In these models, α, αi, β 1, β 2 and ε were the general intercept, the effect of study i on α, the general linear slope, the general quadratic slope and the error term. When β 1 was not significant, the β 1X term was removed from the model. Because of the presence of only two treatments in all the identified studies, the βi term, representing the slope of study i, could not be added to the models.
All the parameters of the models were tested for their difference from zero using the Student t-test. Differences between general slopes in Below Maintenance, Above Maintenance and Below + Above Maintenance were tested by variance–covariance analysis using the model Y = α + level of intake + βX + αi (level of intake) + X × level of intake + ε in which α was the general intercept, β the general slope, αi (level of intake) the individual intercept, X × level of intake the interaction and ε the error term. Differences of intercepts and least square (LS) means (i.e. the means of the different studies estimated by the model at the average X) were determined by the Student t-test. The accuracy of relationships obtained with DMI and MEI was assessed using the r.m.s.e.
For possible generalisation of the within-study relationships, it was important to know whether the study had a significant influence on the within-study relationships. For this purpose, in Below + Above Maintenance, quadratic between-study relationships were calculated for portal, hepatic venous and arterial blood flows using the model: Y = α + β 1X + β 2X 2 + ε. The within- and between-study slopes and intercepts were then compared by the Student t-test.
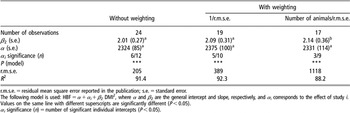
To try to improve the models, two weighting factors based on r.m.s.e. (1/r.m.s.e. and number of animals/r.m.s.e.) were tested using the quadratic covariance model of hepatic blood flows v. intake in Below + Above Maintenance. Apart from results obtained with weighting factors (Table 4), other results reported in tables and figures did not include any weighting factor.
Post-model study
The post-model study focused on the residuals and outlying observations by examining the normality of the residuals, Studentised residuals, leverage, Cook’s distances and Dfits (Howell, Reference Howell1998). When outliers were detected, the possible experimental reasons for their presence were sought in the paper and their influence on the parameters of the equations was tested by the Student t-test.
Finally, the different models obtained were compared graphically and using the probabilities, r.m.s.e. and R 2.
To test whether relationships were influenced by interfering variables and qualitative factors and to explain any differences in intercepts, LS means and slopes, two approaches were taken. First, we calculated correlations between individual slopes, LS means and intercepts on the one hand, and characteristics of diet composition on the other. Second, ANOVA analyses were carried out to identify the possible influence of the qualitative factors (physiological state, methods of measurement of blood flows and methods of PAH determination) on within-study LS means and slopes. Finally, to evaluate the error of models, in Below + Above Maintenance, the errors of prediction of the models were compared with the experimental r.m.s.e.
Results
The level of intake was initially determined using DMI and MEI variables. Because a prerequisite was that the within-study chemical composition of the diet was constant or near constant, the results obtained with DMI and MEI were very similar. Consequently, the results reported concerned mainly DMI, except when conclusions differed, for example for the correlations with variables of the diet composition and r.m.s.e. of the relationships obtained.
Description of the selected dataset, selection of publications and identification of studies
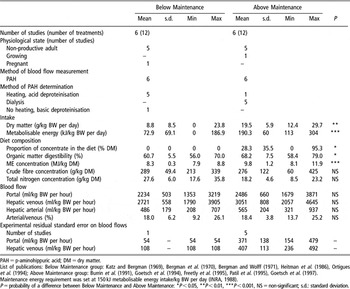
FLORA included 60 papers on sheep dating from 1965 to 2005. Among them, 30 papers reported hepatic blood flows, 10 of which had sufficient variations on DMI (s.d. ⩾4 g/kg BW per day) in the absence of variation in diet composition. In the identification of experiments, the papers of Goetsch et al. (Reference Goetsch, Ferrel and Freetly1994) and Katz and Bergman (Reference Katz and Bergman1969) were divided into two studies to optimise the variations on DMI and allow a constant chemical composition and a constant physiological stage within each study. Overall, 12 studies were kept, of which six were for Below Maintenance and six for Above Maintenance analyses (Table 1, Appendix). Animals were either fasted for 3 days (Katz and Bergman, Reference Katz and Bergman1969; Bergman et al., Reference Bergman, Katz and Kaufman1970; Bergman and Wolff, Reference Bergman and Wolff1971; Heitman et al., Reference Heitman, Sensenig, Reynolds, Fernandez and Dawes1986) or fed at 0.5 or 1 times maintenance (Ortigues et al., Reference Ortigues, Visseiche and Durand1994). In both groups, 83% of the animals were non-producing adults.
Description of the selected dataset used for the study of the relationships of hepatic blood flows to changes in intake in sheep

PAH = p-aminohippuric acid; DM = dry matter.
List of publications: Below Maintenance group: Katz and Bergman (Reference Katz and Bergman1969), Bergman et al. (Reference Bergman, Katz and Kaufman1970), Bergman and Wolff (Reference Bergman and Wolff1971), Heitman et al. (Reference Heitman, Sensenig, Reynolds, Fernandez and Dawes1986), Ortigues et al. (Reference Ortigues, Visseiche and Durand1994); Above Maintenance group: Burrin et al. (Reference Burrin, Ferrell, Eisemann and Britton1991), Goetsch et al. (1994), Freetly et al. (Reference Freetly, Ferrell, Jenkins and Goetsch1995), Patil et al. (Reference Patil, Goetsch, Park, Koualou, Galloway, West and Johnson1995), Goetsch et al. (Reference Goetsch, Patil, Galloway, Wang, Kouakou, Park and Rossi1997).
Maintenance energy requirement was set at 150 kJ metabolisable energy intake/kg BW per day (INRA, 1988).
P = probability of a difference between Below Maintenance and Above Maintenance: *P < 0.05, **P < 0.01, ***P < 0.001, NS = non-significant; s.d.: standard deviation.
Diets differed between groups (Table 1). For Below Maintenance, diets were composed of forage only, with MEI averaging 0.5 and ranging from 0 to 1.2 times the maintenance MEI requirements. For Above Maintenance, diets were composed of forage (40% of the data) or forage + concentrate (60% of the data) and animals were fed at 1.3 (range from 0.75 to 2.5) times the maintenance MEI requirements. The average proportion of concentrate, OMD and concentration of ME in Above Maintenance were significantly higher than that in Below Maintenance (P < 0.05). Despite those differences, the average CF and total N concentration were not significantly different among groups. DMI was not correlated with diet composition, except negatively with total N concentration (r = −0.465, P < 0.05). MEI was positively correlated with the proportion of concentrate in the diet (r = 0.545, P < 0.01), OMD (r = 0.440, P < 0.05) and dietary ME concentration (r = 0.573, P < 0.01) and was negatively correlated to dietary total N concentration (r = −0.444, P < 0.05).
All measurements of blood flows were based on the dilution of PAH, but the method of determination of PAH differed between groups (Table 1). A preliminary deacetylation step (heating) with acid deproteinisation was mostly used in Below Maintenance, while dialysis was mostly applied in Above Maintenance.
The average blood flows in the portal vein, hepatic vein and artery were not significantly different between groups (Table 1). Also, the hepatic arterial/venous blood flow was not significantly different between groups, and averaged 18.2%.
The range of r.m.s.e. was extremely wide. For portal blood flow (PBF), r.m.s.e. ranged from 54 to 479 ml/kg BW per hour. For hepatic venous blood flow, it ranged from 108 to 492 ml/kg BW per hour. The number of animals had a significant effect on r.m.s.e. (P < 0.05). The research group and the level of intake only tended to influence r.m.s.e. (P < 0.10). The physiological stage of the animals and the method of PAH determination did not significantly affect r.m.s.e.
Changes in hepatic blood flows with Below Maintenance intake
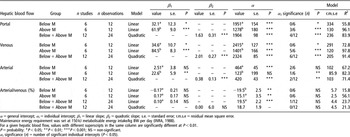
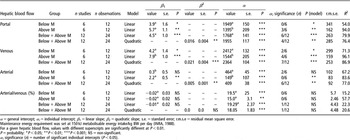
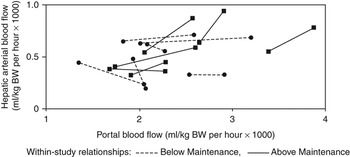
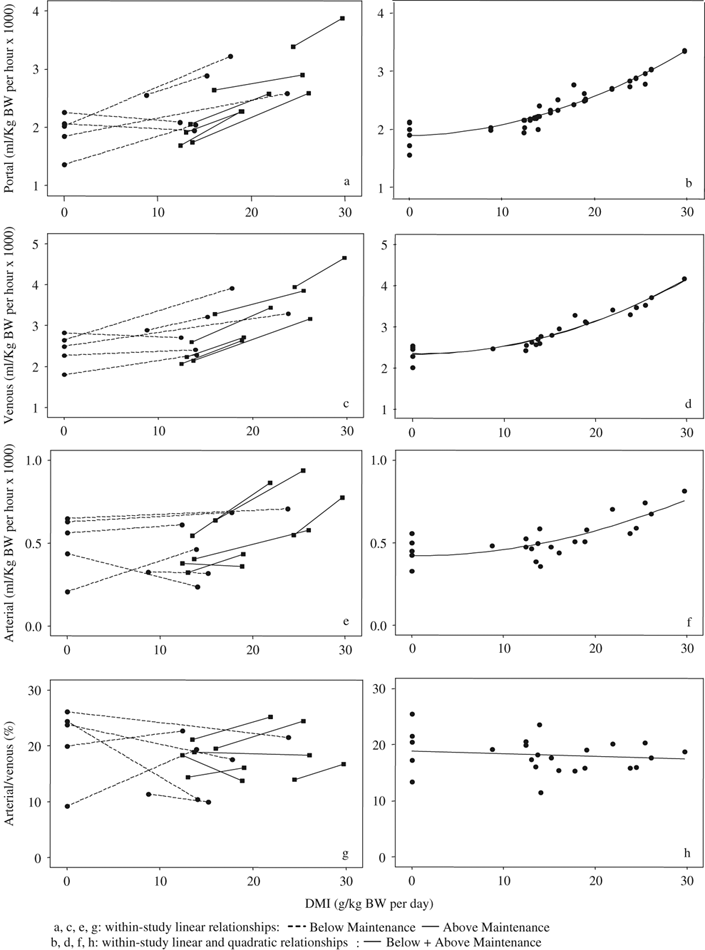
In Below Maintenance, the studies had no significant effect on DMI. When DMI increased by 1 g/kg BW per day, blood flows increased by 32.1, 34.6 and 2.5 ml/kg BW per hour in the portal vein (P < 0.05), hepatic vein (P < 0.05) and hepatic artery (NS), respectively (Table 2). DMI did not affect the hepatic arterial/venous blood flow. The general intercepts were significantly different from zero for all three vessels (P < 0.001). Differences in αi could not be attributed to any of the quantitative or qualitative factors tested. For all three blood vessels, r.m.s.e. was not improved by MEI compared with DMI (Tables 2 and 3). The analysis of residuals showed normal distributions. No outliers were detected. Finally, the relationship between HABF v. PBF was not significant (Figure 3).
Response equations of hepatic blood flows (ml/kg BW per hour) to dry matter intake (g/kg BW per day) in sheep fed Below or Above Maintenance (M)

α = general intercept; αi = individual intercept; β 1 = linear slope; β 2 = quadratic slope; s.e. = standard error; r.m.s.e = residual mean square error.
Maintenance energy requirement was set at 150 kJ metabolisable energy intake/kg BW per day (INRA, 1988).
For a given hepatic blood flow, values with different superscripts in the same column are significantly different at P < 0.01.
P = probability: *P < 0.05; **P < 0.01; ***P < 0.001; NS = non-significant.
αi significance (n) = number of significant individual intercepts (P < 0.05).
Response equations of hepatic blood flows (ml/kg BW per hour) to metabolisable energy intake (kJ/kg BW per day) in sheep fed Below or Above Maintenance (M)

α = general intercept; αi = individual intercept; β 1 = linear slope; β 2 = quadratic slope; s.e. = standard error; r.m.s.e = residual mean square error.
Maintenance energy requirement was set at 150 kJ metabolisable energy intake/kg BW per day (INRA, 1988).
For a given hepatic blood flow, values with different superscripts are significantly different at P < 0.01.
P = probability: *P < 0.05; **P < 0.01; ***P < 0.001; NS = non-significant.
αi significance (n) = number of significant individual intercepts (P < 0.05).
Changes in hepatic blood flows with Above Maintenance intake
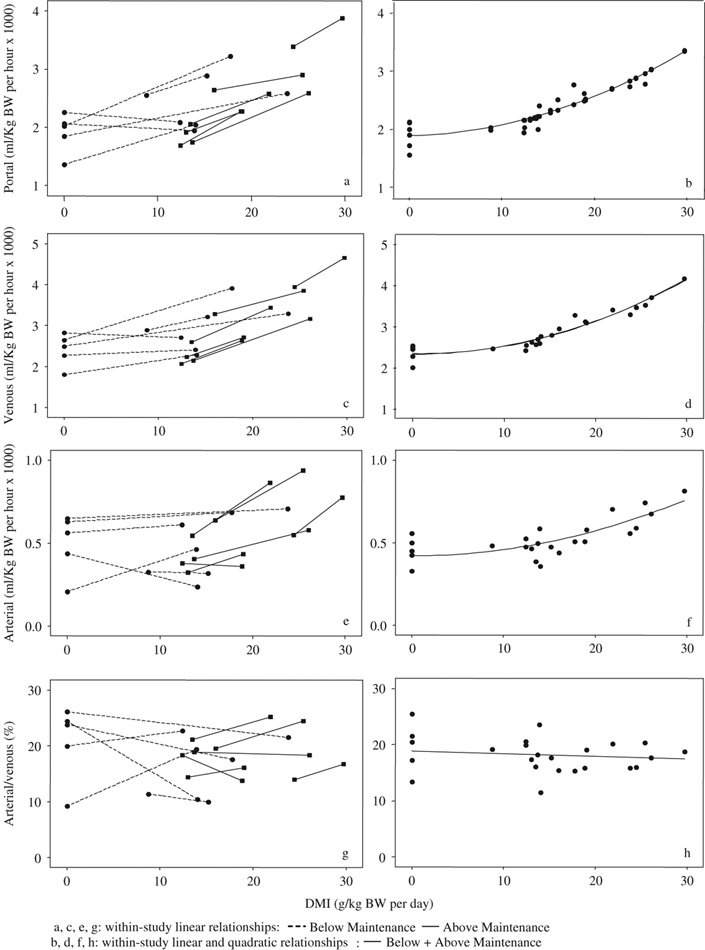
In Above Maintenance, the studies had no significant effect on DMI. When DMI increased by 1 g/kg BW per day, the portal venous, hepatic venous and hepatic arterial blood flows increased linearly by 61.9, 84.5 and 22.6 ml/kg BW per hour (P < 0.01) respectively (Table 2, Figure 2). Even so, the hepatic arterial/venous blood flow was not significantly related to increases in intake. The general intercepts were all significantly different from zero (P < 0.001) except in the relationship of HABF v. DMI. The individual intercepts were influenced by the studies. In portal and hepatic veins, r.m.s.e. was not improved by MEI compared with DMI, while in the hepatic artery, it was similar between MEI and DMI. The post-analysis showed normal distributions of residuals. An outlier was detected, but kept in the analysis as there was no obvious reason for its rejection and it had no significant effect on slopes and intercepts.
Effect of dry matter intake (DMI) on hepatic blood flows in ovine fed Below or Above Maintenance; within-study relationships; linear: (a) portal, (c) venous, (e) arterial, (g) hepatic arterial/venous blood flow; quadratic: (b) portal, (d) venous, (f) arterial, (h) hepatic arterial/venous blood flow.
In Above Maintenance, HABF increased linearly and significantly with the PBF (Figure 3):
HABF (ml/kg BW per hour) = 302.2 (s.e. = 119.2, P = 0.052) × PBF (ml/kg BW per hour) − 186.7 (s.e. = 298, P = 0.559); R 2 = 69.9%, r.m.s.e. = 112.1, number of studies = 6, number of observations = 12.
Within-study linear relationships between hepatic arterial and portal blood flows in ovine fed Below or Above Maintenance.

Response equations differed between Below Maintenance and Above Maintenance (Tables 2 and 3). The increases in portal and hepatic venous blood flows with DMI were lower in Below Maintenance than in Above Maintenance. With DMI, the slopes differed significantly with the level of intake in the three vessels (P < 0.01). With MEI, they differed significantly in the hepatic vein and hepatic artery (P < 0.01) but not in the portal vein (P = 0.20).
General responses of hepatic blood flows with intake
General responses of blood flows with DMI were studied in Below + Above Maintenance while accounting for the differences stated above (Tables 2 and 3, Figure 2). As expected, significant quadratic response equations could be calculated for all vessels. Generally, r.m.s.e. for the quadratic relationships were within the ranges of r.m.s.e. values of linear relationships for both Below and Above Maintenance. Even with quadratic relationships, the hepatic arterial/venous blood flow remained unrelated to the level of intake. Finally, the slopes of the hepatic arterial/venous blood flow v. DMI were positively correlated with OMD (r = 0.597, P < 0.05). The analysis showed normal residuals. Differences between individual intercepts could not be explained; LS means were neither correlated with the diet composition, nor explained by qualitative factors (method of measurement of blood flow and physiological stage).
In the portal and hepatic veins, the average r.m.s.e. obtained with DMI quadratic models was lower than the average r.m.s.e. of studies. Finally, the quadratic relationship calculated between HABF and PBF was not significant.
Because of the wide range of experimental r.m.s.e., 1/r.m.s.e. and number of animals/r.m.s.e. were tested as weighting factors in the quadratic covariance model of venous blood flow v. DMI (Table 4). In both cases, the constant α, the quadratic slope β 2 and R 2 were not significantly modified by weighting. On the other hand, weighting by number of animals/r.m.s.e. significantly increased r.m.s.e. (P < 0.05).
Effect of weighting the quadratic relationship of hepatic venous blood flow (HBF, ml/kg BW per hour) against dry matter intake (DMI, g/kg BW per day) in sheep (Below + Above Maintenance)

r.m.s.e. = residual mean square error reported in the publication; s.e. = standard error.
The following model is used: HBF = α + αi + β 2 DMI2, where α and β 2 are the general intercept and slope, respectively, and α i corresponds to the effect of study i.
Values on the same line with different superscripts are significantly different (P < 0.05).
αi significance (n) = number of significant individual intercepts (P < 0.05).
Finally, the comparison of quadratic within- and between-study relationships for portal, venous and hepatic arterial blood flows v. DMI (slopes and intercepts) showed no significant difference.
Discussion
Methodology
Considering that databases from literature data are inherently unbalanced statistically, it is necessary to make sure that the research question can be addressed with the available data (Sauvant et al., Reference Sauvant, Schmidely, Daudin and St-Pierre2008). In the present case, available data suggested that the responses of hepatic blood flows to intake might vary whether diet composition remained constant or not. This dataset was, however, too unbalanced to allow a proper interpretation of the effects of a change in both the level of intake and diet composition. The research question was therefore limited to studying the influence of intake at constant diet composition. A selection of experiments and of studies within experiments was accordingly made, making sure at all steps that there was no bias due to interfering variables, qualitative factors or study effect. This was done by studying the effect of the variables of the diet composition and qualitative factors (physiological stage, methods of measurement, etc.) on the relationships obtained. It revealed that no variable of the diet composition was significant, except OMD. Considering the small number of studies available for this meta-analysis, the study effect was considered fixed rather than random (Sauvant et al., Reference Sauvant, Schmidely, Daudin and St-Pierre2008). The influence of the study effect on within-study relationships was also checked. For this purpose, within and between-study relationships were compared, showing no difference. Therefore, the relationships obtained can be generalised to cases other than those of the selected studies if they fall within the range of validity of the models (defined by the characteristics of the selected dataset).
Description of the available and selected dataset
The available dataset showed that 50% of the international research efforts on net nutrient fluxes measured in sheep included the liver, and that 17% focused on changes in level of intake at constant diet composition. Based on published papers, studies were identified to explore, by meta-analysis, the changes in hepatic blood flows as a function of intake. Only papers presenting the results of blood flows in the portal and hepatic veins were retained (n = 12 studies). However, despite a restricted selected dataset, the post-model analysis showed that the conclusions obtained were robust.
Below Maintenance and Above Maintenance groups had similar physiological states (non-productive adult), but different types of diets and methods of determination of PAH. According to the level of intake, DMI, MEI, ME concentration, proportion of concentrate in the diet, OMD varied significantly (Table 1; P < 0.05). The composition of diets differed between Below Maintenance and Above Maintenance. In Below Maintenance diets were composed of forage only, whereas in Above Maintenance diets also included concentrates. The latter variations of diet composition could probably explain a part of the observed differences in the responses of blood flows between Below Maintenance and Above Maintenance. Averaged blood flows and arterial/venous hepatic blood flows were similar between Below Maintenance and Above Maintenance, probably because of the limited number of observations and the ranges of intake considered.
Increase of hepatic blood flows with intake
Blood flows in the portal vein are known to increase with intake (Webster et al., Reference Webster, Osuji, White and Ingram1975; Ortigues, Reference Ortigues1991; Rémond et al., Reference Rémond, Ortigues-Marty, Isserty and Lefaivre1998; Bermingham et al., Reference Bermingham, Nozière, Vernet, Lapierre, Léger, Sauvant and Ortigues-Marty2008). On average during the day this increase seems to be related primarily to a bulk effect of feed intake rather than the nutrient supply (Han et al., Reference Han, Nozière, Rémond, Chabrot and Doreau2002). In agreement with these findings, the present results showed that compared with DMI, MEI did not improve the quality of the fit (based on r.m.s.e. and R 2). However, in the selected dataset, the dietary ME concentration varied with intake (P < 0.001; Table 1); thus the influence of intake could not be fully dissociated from that of diet composition on hepatic blood flows.
In Below Maintenance, blood flows increased with an increase in intake in portal and hepatic veins but not in the hepatic artery. Five studies included fasting animals. In the derived relationships, the values of hepatic blood flows in fasting animals did not appear as outliers in the post-model steps. From the quadratic relationships of hepatic blood flow v. DMI, portal, arterial and venous blood flows at fast could be assessed at 1951 (±154), 2415 (±127) and 464 (±45) ml/kg BW per hour. These values were consistent with those of Webster et al. (Reference Webster, Osuji, White and Ingram1975) and Katz and Bergman (Reference Katz and Bergman1969). These results show that the driving force of PBF is intake and nutrient absorption, while that of HABF is more complex, and probably depends on the nutrients derived from tissue mobilisation that are transported in the general circulation to the liver.
In Above Maintenance, blood flows increased significantly with intake in all three blood vessels: portal vein, and hepatic vein and artery. The portal vein accounted for most of the variations in hepatic venous blood flow with DMI (93% in Below Maintenance and 73% in Above Maintenance).
In Below + Above Maintenance, the differences of slopes and intercepts between Below Maintenance and Above Maintenance justified combining Below Maintenance and Above Maintenance relationships. The fact that in Below + Above Maintenance the slopes of portal, venous and arterial blood flows v. DMI were positively correlated with DMI presupposed the existence of quadratic relationships between portal, venous and hepatic blood flows and DMI. The quadratic relationships obtained for Below + Above Maintenance were robust; the R 2 was high, lying between 71% and 91%, and the r.m.s.e. was close to that of the Below Maintenance and Above Maintenance linear relationships. Compared with the separate linear relationships, the quadratic relationships apply to a wider range of intake with a single value of intercept. The quadratic relationships were used to estimate the increase in blood flows v. MEI in Below Maintenance (0 to 150 kJ/kg BW per day) and in Above Maintenance (150 to 300 kJ/kg BW per day). In these conditions, the increase was about three times higher in Above Maintenance than in Below Maintenance. Furthermore, this increase was comparable in the portal vein, hepatic vein and hepatic artery. Our results were consistent with those of Webster et al. (Reference Webster, Osuji, White and Ingram1975), who used an exponential relationship to describe the changes in PBF v. MEI. This effect could be related to a difference in metabolism between the two levels of intake, i.e. mobilisation of body reserves in Below Maintenance and absorption of nutrients from feed intake in Above Maintenance.
Between studies, the variations in interfering variables were marked (proportion of concentrate in the diet, OMD, ME concentration). It was important to ensure that these variations had no influence on the within-study relationships. Within and between studies, quadratic relationships were not significantly different, showing the absence of bias due to studies. As a consequence, the quadratic relationships obtained in Below + Above Maintenance can be applied to other studies of characteristics similar to those of the present dataset. The only significant influence detected was that of OMD on the arterial/venous blood flow v. DMI relationship. Physiologically, it suggests that blood flows depend both on bulk and on the nutrient density of the diet. Furthermore, the quadratic relationships were consistent with the known quadratic relationships for PBF v. intake (MEI) at constant chemical composition of the diet in sheep as suggested by Webster et al. (Reference Webster, Osuji, White and Ingram1975) and Nozière et al. (Reference Nozière, Rémond, Bernard and Doreau2000).
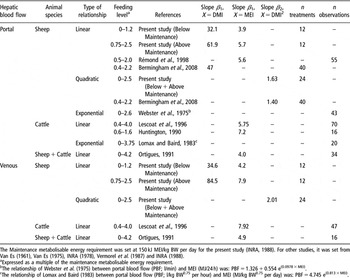
The linear and curvilinear relationships obtained here in the portal vein were compared with published relationships in sheep and cattle (Table 5). In the relationships of PBF v. MEI (Rémond et al. (Reference Rémond, Ortigues-Marty, Isserty and Lefaivre1998) and Bermingham et al. (Reference Bermingham, Nozière, Vernet, Lapierre, Léger, Sauvant and Ortigues-Marty2008) in sheep, and Huntington (Reference Huntington1990) in cattle), MEI (kJ/kg BW per day) ranges were comparable to those in the present study. In sheep, similar slopes were obtained in the present study compared with those of Rémond et al. (Reference Rémond, Ortigues-Marty, Isserty and Lefaivre1998) with MEI above maintenance, and by Bermingham et al. (Reference Bermingham, Nozière, Vernet, Lapierre, Léger, Sauvant and Ortigues-Marty2008) with DMI below and above maintenance. The slopes in sheep were lower than those in cattle (Huntington, Reference Huntington1990). Species differences (sheep v. cattle) have already been noted (Vernet et al., Reference Vernet, Lapierre, Nozière, Léger, Sauvant and Ortigues-Marty2005a; Bermingham et al., Reference Bermingham, Nozière, Vernet, Lapierre, Léger, Sauvant and Ortigues-Marty2008), but the origin of these differences (strict species differences or indirect effects due to dietary differences between species) has not been identified. In the hepatic vein, because of differences in levels of intake, comparisons with published relationships were not possible.
Published relationships between hepatic blood flows (ml/kg BW per hour) and dry matter intake (DMI, g/kg BW per day) or metabolisable energy intake (MEI, kJ/kg BW per day) in sheep and cattle

The Maintenance metabolisable energy requirement was set at 150 kJ MEI/kg BW per day for the present study (INRA, 1988). For other studies, it was set from Van Es (Reference Van Es1961), Van Es (Reference Van Es1975), INRA (1978), Vermorel et al. (Reference Vermorel, Bocquier, Vernet and Brelurut1987) and INRA (1988).
aExpressed as a multiple of the maintenance metabolisable energy requirement.
bThe relationship of Webster et al. (Reference Webster, Osuji, White and Ingram1975) between portal blood flow (PBF; l/min) and MEI (MJ/24 h) was: PBF = 1.326 + 0.554 e(0.0978 × MEI).
cThe relationship of Lomax and Baird (Reference Lomax and Baird1983) between portal blood flow (PBF; l/kg BW0.75 per hour) and MEI (MJ/kg BW0.75 per day) was: PBF = 4.745 e(0.813 × MEI).
Hepatic arterial/venous blood flow amounted on average to 18.2% with a broad range from 9.2% to 26.1%. Isserty et al. (Reference Isserty, Ortigues and Remond1998) showed that the choice of the laboratory technique for PAH determination significantly influenced the calculated hepatic arterial/venous blood flows. In sheep, much lower hepatic arterial/venous blood flows (2% to 6%) were measured by Barnes et al. (Reference Barnes, Comline and Dobson1986) using microspheres and by Lobley et al. (Reference Lobley, Connell, Lomax, Brown, Milne, Calder and Farningham1995) with PAH dilution (with the inclusion of a deacetylation step in the analysis). In the available dataset, different techniques were used for determination of PAH between Below Maintenance (where heating and acid deproteinisation was mostly used) and Above Maintenance (mainly dialysis method). No influence of the analysis method of PAH could be detected on the LS means or on the individual slopes. Even so, it is still possible that differences in laboratory techniques for PAH determination influence the responses of the hepatic arterial/venous blood flow with intake. This specific question would need to be studied experimentally.
Hepatic arterial blood flow was also studied as a function of PBF (Figure 3). In Below Maintenance and Below + Above Maintenance, the relationship was not significant. In Above Maintenance, a significant relationship was established. It can be used to validate the calculation of HABF in multicatheterised animals, when PAH is analysed using the dialysis method.
Despite these methodological considerations, these results are consistent with the distinct regulation mechanisms of hepatic blood flows as a function of the level of intake. However, the present study pinpoints the absence of significant changes in hepatic arterial/venous blood flow with DMI or MEI, whatever the level of intake and the type of model considered. This finding differed from the short-term (10 to 60 min) regulations shown by Lautt (Reference Lautt1980 and Reference Lautt1983) in cats. It is noteworthy that within studies, the individual slopes of the relationship of hepatic arterial/venous blood flow v. DMI were positively correlated to OMD. This correlation suggested that the hepatic arterial/venous blood flow should be enhanced with more digestible diets. It would be interesting to use a different dataset to study specific changes in hepatic blood flows with different dietary chemical composition (ME or OMD concentrations) in the absence of changes in the level of intake.
Experimental error and error of prediction
Between studies, the r.m.s.e. of portal and venous blood flows varied widely (Table 1). In order to try to explain these variations, the influence of qualitative factors on r.m.s.e. was studied in Below + Above Maintenance: analytical methods, physiological stage, research group, number of animals used, experimental design and level of intake. The only significant factor was the number of animals used (P < 0.05). Only tendencies were shown for the research group and the level of intake. Although the distribution of the methods of determination of PAH differed between studies (Table 1), this factor had no significant influence on portal and venous blood flows r.m.s.e.
Weighting by 1/r.m.s.e. did not improve the accuracy of the models, and weighting by the number of animals × 1/r.m.s.e. factor yielded a different slope (Table 4). Similar conclusions on the low value of weighting were reported by Sauvant et al. (Reference Sauvant, Schmidely and Daudin2005) and Rico-Gomez and Faverdin (Reference Rico-Gomez and Faverdin2001), with larger databases. In addition, when it was described in the papers, the r.m.s.e. was closely related to the experimental design. As the experimental design changes with the study, it is difficult homogeneously to take into account the r.m.s.e. reported in papers.
To conclude, these relationships quantify the change in portal and hepatic venous blood flows with intake at constant diet composition. Results indicate that intake is an important determinant of hepatic blood flows. However, HABF do not change significantly with intake. The arterial/venous blood flow was evaluated at 18.5%. It does not change with intake but is influenced by OMD.
The relationships obtained are robust and R 2 values are generally high. Since within- and between-study relationships are statistically similar, the present relationships can be used to predict not only variations but also absolute values of hepatic blood flows from absolute values of intake. The predictions apply in the range of validity of the observations in sheep, physiological state, methods of PAH determination, diet composition and level of intake.
For the development of empirical models of net nutrient fluxes, there remains the question of whether arterial hepatic blood flows and arterial/venous blood flow are significantly influenced by the chemical composition of the diet. To date, available data do not allow us to establish general response equations for changes in diet composition.
Appendix
Description of studies identified and used in the present meta-analysis

aThese studies belong to the Below Maintenance group.
bThese studies belong to the Above Maintenance group.
DM = dry matter; ME = metabolisable energy.