

INTRODUCTION
The Colonial Development and Welfare (CD&W) Fund, launched by the British government in 1929, is a historical forerunner of modern development assistance.Footnote 1 The imperial aid initiative marked a major shift in colonial policy: it aimed to raise living standards in colonies lacking self-rule while simultaneously expanding markets for British products. Over its four-decade lifespan, the CD&W financed more than 11,200 projects across 56 territories, amounting to roughly 0.7% of British GDP and 9% of colonial budgets.
This article examines whether and how the CD&W program expanded colonial fiscal capacity—defined as the state’s ability to assess wealth and collect taxes (Besley and Persson Reference Besley and Persson2011). I show that imperial aid increased colonial taxation only after reforms to the Colonial Service aligned bureaucratic incentives with the program’s fiscal mandate. The CD&W initiative required colonial authorities to mobilize local revenue to cofinance development projects, yet this requirement was not automatically fulfilled. Its implementation depended on whether colonial officials were willing and able to raise taxes under conditions of limited monitoring and asymmetric information.
Delegation to colonial authorities under such conditions created agency problems. Although London defined the broad objectives of imperial aid, project design and implementation were left to colonial administrators, who had superior information about local conditions—notably, Hailey’s African Survey, the first comprehensive attempt to document African economic and social conditions, was not published until 1938, almost a decade after the launch of the CD&W program. Colonial officials, however, did not necessarily share the metropole’s developmental priorities and could attribute fiscal shortfalls to adverse local circumstances while exerting limited effort to expand taxation.
I argue that agency problems in the CD&W program were mitigated through a deliberate reconfiguration of the Colonial Service—the administrative backbone of British colonial rule—during the interwar period. Organizational reforms pursued two complementary goals: improving selection into the Service and strengthening performance incentives. Recruitment procedures were overhauled to attract qualified candidates whose preferences aligned with the metropole’s stated developmental objectives. Patronage appointments of governors gradually gave way to merit-based selection (Xu Reference Xu2018), while junior officers were increasingly recruited from leading British universities (Furse Reference Furse1962) and trained in year-long programs emphasizing administrative competence and development-related objectives (Stockwell Reference Stockwell2018).
At the same time, the Colonial Office—the metropolitan authority overseeing colonial administration—introduced formal performance evaluations based on observable metrics. Annual assessments became central to promotion, salary progression, and pension eligibility (Jeffries Reference Jeffries1938; Reference Jeffries1972). Under this system, career advancement depended less on seniority or personal connections than on measurable outcomes. Because CD&W projects required local cofinancing, tax revenue—a readily observable indicator—became a key performance metric for both governors and subordinate officers. Mobilizing revenue thus served not only the developmental agenda but also officials’ professional incentives, making compliance with the fiscal mandate incentive-compatible.
I test the argument in two parts. First, I estimate the impact of CD&W funding on annual colonial tax receipts in Sub-Saharan Africa. I focus on this region because it received roughly two-thirds of total CD&W funding (see Appendix A of the Supplementary Material), making it the part of the empire where the potential fiscal effects of imperial aid were greatest. In addition, the African focus allows me to draw on Albers, Jerven, and Suesse’s (Reference Albers, Jerven and Suesse2023) annual wage series to deflate tax revenues and aid over time, enabling cross-sectional and longitudinal comparisons. Two-way fixed effects estimates indicate that a one-standard-deviation increase in CD&W funding raised colonial tax revenue by approximately five percentage points, all else constant.
To address concerns about reverse causality, I reconstruct the criteria used by the Colonial Office to allocate funds using declassified correspondence and show that colonies with stronger fiscal capacity received disproportionately less assistance. To mitigate concerns about omitted variables that could drive tax revenue and imperial funds, I exploit exogenous variation in realized aid flows induced by shocks to the U.K.’s balance of payments (BoP). In particular, I instrument aid disbursements with the interaction between predetermined aid commitments and metropolitan financial conditions.
The second part of the empirical analysis turns to the organizational mechanisms underpinning the positive relationship between imperial aid and colonial taxation. I reconstruct the career trajectories of 80 colonial governors who served in Africa during the CD&W era and estimate two- and three-way fixed effects models, including colony, year, and governor effects. The results show that the effect of imperial funds on taxation was moderated by the appointment of governors selected under the new developmental goals of the metropole and by aligning professional rewards—including reappointment and pension eligibility—with programmatic goals. To address concerns about nonrandom assignment to governorships, I construct time-varying measures of personal connections between governors and their superiors at the Colonial Office, including shared schooling, overlapping university cohorts, and membership in the same companion orders. Overall, the evidence indicates that imperial aid expanded colonial taxation because organizational reforms screened officials aligned with the developmental mission and created strong career incentives for mobilizing local revenue.
The findings contribute to three broad literatures. First, the article offers a new explanation for the growth of fiscal capacity in late colonial Africa. While recent work documents rising taxation in this period (Albers, Jerven, and Suesse Reference Albers, Jerven and Suesse2023; Frankema and van Waijenburg Reference Frankema, van Waijenburg, Frankema and Booth2020; Gardner Reference Gardner2012; Xu Reference Xu2019), it does not link this expansion to the institutional design of late British imperial policy. I show that metropolitan development funds—when combined with reforms to the Colonial Service—induced colonial administrations to expand the tax base and implement new tax technologies, particularly income taxation.
Second, the analysis speaks to research on bureaucratic design and state personnel. Recruitment reforms emphasizing mission alignment resonate with formal and experimental evidence showing that shared values reduce monitoring costs and improve the performance of state bureaucracies (Ashraf et al. Reference Ashraf, Bandiera, Davenport and Lee2020; Besley and Ghatak Reference Besley and Ghatak2018). The introduction of performance-based promotion similarly aligns with evidence that meritocratic incentives enhance effort under information asymmetry (Colonnelli, Prem, and Teso Reference Colonnelli, Prem and Teso2020; Dal Bó, Finan, and Rossi Reference Dal Bó, Finan and Rossi2013; Moreira and Pérez Reference Moreira and Pérez2024; Xu Reference Xu2018). The Colonial Service thus provides a historical case in which selection and incentive reforms operated jointly to strengthen state capacity.
Third, this investigation contributes to recent efforts to unbundle British colonial policy in the final decades of empire. Lee and Paine (Reference Lee and Paine2024) and Opalo (Reference Opalo2022) examine the political legacies of constitutional reforms and colonial legislatures, while Huillery (Reference Huillery2009) and Ricart-Huguet (Reference Ricart-Huguet2022) assess the economic consequences of colonial—rather than imperial—investment in public services. This article instead examines how metropolitan development funds affected tax mobilization in the colonies, a core pillar of modern state capacity.
The remainder of the article is organized as follows. The “Imperial Aid” section provides an overview of the CD&W program. The “Aid Effects” section estimates its impact on colonial fiscal capacity. The “Making Imperial Aid Work” section examines how recruitment and promotion reforms within the Colonial Service mediated this relationship. The “Conclusion” section discusses whether the expansion of fiscal capacity persisted beyond colonial rule and reflects on a central tension of late imperial governance—while metropolitan intervention could strengthen bureaucratic capacity and tax mobilization, it did not resolve the underlying legitimacy crisis of imperial rule.
IMPERIAL AID
The interwar years were a turbulent period in British politics: the Labour Party assumed power for the first time (briefly in 1924 and again in 1929), unemployment exceeded 20%, protectionism regained political support, and national socialist and communist factions gained influence within the established parties. In this context, the British Parliament unanimously passed the 1929 Colonial Development Act, a bill granting imperial funds for development projects in Crown colonies and other dependent territories—territories without self-government.Footnote 2
The Colonial Development Fund reflected a variety of interests in British politics: the Liberals saw an opportunity to expand international markets amid economic contraction and tightening trade blocs (Eichengreen and Irwin Reference Eichengreen and Irwin1995); within Labour, the “Fabians” viewed the bill as a means to improve living conditions in the colonies, while trade unionists emphasized the prospect of cheaper inputs for British industry—a view shared by the Tories. Oswald Mosley, then a Labour politician and the leading negotiator of the bill in 1929, summarized the dual mandate of the CD&W program as follows: “The Bill is to develop the Colonies agriculturally and industrially and to provide employment in this country” (HC Committee, July 18, 1929). In the final years of the program, these original objectives were reaffirmed by the British government, but some backbenchers advocated using imperial aid to assuage demands for independence as well (HC Debate, March 1959).
The CD&W initiative represented a major deviation from the Gladstonian principle that had governed the relationship between the metropole and its colonies (Davis and Huttenback Reference Davis and Huttenback1988). Although occasional subsidies had been granted in the past to cope with natural disasters, this was the first time the metropole assumed responsibility for financing the economic development of the colonies (Constantine Reference Constantine1984; Stammer Reference Stammer1967). In its early years, most CD&W funds were directed to the West Indies, where a Comptroller General had been appointed to coordinate scheme proposals in the region. By 1940, it had become evident that the available funds were too modest to enable transformative projects and that the 1929 legislation overlooked an important dimension of development: education. In response, in June 1940, the British Parliament passed the Colonial Development and Welfare Act, stipulating that development policy should balance economic growth with the welfare of colonial populations. The 1940 Act represented a fundamental break with past colonial policy by recognizing that the social welfare of colonial subjects was essential to any meaningful conception of development. This legislative shift was accompanied by a fivefold increase in funds and a shift toward grants-in-aid, which thereafter accounted for roughly 95% of program funding.
Geopolitical circumstances impeded the full implementation of the Act. Only modest funding was issued in the early 1940s, and the few projects that moved forward were largely tied to wartime needs. As reflected in Figure 1, colonial development regained momentum in the final months of WWII. To encourage new applications, the British Parliament passed the Colonial Development and Welfare Act of 1945, which facilitated multiyear programming by allowing CD&W funds to cover recurrent expenditures. Most importantly, the 1945 bill eliminated an earlier provision requiring colonies to return any unspent balance by the end of the fiscal year. The legislation also more than doubled the funds authorized under the 1940 Act, increasing the total from £50 million to £120 million to be spent over 10 years. Colonies responded to the 1945 bill by submitting numerous new project proposals, ranging from infrastructure to health care and education. To accommodate this demand, the British government expanded the program through additional legislation in 1949 and 1950, and again in 1955, 1959, 1963, and 1965.
Total Annual Grants-in-Aid to the Empire
Note: Territorial CD&W grants to all participant Crown colonies and other nonself-governing protectorates. Refer to Appendix A of the Supplementary Material for full list. Values expressed in 1955 pound sterling.

Figure 1. Long description
A bar chart with the Y-axis labeled Total C D W Grant Issued (1955, Million pound sterling) ranging from 0 to 20 in increments of 5. The X-axis represents years from 1930 to 1970 in two-year increments.
* From 1930 to 1942, grants remain very low, consistently under 2 million.
* Starting in 1943, there is a significant upward trend, reaching approximately 6 million by 1945.
* A major surge occurs between 1948 and 1949, where values jump from roughly 7 million to over 13 million.
* Between 1949 and 1958, the values fluctuate between 12 and 15 million.
* The absolute peak occurs in 1960, reaching nearly 19 million.
* Following 1960, there is a steady and sharp decline. By 1964, the value drops to approximately 6 million, and by 1970, it sits just above 5 million.
Following a wave of independence declarations, the CD&W program was terminated in 1969, after which British aid continued in the form of bilateral Official Development Assistance. After four decades in operation, London had transferred £362 million in CD&W funds to the colonies. Relative to the size of the British economy at the time, the CD&W program accounted for approximately 0.9% of GDP at its inception and 0.6% at its conclusion.Footnote 3 Per capita disbursement of imperial aid averaged £0.19 in 1955 prices, which corresponds to approximately £6.21 or $7.85 in 2024 values.Footnote 4 This level of per capita funding was roughly one-fifth lower than the $9.93 the United States invested in Sub-Saharan Africa in 2024,Footnote 5 while the British economy in 1955 was approximately 32 times smaller than the U.S. economy in 2024, measured in PPP-adjusted real terms. Relative to local budgets, CD&W grants in Africa—where most program resources were allocated—represented on average about 9% of total local revenue and exceeded 50% in smaller colonies, such as Bechuanaland (now Botswana) and Gambia.
The Workings of Imperial Aid
Colonial development funds were granted to projects rather than budgets. Projects were formulated and implemented by members of the Colonial Service, civil servants recruited in London and assigned to the colonies on a permanent basis. The agency of native peoples at every stage of the CD&W program remained limited and indirect. District officials—mid-ranking officers of the Colonial Service responsible for day-to-day administration—toured the territories, met with chiefs, and collected requests for development projects ranging from roads and soil conservation to elementary schools. The final decision, however, remained with the colonial officer.
Once drafted, project proposals were submitted to the Colonial Office in London for evaluation. Initially, all proposals were examined by the Colonial Development Advisory Committee (CDAC)—a veto player composed of business owners, trade unionists, and public officials—which advised the Colonial Office. Project scrutiny was strict and ensured that development funds were not used as budgetary aid (Abbott Reference Abbott1971, 77). Following the internal expansion of the Colonial Office in 1941, the CDAC was dissolved and the evaluation of applications was transferred to newly created sectoral and regional departments, which consulted with the Treasury to assess the financial feasibility of proposals (Jeffries Reference Jeffries1956). In most cases, sponsors were asked to revise and resubmit their proposals. Conditional on approval by both the Colonial Office and the Treasury, the Secretary of State for the Colonies then presented the project to Parliament for approval, granting Members of Parliament an opportunity for scrutiny (Morgan Reference Morgan1980a, 81). An Auditor Office was also established to monitor expenditures and support oversight by the Colonial Office (Morgan Reference Morgan1980a, 90).
The tight supervision of CD&W funds minimized fungibility—particularly the diversion of development resources to cover budget deficits, which would have weakened incentives to expand colonial taxation. Neither the published record nor the archival materials provide any indication that funds were redirected for unintended purposes.
The Fiscal Mandate
CD&W funds were designed to help colonial authorities fill the financing gap of specific development projects. In other words, imperial aid was intended to complement local revenues, not replace them (Kaldor Reference Kaldor1963, 410). To avoid fiscal relaxation, the fiscal infrastructure of the colonies—or “state machinery,” as officials referred to it—received close attention from program designers. Although no universal co-payment target was adopted, the Colonial Office repeatedly emphasized the importance of local tax mobilization to support development efforts. Arthur Creech Jones (Labour), Undersecretary of State for the Colonies, described this objective as follows (HC Debate, Feb 1945; italics added):
I would also like the further implementation of the pledge which was given at the time of the passing of the 1940 Act, that there shall be a steep increase of direct taxation in the Colonies. The building up of taxable capacity should go on, and the work of development accelerated, but that direct taxation, already started in many of the Colonies, should as a policy be more vigorously pursued.
Creech Jones’s statement illustrates what the official mind expected from colonial administrators—namely, the expansion of taxable capacity—while acknowledging a persistent obstacle to tax reform: opposition from both European settlers and African populations to direct taxation (Gardner Reference Gardner2012).
Starting in 1945, colonial authorities were required to submit 10-year development plans that included estimates of recurrent costs and a statement of both metropolitan and local funds budgeted for CD&W projects. George Hall (Labour), Secretary of State for the Colonies, reminded colonial administrations of the need to raise direct taxation to cofinance development plans (Cmd. 6713, 1945: par. 11):
Rates of taxation vary considerably from one colonial territory to another, and it is important that direct taxation borne mainly by the richer members of the community should be reviewed, if this has not been done recently, so as to ensure that local revenues are making an adequate and fair contribution towards the cost of the development and advancement of the territory.
The same communication enclosed a memorandum explaining how development plans were to be formulated. Section II.(2) of this memorandum, Revenue side of the plan, reaffirmed the need to increase taxation in order to secure the future revenues required to fund CD&W projects. Consistently, among the first 21 development plans approved by the Colonial Office, more than one-third of all project proposals were financed locally (Bradley Reference Bradley1950, 56). The fiscal mandate was also reflected in individual project applications, which required colonial authorities to specify the sources of local revenue that would help finance each CD&W project. Appendix E of the Supplementary Material provides one such example for Gambia.
Efforts to strengthen colonial taxation through the CD&W program continued over the following decade. John Dugdale (Labour), Minister of State for Colonial Affairs in 1950, referred rather explicitly to the conditionality embedded in the assistance program (HC Debate, November 1950):
When we come to consider requests which some territories will no doubt make from time to time for additional funds, we shall feel bound to have regard, no matter how admirable the purpose for which the money is sought, to the ability and willingness of these territories to increase their own taxation within the limits of their capacity. We attach considerable importance to this.
Five years later, Alan Lennox-Boyd (Conservative), Secretary of State for the Colonies, reiterated the principle of shared financial responsibility between the metropole and the colonies in a despatch addressed to colonial governors (Cmd. 9462, 1955, par. 10):
Taking the colonial territories as a whole, local funds have since 1945 provided more than half the total finance required for development. Governments will naturally continue to look first to their own financial resources [
$ \dots $
 ] and will need carefully to examine the possibilities of raising additional revenues for development.
The emphasis on revenue mobilization was well understood by Colonial Service personnel. A conference tellingly titled Techniques of Development Finance in Colonial Territories, attended by 33 colonial tax administrators from Africa, the West Indies, and the Far East, acknowledged the following in its final memorandum (Conference of Techniques, 1951: p. 7; italics added):
It is, after all, one of the fundamental objectives of His Majesty’s Government’s policy of Colonial Development that the revenues of the less fortunate territories should be strengthened as a result of the assistance which has been so generously given.
Efforts to expand the colonial fiscal machinery in support of development were substantial. By 1959, 64% of all development projects were funded by local resources compared to 15% by imperial aid (Morgan Reference Morgan1980c, 159), while total development expenditure accounted for roughly 25% of all colonial spending (Cmd. 672, 1959: p. 3).
AID EFFECTS
In this section, I examine systematically whether the inflow of CD&W funds expanded local taxation in 12 Crown colonies and protectorates in Sub-Saharan Africa, which received almost two-thirds of all CD&W funds. The territories in the sample (with modern-day names in parentheses) are Basutoland (Lesotho), Bechuanaland (Botswana), Gambia, Gold Coast (Ghana), Kenya, Nigeria, Northern Rhodesia (Zambia), Nyasaland (Malawi), Sierra Leone, Swaziland (Eswatini), Uganda, and Tanganyika (Tanzania).Footnote 6 To reconstruct the colony–year CD&W issues, I digitized the Colonial Development Annual Abstract Accounts, 1930–39 and the U.K.’s Annual Civil Appropriation Accounts, 1940–69. Footnote 7 95% of funds were issued in grant form, hence I omit loans-in-aid.
To analyze the fiscal impact of imperial aid, I focus on annual colonial taxation. I draw these data from Albers, Jerven, and Suesse (Reference Albers, Jerven and Suesse2023) and use real tax revenue per capita as the outcome variable. This measure is computed as nominal tax revenue per capita divided by nominal day wages of low-skilled workers. Substantively, it indicates the number of workdays that the government collects from each worker on an annual basis. Crucially, including nominal wages in the denominator allows meaningful comparisons over time and across territories.Footnote 8 The tax revenue measure includes standard taxes in colonial Africa—direct taxes (e.g., poll taxes and income taxes) and indirect taxes (e.g., excises and consumption taxes)—but excludes trade taxes, a common fiscal instrument in low-capacity settings. The resulting measure therefore captures hard-to-collect taxes expressed in per capita constant value.
To facilitate comparison between series, I express annual CD&W grant-in-aid issues on the same scale as the outcome variable: wage-deflated CD&W issues per capita. I show the bivariate relationship between real tax revenue and CD&W funds per capita in Figure 2 in the 12 African colonies. Next, I investigate whether the observed positive association can be interpreted causally.
Tax Revenue versus CD&W Grants in British African Colonies
Note: Tax revenue and CD&W issues are expressed in per capita, constant values.

Figure 2. Long description
The scatter plot uses a horizontal X axis labeled C D W Grant Issued with a scale from 0 to 15 and a vertical Y axis labeled Tax Revenue with a scale from 0 to 30.
Data Distribution:
* The majority of data points, represented by open circles, are densely clustered in the lower-left corner where C D W Grant Issued is between 0 and 2 and Tax Revenue is between 0 and 10.
* As C D W Grant Issued increases toward 15, the data points become more sparse but generally move higher on the Y axis.
* A few outliers exist, including one point near 1 on the X axis with a Tax Revenue near 28, and another near 12 on the X axis with a Tax Revenue near 21.
Trend Line and Legend:
* A dashed grey line representing Fitted values shows a positive linear increase, starting at approximately 5 on the Y axis when X is 0 and rising to approximately 18 on the Y axis when X is 15.
* A legend on the bottom right identifies the open circles as Tax Revenue real values and the dashed line as Fitted values.
OLS Models
Throughout, I consider the fiscal effort exerted by the colonial administration to be proportional to annual issues of CD&W grants. To test this proposition, I fit the following equation:

where the first lag of the dependent variable is included to account for serial dependence;
$ {X}_{it} $
 denotes time-varying colonial covariates; and
$ {\rho}_i $
 and
$ {\theta}_t $
 denote colony and year fixed effect batteries, respectively, and account for time-invariant characteristics of colonies and common secular trends. Note that the contemporaneous relationship that I model in Equation 1 measures the immediate efforts that colonial administrators made to match imperial aid with local resources—as required by the CD&W fiscal mandate—and it does not capture dynamic effects of aid on the tax capacity.Footnote
9
The CD&W program was intended to promote economic growth and improve welfare in recipient colonies; hence, any control variables that correlate with either of these outcomes may bias the estimate of interest,
$ {\beta}_1 $
 , in Equation 1). Thus, I opt for a minimal battery of controls,
$ {X}_{it} $
 : the first is colony population, which I log-transform. Population is shown to be a key determinant of CD&W fund allocation (see Appendix I of the Supplementary Material) and is likely correlated with wealth, and thus with the tax base. Population data are drawn from Albers, Jerven, and Suesse, who reproduce data originally compiled by Frankema and Jerven (Reference Frankema and Jerven2014)—arguably the most reliable historical population dataset for the African continent to date. I also include an original variable for the occurrence of systemic unrest in the colonies. Social turmoil may have prompted colonial officials to use tax money to expand security spending while simultaneously delaying development projects, making unrest a relevant covariate. This binary indicator is coded manually based on information in 300+ Annual Colonial Reports and supplemented by secondary sources.
Access to CD&W funds terminated right after independence, implying that territories remain in the dataset as long as they are part of the empire. Because independence in the British Empire occurred gradually, the panel becomes unbalanced in the later years of the analysis.Footnote 10 I show that results hold when the data are subset to the 1946–61 period, when the panel is strongly balanced and aid flows peak.
Correlates of Imperial Aid
Column 1 in Table 1 reexamines the bivariate relationship between taxation and CD&W funds in Figure 2 keeping time-invariant colony-level variation constant. The coefficient is positive and different from zero.Footnote
11 Column 2 accounts for serial correlation by adding a first lag of the dependent variable, leading to a substantial attenuation of
$ {\widehat{\beta}}_1 $
 . Column 3 adds a battery of year fixed effects to account for any secular trend in aid or tax mobilization. Column 4 adds two covariates: population and colonial unrest. Substantively, results here imply that a one-standard-deviation increase in CD&W issues increases average tax revenue by six percentage points, holding everything else constant.Footnote
12 Column 5 considers the political landscape in the United Kingdom: a Prime Minister attuned to the new vision for the colonies (exemplified by Macmillan’s “Winds of Change” speech) may have been more lenient in enforcing the fiscal mandate while also issuing more CD&W funds. I therefore fit a battery of Prime Minister fixed effects.Footnote
13 The coefficient on CD&W issues increases marginally in these models; however, a key limitation is that year fixed effects drop due to collinearity.
Colonial Tax Revenue and CD&W Issues

Table 1. Long description
The table consists of 7 columns numbered 1 through 7.
* C D W grant issue: Values range from 0.18 to 0.85 across models. Specifically, Model 1 is 0.85*** (0.10), Model 2 is 0.21*** (0.08), Model 3 is 0.20** (0.09), Model 4 is 0.20** (0.09), Model 5 is 0.22*** (0.08), Model 6 is 0.18* (0.10), and Model 7 is 0.28** (0.11).
* Colony F E: Yes for all models.
* Lagged D V: No for Model 1; Yes for Models 2 through 7.
* Time F E: No for Models 1, 2, and 5; Yes for Models 3, 4, 6, and 7.
* Colony controls: No for Models 1, 2, and 3; Yes for Models 4, 5, 6, and 7.
* P M F E: Yes for Model 5; No for all others.
* Time period: Full for all models except Model 6, which covers 1946 to 61.
* Synched F Y: Yes for Model 7; No for all others.
* Mean D V: 5.79 for Models 1 through 5; 6.86 for Model 6; 5.96 for Model 7.
* Observations: 397 for Models 1 through 5; 181 for Model 6; 215 for Model 7.
* R-squared: Ranges from 0.57 in Model 1 to 0.91 in Model 7.
Note: Robust standard errors are in parentheses. Significance levels are indicated by asterisks: * p < 0.10, ** p < 0.05, and *** p < 0.01.
Note: Monetary units are expressed in real per capita terms. Colony controls are: log of Population and Colonial Unrest. Refer to Appendix O of the Supplementary Material for the expanded version of the regression table. Robust standard errors in parenthesis: *
$ p<0.10 $
 , **
$ p<0.05 $
 , and ***
$ p<0.01 $
 .
Columns 6 and 7 present two robustness tests. Column 6 restricts the analysis to a strongly balanced panel covering the 1946–61 period, from the postwar years to the beginning of the empire’s end. In this balanced sample, a one-standard-deviation increase in aid raises tax revenue by four percentage points, similar in magnitude to the estimate in column 4.
Column 7 addresses misalignments between fiscal years in the metropole and the colonies. The U.K. fiscal year ran from April to March of the following year, whereas colonial fiscal calendars varied. Some colonies followed the metropole’s fiscal year (Gold Coast, Nigeria, Basutoland, Bechuanaland, and Swaziland), others used the January-to-December calendar year (Gambia), and several later adopted a July-to-June fiscal year beginning in 1954 (Kenya, Northern Rhodesia, Nyasaland, Tanganyika, and Uganda) and 1958 (Sierra Leone). As a result, in some colony–years, the British fiscal year—the time reference for aid—includes three months from the colony’s previous fiscal year, which serves as the time reference for taxes. To mitigate reverse causation concerns, column 7 reruns Equation 1 on a subsample consisting of colonies that shared the U.K.’s fiscal calendar throughout the period and those that transitioned to the July–June fiscal year after the change. Although the sample size decreases, the magnitude and precision of the coefficient of interest remain comparable to the full-sample results.Footnote 14 Next, I address two threats to inference: selection and reverse causality.
Allocation Criteria
Did colonies with greater fiscal capacity receive more imperial aid? The short answer is no. I reconstruct allocation criteria using declassified Colonial Office correspondence from the 1940s, which documents a six-month internal debate culminating in a formal recommendation to the Secretary of State for the Colonies. The recommendation specified the variables that should guide fund allocation.
I test the predictive power of these criteria in a regression framework, using data on the six allocation rounds over the full life span of the CD&W program and on all variables listed in the recommendation. Two variables—colonial population and revenue per capita—explain over two-thirds of the variation in allocations; no other variable is statistically significant. Crucially, higher revenue per capita predicts smaller aid allocations. Imperial aid was therefore disproportionately directed toward fiscally weaker colonies, mitigating concerns about reverse causality. Appendix I of the Supplementary Material details the archival reconstruction and empirical results.
Shocks in Imperial Aid
Unobserved time-varying confounders may bias the relationship between aid issues and colonial tax mobilization. To address this concern, I exploit shocks to the U.K. BoP as a source of exogenous variation in CD&W issues.
The British economy faced persistent external constraints after WWI. The rise of global protectionism and the Great Depression reduced demand for British exports and weakened access to foreign reserves. Financial pressures intensified further due to large U.S.-dollar loans incurred during WWII. Under such circumstances, the British Treasury faced persistent difficulties in maintaining external balance, requiring major devaluations of the sterling pound in 1931 and 1967 (Schenk Reference Schenk2010). Historians of colonial development argue that CD&W disbursements were sensitive to U.K. BoP fluctuations: in surplus years, fiscal space permitted higher imperial spending; in deficit years, nonessential expenditures—including CD&W issues—were cut to prioritize debt service (Abbott Reference Abbott1970, 1226; Havinden and Meredith Reference Havinden and Meredith1993, 222; Little and Clifford Reference Little and Clifford1965, 241; Morgan Reference Morgan1980b, 84; Tomlinson Reference Tomlinson2003, 421). Building on this insight, I exploit BoP fluctuations as shocks to the timing of aid disbursements.
Specifically, I model observed aid received by each colony—the “aid issues” analyzed in Table 1—as the interaction between aid commitments and the U.K. BoP. Commitments represent expected funds to approved projects, from which issues were subsequently disbursed.Footnote 15 Because commitments resulted from a multistage evaluation process involving the Colonial Office, the Treasury, and annual parliamentary approval (see the “The Workings of Imperial Aid” subsection), they were relatively inelastic to short-term macroeconomic oscillations in the United Kingdom. By contrast, BoP fluctuations were driven by external shocks that were orthogonal to colony-level characteristics. The interaction between commitments (colony-specific and predetermined) and BoP shocks (common and time-varying) generates exogenous variation in realized aid at the colony–year level. This strategy isolates fluctuations in issues attributable to metropolitan financial constraints rather than colonial fiscal performance.
To implement this test, I digitized annual CD&W commitments, expressed as per capita work-day equivalents (the same scale as the outcome variable), for all 12 African territories. The data are drawn from the Annual Reports of the Advisory Committee of Colonial Development, 1929–39 and the Annual Returns of Schemes, 1941–69. Footnote 16
Figure 3a plots the evolution of the U.K. BoP, which fluctuated around zero except for a pronounced negative shock during WWII. For Figures 3b and 3c, I construct an indicator equal to one in BoP surplus years and zero otherwise. Figure 3b compares committed funds across surplus and deficit years. Commitments are modestly higher in surplus years, but the difference is not statistically significant (
$ t=1.08 $
 ), consistent with the slow-moving process of project evaluation and parliamentary approval. By contrast, aid issues are highly responsive to metropolitan financial conditions. As shown in Figure 3c, disbursements are approximately twice as large in surplus years relative to deficit years
$ (t=4.10). $
 Comparing scales across figures reveals a clear pattern: in surplus years, realized issues closely tracked commitments—as expected. In deficit years, disbursements contracted sharply relative to commitments. Appendix J of the Supplementary Material shows that this surplus–deficit discontinuity holds within colonies, indicating that fiscal retrenchment was broad-based rather than strategically targeted across territories.
U.K. Balance of Payments and Imperial Aid
Note: WWII years are shaded in gray in panel (a). Panels (b) and (c) use data for 12 colonies in Sub-Saharan Africa. For presentation purposes, the BoP is dichotomized in panels (b) and (c), whereas the statistical analysis employs the continuous measure. BoP and GDP data for 1929–47 are from Feinstein (Reference Feinstein1976); data for 1948–69 are from the Office of National Statistics (https://www.ons.gov.uk/economy/nationalaccounts/balanceofpayments/timeseries/aa6h/pb). 95% CI.

Figure 3. Long description
The image consists of three panels labeled a, b, and c.
Panel a, titled U K's B o P as a percentage of G D P, is a line graph. The x-axis represents years from 1930 to 1970. The y-axis represents Balance of Payments as a percentage of G D P, ranging from negative 15 to 5. A horizontal dashed line marks the zero point. The data line fluctuates near zero until 1939, then drops sharply to a trough of negative 12 around 1940. This period from 1939 to 1945 is shaded in gray. Post-1945, the line recovers, fluctuating between negative 2 and positive 3 through 1970.
Panel b, titled C D W Commitments (ttest equals 1.08), is a point plot with error bars. The x-axis is dichotomized as Balance of Payments in Surplus with values 0 and 1. The y-axis is Committed Grant-in-Aid from 1 to 2.5. At x equals 0, the point is at approximately 1.4 with a vertical error bar from 1 to 1.8. At x equals 1, the point is at approximately 1.75 with a vertical error bar from 1.25 to 2.25.
Panel c, titled C D W Issues (ttest equals 4.10), follows the same x-axis as panel b. The y-axis is Issued Grant-in-Aid from 0.5 to 2. At x equals 0, the point is at approximately 0.8 with an error bar from 0.55 to 1.05. At x equals 1, the point is significantly higher at approximately 1.6 with an error bar from 1.3 to 1.9.
Next, I instrument the CD&W issue variable in Equation 1 with an interaction between CD&W Commitment and U.K. BoP. Intuitively, the commitment variable measures the maximum volume of aid a colony could receive in any given year while the U.K. BoP adds exogenous variation to the funds actually transferred, or issued.Footnote 17 Formally, the first stage reads:

and the second stage remains:

with
$ {X}_{it} $
 denoting time-varying colony characteristics, and
$ \rho $
 and
$ \lambda $
 representing colony fixed effects in the first and second stages, respectively. Because the second stage includes a first lag of
$ {\mathrm{Tax}\ \mathrm{Revenue}}_{it} $
 , for identification purposes, I also include it in the first stage. The excluded instrument is
$ \operatorname{}{\mathrm{CDW}\ \mathrm{Commitment}}_{it}\times {\mathrm{U}.\mathrm{K}.\ \mathrm{BoP}}_t\operatorname{} $
 , while
$ {\mathrm{CDW}\ \mathrm{Commitment}}_{it} $
 and
$ {\mathrm{U}.\mathrm{K}.\ \mathrm{BoP}}_t $
 enter both stages to satisfy conditional exogeneity. This way, the instrument isolates variation in issued aid induced by U.K. financial constraints, holding constant commitments and BoP levels. Note that year fixed effects are collinear with the U.K. BoP variable and therefore cannot be included separately. To mitigate concerns about time-varying common changes in colonial policy, I include the Prime Minister fixed effects
$ \psi $
 and
$ \sigma $
 in the first and second stages, respectively. Inflation is accounted for by expressing all monetary variables in constant prices.
Results are reported in Table 2. The first-stage model (top panel) shows a positive relationship between committed and issued funds, indicating that commitments translate into larger disbursements, particularly in surplus years: that is,
$ {\widehat{\gamma}}_1>0 $
 and
$ {\widehat{\gamma}}_3>0 $
 , respectively. The F-statistic exceeds 12 in specifications with and without a WWII indicator variable (columns 1 and 2, respectively)—the latter accounting for the prolonged dip in the U.K. BoP during the war years.
Colonial Tax Revenue and Exogenous Shocks to Imperial Aid

Table 2. Long description
The table is divided into two vertical sections: First stage: C D W Issue and Second stage: Tax revenue.
First stage: C D W Issue
* C D W Commitment: 0.21 with standard error 0.05 (significant at p < 0.01) for both models 1 and 2.
* Balance of payments (B o P): -0.09 (p < 0.01) in model 1 and -0.06 (p < 0.1) in model 2.
* C D W Commitment multiplied by B o P: 0.03 with standard error 0.01 (p < 0.01) for both models.
* Observations: 386.
* R-squared: 0.67.
Second stage: Tax revenue
* C D W issue (hat): 0.46 with standard error 0.28 (p < 0.1) for both models.
* C D W Commitment: -0.01 with standard error 0.05 for both models.
* B o P: 0.06 in model 1 and 0.11 (p < 0.05) in model 2.
* Fixed effects and controls: Both models include First lag of D V, Colony F E, Colonial controls, and British P M F E. Model 2 additionally includes W W I I year.
* Wald F (Kleibergen-Paap): 12.51 for model 1 and 12.63 for model 2.
* Observations: 386.
* R-squared: 0.87.
Note: All monetary units are expressed in real per capita terms. Controls are: log of Population and Colonial Unrest. Refer to Appendix O of the Supplementary Material for the expanded version of the regression table. Robust coefficients in parenthesis. ***
$ p<0.01 $
 , **
$ p<0.05 $
 , and *
$ p<0.1 $
 .
In the bottom panel, the coefficient of interest,
$ {\widehat{\beta}}_1 $
 , is positive and statistically significant at the 90% level. The coefficient for the instrumented variable is stable across both specifications and is twice the size of the OLS coefficient in Table 1, suggesting a strong local average treatment effect. That is, sudden increases in aid flows during periods of sharp BoP fluctuations appear to have been matched by governors intensifying efforts to meet the program’s fiscal requirements.
In this analysis, the identifying assumption is that U.K. BoP shocks affect colonial taxation only through their effect on CD&W issues. This assumption would be violated if other time-varying factors correlated with both the U.K. BoP and colonial tax revenue. This design mitigates that concern in two ways: First, as explained earlier, the dependent variable in the second stage measures tax revenue net of trade taxes, which reduces the risk that global trade shocks simultaneously influence both the U.K.’s BoP and colonial taxation. Second, in the absence of year fixed effects (which are collinear with the BoP), the inclusion of Prime Minister fixed effects accounts for any time-varying unobserved propensity among British governments to be simultaneously reluctant to cut CD&W flows and lenient toward colonies that fail to meet the fiscal mandate.
Income Taxation as Fiscal Conduit
The expansion of colonial taxation under the CD&W program built on a long-standing fiscal rationale within British colonial administration. The tax revenue imperative had been a core feature of British colonialism (Young Reference Young1994). It manifested in “a pervasive hunger all along the chain of command from the central to the local state, leading to efforts to tax or impose fees on anything that moved” (Mamdani Reference Mamdani1996, 56). In the late colonial period, this imperative became tied to the developmental agenda.
Beginning in the interwar years, African colonies undertook a comprehensive restructuring of their tax systems. Reforms varied across territories, and multiple regimes could coexist within a single colony—for example, Nigeria’s federal structure permitted distinct tax systems in the North and South. Despite this variation, a common pattern emerged: renewed emphasis on direct taxation, particularly income and corporate taxes, under the authority of the colonial state.Footnote 18 Although trade and consumption taxes remained the principal revenue sources, income tax receipts tripled in British Africa between 1938 and 1951, rising from 9% to 27% of total tax revenue (Hailey Reference Hailey1957, 682; see Appendix C of the Supplementary Material).
Direct taxes on income and profits were paid primarily by European settlers and African merchants, and to a lesser extent by salaried workers employed in developmental projects. In practice, the late colonial tax system disproportionately targeted urban districts, where economic activity was monetized and legibility highest. Crucially, the African Studies Branch of the Colonial Office identified CD&W funding as one of the two principal motivations for expanding income taxation in the colonies—the other being post-WWII reconstruction (see Appendix C of the Supplementary Material).
Gains in fiscal capacity relied on several administrative innovations: new assessment and collection mechanisms targeting direct taxation (e.g., the stamp card, or kodi, for salaried workers); support from the Colonial Income Tax Office in London to curb corporate tax avoidance by British firms operating in the colonies (OD 1/1); and training programs for colonial officials at the Inland Revenue in London—responsible for direct taxes in the United Kingdom—sponsored by the CD&W program (OD 1/20). Appendix C of the Supplementary Material presents two case studies—Kenya and Nigeria—to illustrate both common patterns and territorial variation in tax reform. It also re-estimates the main models using direct taxation (featuring income and corporate taxes) as the dependent variable, showing that CD&W funds were a central driver of the expansion of modern taxation in late colonial Africa.
MAKING IMPERIAL AID WORK
The previous section showed that CD&W funds increased colonial taxation. This section argues that the fiscal mandate was met only after the Colonial Service introduced reforms that addressed delegation problems stemming from “hidden information” and “hidden action” (Gailmard Reference Gailmard2010). The former arises when agents hold private information about their characteristics—in this case, whether colonial officials genuinely shared the metropole’s developmental agenda. Preference or value alignment matters for mission success because it reduces monitoring costs and limits opportunistic behavior (Besley and Ghatak Reference Besley and Ghatak2018). Beginning in the interwar period, the Colonial Office introduced recruitment reforms designed to attract personnel to the Colonial Service on the basis of aptitude and ideological commitment to its developmental vision, including the fiscal mandate embedded in the CD&W program.
Hidden action concerns effort. Under conditions of information asymmetry between the metropole and colonial administrations, even value-aligned governors could shirk by relying on imperial transfers to finance development projects rather than mobilizing local revenue. Raising taxes was costly: it required tapping new sources of revenue and confronting social opposition to higher tax rates (Gardner Reference Gardner2012). To induce colonial officials to enforce tax collection despite these costs, the Colonial Office introduced reforms linking career advancement to observable outcomes, including tax mobilization under the CD&W program.
This section provides a historical account of the organizational reforms addressing hidden information and hidden action, in that order, and examines their effects on fiscal performance using variation in the career trajectories of colonial governors.
Recruitment into the Colonial Service
With the exception of the Indian Civil Service, by 1900, the Colonial Service had built a reputation for attracting “the human detritus of European imperialism with diverse and often unsavoury backgrounds [including] incompetence, unreliability, insubordination and brutality” (Berman Reference Berman1984, 179). This collection of misfits was ill-suited to an administrative system plagued by vast information asymmetries between London and the colonies. The problem became increasingly apparent after WWI: growing imperial competition among European powers and greater reliance on colonial economies called for a well-functioning Colonial Service working in unison with the metropole (Cohen Reference Cohen1958, 80–8). Yet communication with and within colonial territories remained limited, and reliable information about their geography and populations was scarce. These constraints, together with weak oversight mechanisms, prompted efforts to recruit a new type of colonial officer: qualified individuals prepared to confront increasingly complex technical and political challenges in the name of empire.
Organizational reforms accelerated after WWI and extended from junior officers to the apex of the Colonial Service: the governor. He was the “king-pin” in the relationship between the metropole and the dependent territory, personifying the Crown and exercising broad executive authority (Jeffries Reference Jeffries1956, 35). Governors held extensive powers over security, finance, and political affairs, and the position carried generous remuneration and considerable social prestige.
Governors were formally appointed by the Secretary of State for the Colonies, the head of the Colonial Office in London. Patronage appointments to governorships had long been common and were justified as part of a trust-based system (Xu Reference Xu2018). Only individuals with certain character, manners, and upbringing were considered suitable for such a powerful and lightly monitored office (Cain and Hopkins Reference Cain and Hopkins2016; Heussler Reference Heussler1963).
Patronage appointments to governorships were formally terminated in 1930 with the publication of the Warren Fisher Report—the “Magna Carta of the Colonial Service” (Jeffries Reference Jeffries1938, 55). Old practices were curtailed with the creation of a new personnel division within the Colonial Office staffed exclusively by career bureaucrats—not political appointees—who assumed responsibility for recruitment and promotion decisions (Kirk-Greene Reference Kirk-Greene2006, 31).Footnote 19 The new system bore fruit rapidly: within a decade, the vast majority of governors were career officers who had risen through the ranks rather than politically connected appointees (Lee Reference Lee1967, 138). Importantly, reforms at the top were said to trickle professionalism down the ranks of the Service (Kirk-Greene Reference Kirk-Greene2006, 32; Lee Reference Lee1967, 137).
At the junior level, the Warren Fisher Report consolidated recruitment practices initiated in the 1920s by Sir Ralph D. Furse, who had been tasked with modernizing the Colonial Service.Footnote 20 Aware of the deficit of competence within the organization, Furse prioritized recruiting a new generation of qualified officers and coordinated with University Appointment Boards to identify promising graduates from leading universities (Furse Reference Furse1962, 223).
To persuade top graduates to join, Furse worked to rebrand the Colonial Service as a respectable career. He lobbied governors to improve salaries and living conditions in the colonies, including tax exemptions, benefits, and generous leave policies (Kirk-Greene Reference Kirk-Greene2006, 32; Furse Reference Furse1962, 220). Recruitment campaigns targeted universities and major publications, portraying colonial administration as a prestigious profession (Kirk-Greene Reference Kirk-Greene2006, 35–6). Furse’s ultimate goal was to match the Colonial Service to “the high status enjoined by the Indian Colonial Service in the public mind” (Kirk-Greene Reference Kirk-Greene2006, 43).
By 1945, more than two-thirds of new recruits joined straight from university (Gardiner Reference Gardiner1998, 41). Motivations also appeared to shift in the direction intended by reformers. A survey of 580 former colonial administrators conducted by Her Majesty’s Overseas Civil Service (HMOCS) between 1983 and 1995 suggests that imperial goals ranked high. Among 22 reasons cited for joining the Colonial Service, “Service to Empire” and “Help Colonial Subjects” ranked fourth and fifth, respectively, preceded only by “Family Tradition,” “Military Service Experience,” and the job being “Interesting.” By contrast, material motivations ranked far lower: “Pay/Conditions” and “Poor Job Prospects in the UK” ranked 14th and 19th, respectively (Gardiner Reference Gardiner1998, 91).
While self-selection and scouting played an important role in screening recruits, the Colonial Office also sought to socialize new officers into the organization’s meritocratic culture and developmental mission through mandatory training courses (Stockwell Reference Stockwell2018). Beginning in 1926, recruits attended the Tropical African Administrative Services course at Oxford and Cambridge, which offered training in administration, African languages, such as Hausa and Swahili, and colonial history (Rowe Reference Rowe1970). The Devonshire Report of 1946 later extended postgraduate training from six months to two years—one year of coursework in the United Kingdom followed by a probationary year in the field (Lee Reference Lee1967, 45–7). The probationary period allowed the Colonial Office to correct “mistakes of selection [
$ \dots $
 ] by weeding out misfits at the end of the preliminary course, apprentice tour, and second course” (CO 198: p. 46).
In sum, the recruitment reforms initiated in the 1920s aimed to attract a new type of colonial officer: qualified individuals willing to advance a broader set of imperial policy goals that, in a major break with the past, included CD&W services for local populations. These reforms should mitigate the problem of hidden information by increasing the likelihood that colonial officials shared the metropole’s developmental priorities and therefore complied with the fiscal mandate of the CD&W program.
The Effect of Recruitment Reforms
To test whether recruitment reforms mitigated hidden information problems, I exploit longitudinal changes in gubernatorial recruitment policy.Footnote 21 Given governors’ substantial authority over their subordinates, I expect their commitment to the CD&W initiative to be instrumental in meeting the fiscal mandate. I use two strategies to identify the governor’s alignment with the developmental mission, or “type.” First, following Xu (Reference Xu2018), I differentiate between governors appointed before and after the publication of the Warren Fisher Report in 1930.Footnote 22 Those appointed before 1930 assumed office under the old patronage system, whereas those appointed after 1930 underwent an independent evaluation of their record and aptitude. I expect the new recruitment system to screen in governor candidates with proven commitment to London’s new agenda for the colonies, including the CD&W program and its fiscal mandate.
I hand-coded the career trajectories of the 80 governors who served in African colonies between 1929 and 1969 using Kirk-Greene’s (Reference Kirk-Greene1980a; Reference Kirk-Greene1980b) biographical compendium.Footnote 23 I divide governors into two groups—Warren Fisher versus Patronage appointees—based on the starting date of their first governorship ever. Because the CD&W initiative was launched in 1929, only a fraction of governors assumed their first governorship before 1930: 13% of the colony–year sample. With that caveat in mind, I estimate the following interaction model:

where
$ {X}_{i,t} $
 denotes the same time-varying colony-level controls as in previous models;
$ {W}_g $
 governor-level controls; and
$ {\rho}_i $
 and
$ {\delta}_t $
 colony and year fixed effects, respectively. I expect
$ {\beta}_3>0 $
 if the Warren Fisher reform screened mission-aligned types into colonial governorships. The before–after divide may correlate with other differences: younger governors might have received a better education and had less time to assume a governorship by 1930 (implying that younger governors might be particularly high performing). To account for this possibility, I control separately for the governor’s date of birth (DOB) and for the year of entry into the Colonial Service.
Xu (Reference Xu2018) provides strong causal evidence that the Warren Fisher Reform effectively ended nepotism in the Colonial Service. However, such problems may have persisted, at least temporarily, beyond 1930. Connected officials could have been assigned to colonies with higher tax potential; another possibility is that connectedness allowed governors to exert less effort, as had historically occurred both in the Colonial Service and in other bureaucracies.Footnote 24 If such personal ties existed and are not accounted for, I risk attributing to recruitment reforms (and later, effort-inducing policies) causal effects that actually follow underlying patterns of favoritism.
To address this concern, I measure personal connections between each governor and their two direct superiors at the Colonial Office: the Secretary of State for the Colonies—a political appointee at the apex of the Colonial Office—and the Permanent Undersecretary of State for the Colonies—the highest-ranking civil servant, directly beneath the Secretary in the Colonial Office hierarchy (Jeffries Reference Jeffries1956, Appendix II). For each governor, secretary, and undersecretary, I code where they attended public school (i.e., primary and secondary education), which university they graduated from (and which college they belonged to, if they attended Oxford or Cambridge), and their graduation dates.Footnote 25 These graduation dates allow me to determine whether individuals overlapped at university.
I also consider a second channel of connection: membership in the same companion orders, which may have inclined Colonial Office superiors to be more lenient toward governors, whether due to camaraderie or reputational concerns. Following Kirk-Greene (Reference Kirk-Greene1980b, 27–30), I focus on three orders commonly awarded to governors: the Order of St. Michael and St. George, the Order of the British Empire, and the Royal Victorian Order. For each governor, I record the date at which they were elevated to knighthood or grand knighthood in any of these orders and determine whether their superiors held the same distinction at that time. Crucially, these companion-order dyads are time-varying, as they change with turnover in any of these offices.Footnote 26
Finally, I include a time-varying indicator for whether the governor had been knighted, regardless of whether his superiors had received the same distinction. Knighted governors may have been assigned to colonies with higher tax potential or evaluated less rigorously given their elevated status.
The top panel of Table 3 shows differences between Warren Fisher and Patronage appointees in meeting the fiscal mandate of the CD&W program, and Figure 4a plots marginal effects drawn from column 1. The effect of imperial aid on tax revenue is not statistically different from zero in the presence of a patronage governor, but it is positive and different from zero when the colony is under the command of a governor appointed following the Warren Fisher Report. Models in the top panel of Table 3 are largely robust, with one exception: when a new-era governor overlapped at the same university with the Permanent Undersecretary of State, the effect of the interaction coefficient dissipates (column 4). Importantly, this null result does not recur in other models that include the Same University control.
Fiscal Performance and Recruitment Path

Table 3 Long description
The table is divided into two vertical blocks, each containing seven numbered columns.
Top Block: Warren Fisher Recruitment Analysis
* C D W grant issue times Warren Fisher: Coefficients range from 0.235 to 0.591, with most significant at the p < 0.05 or p < 0.01 levels. Standard errors are approximately 0.18 to 0.23.
* C D W grant issue: Negative coefficients ranging from -0.005 to -0.344.
* Warren Fisher: Positive coefficients ranging from 0.485 to 0.650.
* Controls: D O B is ‘Yes’ for all except column 2. Date of entry is ‘Yes’ only for column 2. Specific connection dummies (Same public school, university, college, order, or Governor knight) are ‘Yes’ only in their respective columns 3 through 7.
* Fixed Effects: Lag of D V, Colony F E, and Year F E are ‘Yes’ across all columns.
* Statistics: 379 observations per column. R-squared values are consistently around 0.888.
Bottom Block: Career Officer Recruitment Analysis
* C D W grant issue times career officer: Coefficients are stable around 0.602 to 0.634, all significant at p < 0.05.
* C D W grant issue: Negative coefficients ranging from -0.376 to -0.404.
* Career officer: Small negative or near-zero coefficients ranging from -0.067 to 0.007.
* Controls and Fixed Effects: The distribution of ‘Yes’ and ‘No’ for D O B, Date of entry, educational/social connections, and fixed effects matches the top block exactly.
* Statistics: 379 observations per column.
Note: These models examine whether the governor’s recruitment method impacted the fiscal performance of the CD&W program. Warren Fisher = 1 if the governor’s first-ever appointment dates after 1930, 0 otherwise. Career Officer = 1 if the governor entered the civil service as a cadet, 0 otherwise. Colony-level controls: log of Population and Colonial Unrest. Governor-level controls: D.O.B. (date of birth) and Date of Entry (date of first appointment into the colonial service). Connections: Each of the four connection rows includes two dummy variables: one for the governor–Secretary of State pair, another for the governor–Permanent Undersecretary of State pair. These equal 1 if both individuals attended (and overlapped at) the same educational institution or were members of the same companion order; 0 otherwise. Refer to Appendix O of the Supplementary Material for the expanded version of the regression table. Robust standard errors in parentheses. ***
$ p<0.01 $
 , **
$ p<0.05 $
 , and *
$ p<0.1 $
 .
Fiscal Performance and Recruitment Path: Marginal Effects
Note: Figures show the marginal effects based on columns 1 and 8 in Table 3, respectively. 90% CI. A governor is appointed by meritocratic criteria (patronage) if he assumes his first gubernatorial office after (before) the 1930 Warren Fisher Report. A governor is a career officer if he joined the Colonial Service as a cadet; he is not a career officer if he was recruited from the private sector, military, or Colonial Office (the latter is not part of the Colonial Service).

Figure 4. Long description
Two side-by-side coefficient plots with identical y-axes ranging from negative 1 to 0.5, labeled Marginal Effect of C D W Issues on Tax Revenue. A horizontal dashed line marks the zero threshold.
Panel a, titled Appointment, compares two groups along the x-axis.
* Pre Warren Fisher. The point estimate is slightly below zero, approximately negative 0.2, with a wide 90% confidence interval extending from roughly negative 0.45 to 0.1.
* Post Warren Fisher. The point estimate is positive, approximately 0.25, with a narrower confidence interval ranging from 0.1 to 0.4.
Panel b, titled Background, compares two groups along the x-axis.
* Not a Career Officer. The point estimate is negative, approximately negative 0.4, with a very wide confidence interval extending from negative 0.9 to 0.1.
* Career Officer. The point estimate is positive, approximately 0.2, with a tight confidence interval ranging from 0.1 to 0.4.
A second strategy to identify governors’ alignment with the developmental mission relates to their professional background. After WWI, junior recruits joined the service through “open competition.” In addition to formal qualification requirements (e.g., a bachelor’s degree), candidates had to submit recommendation letters (often from ex-service members) and be interviewed by the Colonial Office. These interviews—originally conducted by Furse himself—were intended to select graduates who demonstrated academic merit and an affinity with the new developmental agenda for the colonies, precisely to mitigate agency problems. Following a successful interview, recruits spent two full years “in probation” (one receiving specific training at Oxford and Cambridge and another in the field), after which—conditional on a positive report—they became civil servants. Candidates under probation received the title “cadets.”Footnote 27 Almost two-thirds of the governors in the sample began their careers as cadets.
The path from cadet to governor was arduous. After the two-year probation (later extended to three), recruits were promoted to assistant district officer, then to district officer, (assistant) provincial commissioner, (deputy) chief secretary, and finally governor. On average, promotion from cadet to governor required 23 years within the ranks (with a sample maximum of 34 years) and often involved multiple international postings.
Governors who did not rise through the ranks of the Colonial Service were recruited from the military (particularly after WWII), the private sector (typically businessmen with experience in trade or mining), and the Colonial Office, a branch of the Civil Service rather than the Colonial Service. Compared with this eclectic group, I expect governors who entered the Service as cadets to have fully internalized the postwar colonial policy goals. Their prolonged field experience likely made them more adept at identifying priorities, communicating them to subordinates, and monitoring compliance. With respect to imperial aid in particular, I expect these “cadet-made-governors” to be more effective in meeting the CD&W fiscal mandate than noncareer officers, who may have assumed office lacking the necessary know-how, leadership skills, or shared interests.
I test this proposition by re-estimating Equation 4, this time using Career Officer as the moderator. Drawing from Kirk-Greene’s biographies, I establish whether African governors entered the Service as cadets and interact that variable with CD&W issues. Results are reported in the bottom panel of Table 3; for ease of interpretation, Figure 4b plots marginal effects drawn from column 8. Results suggest that the CD&W funds were more likely to expand colonial taxation in the presence of a career governor.
Overall, the findings in Table 3 are consistent with the proposed mechanism—namely, that a new generation of closely vetted colonial governors helped smooth agency problems between the metropole and the colony. Arguably, “Warren Fisher governors” and “cadet-made-governors” not only shared London’s agenda for the colonies but also possessed individual qualities that facilitated their promotion within the ranks and eventual appointment to a governorship (e.g., above-average competence). Although it is impossible to isolate the screening mechanism with observational data, next I examine how governors responded to performance incentives.
Performance Incentives within the Colonial Service
A second set of reforms addressed hidden action by strengthening performance incentives within the organization. Governors’ performance was closely monitored by the Colonial Office’s Staffing Division, which determined their tenure, reappointments, and promotions. Promotion to “higher-status” colonies constituted a key incentive because these postings offered greater salaries and pensions (Jeffries Reference Jeffries1949, 102). Yet only about one-third of governors were appointed to another colony after completing their first tour. Colonial postings were organized hierarchically, with a small group of “Class I” colonies at the top and lower-status territories offering fewer rewards. New governors were typically assigned to the poorest colonies or “Class IV,” and successful incumbents were transferred to wealthier ones (Meredith Reference Meredith1975, 494).
Because the Colonial Office could not directly observe governors’ decisions, promotion relied heavily on observable outcomes. Fiscal performance served this role and became a key determinant of gubernatorial reappointment and promotion after the Warren Fisher Report. Using causal inference methods, Xu (Reference Xu2018) shows that governors who increased tax revenues and enacted more tax ordinances were more likely to be promoted to higher-status colonies with greater salaries. Kirk-Greene further suggests that monitoring was even stricter in colonies receiving CD&W funds (Kirk-Greene Reference Kirk-Greene2000, 227).
The interwar reforms also strengthened career incentives for junior officials. Reformers believed that the best way to induce performance was to provide a clear path for professional advancement within the Service. The Warren Fisher Report stated that promotion to higher ranks would occur “by selection on the sole basis of merit” (Cmnd.3554: p. 34), a major deviation from the centuries-old seniority rule (Bradley Reference Bradley1950, 17). The 1932 unification of colonial civil services, also recommended by the Warren Fisher Report, was a key step in this direction (Jeffries Reference Jeffries1938). Before unification, colonial administrations operated largely as siloed organizations with distinct traditions and limited mobility across territories. The unification of more than 35 colonial administrations (including the prestigious Indian, Malayan, and Sudanese Civil Services) expanded career opportunities and standardized promotion criteria (Jeffries Reference Jeffries1972, 13).
Compensation reforms reinforced these incentives. The Warren Fisher Report recommended a long incremental salary scale and the introduction of an “efficiency bar” to reward sustained performance, offering officials the prospect of attaining a reasonably high salary conditional on efficient service (Cmnd. 3554: p. 33). The efficiency bar was formalized in Appointments in Her Majesty’s Colonial Service, the Colonial Office’s annual publication detailing conditions of service, promotion, and transfers (Colonial Office, 1954: Sec. 8, par. 8).
While gubernatorial performance was assessed by the Colonial Office, the evaluation of colonial officials rested primarily with governors, who earned from their subordinates the nickname “the stick of H[is] M[ajesty]” (Jeffries Reference Jeffries1949, 102). Governors submitted annual confidential reports on senior officers to the Colonial Office, and promotion within or across colonies required their recommendation.Footnote 28 Although the Staffing Division retained final authority over promotions and raises, information asymmetries meant that these decisions relied heavily on such reports (Jeffries Reference Jeffries1956, 145–6).Footnote 29
By the end of the interwar period, the Colonial Service had been transformed into a hierarchical, meritocratic organization in which governors controlled recommendations for promotion and salary increases and thus wielded substantial leverage over subordinate officials. Because fiscal performance shaped their own advancement prospects, governors had strong incentives to emphasize revenue targets and ensure that these were met. A biographical account illustrates this dynamic. Recalling his arrival as a cadet in Northern Rhodesia, Harry Franklin (Reference Franklin1974, 37) recounts the instruction given by his District Commissioner: “The only [duty] that matters, if you want promotion, is tax-collection. The more tax you collect the higher the governor will rate you.”
The Effect of Performance Incentives
I examine the role of performance-based incentives by leveraging two pivotal moments in a governor’s career—reappointment and retirement. Governorships conferred quasi-absolute powers, professional and social prestige, and emoluments more generous than those attached to most civil service positions in the metropole. First-time governors were typically assigned to a Class IV colony. The Colonial Office assessed their performance in this initial post to decide whether to promote them to a higher-status colony upon reappointment. If successful, further governorships often followed—up to four in some cases. The critical step was securing the first reappointment.Footnote 30
Beyond future earnings and enhanced social standing, reappointment significantly increased the likelihood of securing a governor’s pension, which was generous by the standards of the time. To qualify, the individual needed to serve 10 years as governor (later reduced to 3) and reach the age of 60 (later reduced to 55). Failing to meet either criterion meant that pension benefits were calculated based on the last position held before the governorship—typically, a substantial pecuniary loss. This rule created strong incentives to secure a second governorship. Nicolson and Hughes (Reference Nicolson and Hughes1975, 95) note that the “peculiar nature” of pension eligibility “put a premium on getting a second governorship.”
Building on this observation, I therefore expect first-time governors to be particularly effective in meeting the fiscal mandate of the CD&W program. By mobilizing local revenue to support imperial aid—an observable outcome—first-time governors could signal their value to the Colonial Office and improve their chances of reappointment. I test this proposition by estimating the specification in Equation 4, using a dummy variable equal to 1 as the moderator if the colony is governed by a first-time appointee.
Results are reported in the top panel of Table 4, where I control for the governor’s DOB, entry date into the Service, connectedness variables, and the governor’s social status (proxied by knighthood). For ease of interpretation, marginal effects drawn from column 1 are plotted in Figure 5a. The sign and magnitude of
$ {\widehat{\beta}}_3 $
 remain stable across specifications, suggesting that personal connections did not systematically affect governor assignment or evaluation. Notably, the interaction coefficient increases when governor fixed effects are introduced in column 8, indicating that governors exerted greater effort in their first assignment than in subsequent ones. Overall, the results in the top panel of Table 4 support the theoretical mechanism: in the presence of performance-based promotion incentives, CD&W funds were more likely to expand colonial taxation.
Fiscal Performance and Career Incentives

Table 4. Long description
The table is divided into two main sections.
Top Section (Models 1 to 8):
- C D W issue times First governorship: Coefficients range from 0.289 to 0.693, all statistically significant at the 0.01 or 0.05 levels.
- C D W issue: Coefficients are negative, ranging from minus 0.059 to minus 0.380, none statistically significant.
- First governorship: Coefficients range from minus 0.032 to 0.115.
- Controls: All models include First lag of D V, Colony controls, Colony F E, and Year F E. Model 8 includes Governor F E.
- Observations: 379 for models 1 to 7; 377 for model 8.
- R-squared: Approximately 0.888 to 0.931.
Bottom Section (Models 9 to 15):
- C D W issued: Coefficients range from 0.436 to 0.540, all significant at the 0.01 level.
- C D W issued times Age qualification met: Coefficients range from minus 1.468 to minus 1.805, significant at the 0.05 or 0.1 levels.
- Age qualification met: Coefficients range from minus 0.046 to minus 0.319.
- Controls: All models include Tenure requirement met, Lag of D V, Governor F E, and Year F E. Model 15 includes Colony F E.
- Observations: 154 for all models.
- R-squared: Approximately 0.965 to 0.973.
Note: Robust standard errors are provided in parentheses below coefficients. Significance levels are indicated by asterisks: three for p less than 0.01, two for p less than 0.05, and one for p less than 0.1.
Note: These models examine whether the governor’s career incentives impacted the fiscal performance of the CD&W program. First Governorship equals 1 if the governor is serving his first-ever governorship; 0 otherwise. Age Requirement Met = 1 if the governor meets the minimum age to qualify for retirement pension; 0 otherwise. Tenure Requirement Met = 1 if the governor meets the minimum number of years in office to qualify for retirement pension; 0 otherwise. Colony-level controls: log of Population and Colonial Unrest. Governor-level controls: D.O.B. (Date of Birth); Date of Entry = date of first appointment into the Colonial Service regardless of rank. These two variables are excluded from columns 9–15 as they are time-invariant and collinear with governor fixed effects. Connections: Each of the four connection rows includes two dummy variables: one for the governor–Secretary of State pair and another for the governor–Permanent Undersecretary of State pair. These equal 1 if both individuals attended (and overlapped at) the same educational institution or were members of the same companion order; 0 otherwise. Refer to Appendix O of the Supplementary Material for the expanded version of the regression table. Robust standard errors in parentheses. ***
$ p<0.01 $
 , **
$ p<0.05 $
 , and *
$ p<0.1 $
 .
Fiscal Performance and Career Incentives: Marginal Effects
Note: Figures show the marginal effects based on columns 1 and 9 in Table 4, respectively. 90% CI. The scale of the left-hand figure has been adjusted to match that of the right-hand figure, which may make the effects appear smaller than they are. First Governorship = 1 if the colony is under the command of a first-time governor, 0 otherwise. Age qualification met = 1 if the governor meets the minimum age to qualify for a retirement pension, 0 otherwise. Governors qualify if they are at least 60 years old (or 55 after 1947). All governors in panel (b) meet the tenure requirement.

Figure 5. Long description
Two coefficient plots arranged horizontally. Both share a Y-axis labeled Marginal Effect of C D W Issues on Tax Revenue, with a scale from negative 3 to 1 and a dashed horizontal reference line at 0.
Panel a, titled Seeking First Reappointment, has an X-axis with two categories.
* Seasoned Governor: The point estimate is slightly below 0 with a narrow 90% C I error bar crossing the 0 line.
* First-Time Governor: The point estimate is slightly above 0 with a narrow 90% C I error bar that does not cross the 0 line.
Panel b, titled Before forward slash After Pension Qualification, has an X-axis with two categories.
* Does not meet yet age qualification for pension: The point estimate is approximately 0.5 with a narrow 90% C I error bar above the 0 line.
* Already meets age qualification for pension: The point estimate is approximately negative 1.1 with a very wide 90% C I error bar extending from approximately 0.3 down to negative 2.5.
For most office holders, the governorship was the final post before retirement (Kirk-Greene Reference Kirk-Greene1980b, 26). Governors’ retirement pensions were regulated by special legislation: to qualify, they were required to complete 10 years in office—referred to as the tenure requirement. For career officers, this threshold was reduced to three years in 1935. If a governor failed to meet the tenure requirement, his pension was calculated based on the rank (or profession) held prior to assuming gubernatorial office. Anecdotal evidence suggests that governors with military backgrounds actively sought reappointment in order to secure the substantially more generous pension associated with the governorship. Some, like Sir Gordon Guggisberg, pursued this goal despite serious health issues, ultimately dying just months short of meeting the 10-year requirement (Kirk-Greene Reference Kirk-Greene, Gann and Duignan1979, 217).
To offer a second test of performance-based incentives, I focus on governors who had already met the tenure requirement and exploit the discontinuity created by the minimum age threshold for pension eligibility. If incentives operate as theorized, one would expect greater effort toward fulfilling the CD&W fiscal mandate by tenured governors before they reached age 60 (or 55 after 1947), compared to afterward. Once both criteria for pension eligibility were satisfied, the Colonial Office lacked further means (or “carrots”) to elicit gubernatorial effort.
For this test, I restrict the sample to governors who had met the tenure requirement (
$ N $
 = 154 country–years). Within this subset, roughly one quarter of governors had also reached the minimum age requirement, suggesting that remaining in office beyond retirement age was uncommon—likely due to health issues in the tropics, as noted in numerous autobiographies.
Results are reported in the bottom panel of Table 4. I begin with a model that includes year and governor fixed effects, thereby leveraging within-governor variation over time, and then add the connection controls stepwise. In the final specification (column 15), I include colony fixed effects. These models estimate the average effect of imperial aid on taxation for tenured governors, both before and after they reach the minimum retirement age. Figure 5b summarizes the main finding: while tenured governors remained below the retirement age threshold, an inflow of CD&W funds was associated with a positive increase in local taxation—similar in magnitude to the effects reported in Table 1. However, once they crossed the age threshold, the coefficient turns negative and is borderline statistically significant.
In short, once governors became fully eligible for their pensions, they appeared to scale back their efforts to meet the fiscal mandate of the CD&W program. Looking back, it seems likely that those who stayed in office beyond retirement age were not commissioned to prioritize development goals. The alternative explanation—that the Colonial Office did not anticipate or care about this drop in effort—would point to an oversight on the part of the metropole.
Hidden Action and Information Asymmetries
The previous test examined the importance of making the governor’s career advancement incentive-compatible with the fiscal mandate of the program. Here, I turn to the root of the hidden action problem between the Colonial Office and the governor: the former could not directly observe the governor’s actions or decisions—only outcomes. Aware of this limitation, governors may have exploited informational gaps to shirk effort.
Five of the Permanent Undersecretaries of State who served during the CD&W program had prior field experience in the colonies (by contrast, only one Secretary of State for the Colonies did). Some had served in Africa as members of the Colonial Service (Maffey, Macpherson, and Poynton), others in the King’s African Rifles (Parkinson), or in other colonies without self-government (Wilson). Field experience may have made them better equipped to monitor gubernatorial performance. With first-hand knowledge of the challenges of colonial administration, they may have been better able to distinguish between a genuine explanation and an excuse for fiscal underperformance. By the same token, governors may have been less inclined to shirk when their supervisors had field experience and were therefore harder to mislead.
Appendix M of the Supplementary Material explores variation in this source of information asymmetry by estimating the effect of imperial aid on tax revenue conditional on whether the Permanent Undersecretary of State had prior field experience. Results suggest that the association between CD&W funds and tax revenue was indeed stronger when the Colonial Office was headed by an Undersecretary with field experience. While these results are not causally identified—for instance, the appointment of a particular type of Undersecretary may have been endogenous to fiscal conditions in the metropole—they are consistent with the presence of hidden action problems at the core of imperial aid delivery.
CONCLUSION
This article shows that imperial aid expanded fiscal capacity in late colonial Africa. It did so because organizational reforms in the Colonial Service aligned bureaucratic incentives with the program’s fiscal mandate. By screening officials whose preferences matched the developmental goals and tying career advancement to observable fiscal outcomes, the Colonial Office transformed tax mobilization into an incentive-compatible strategy for colonial administrators. The evidence indicates that imperial funds increased colonial taxation and that this effect was mediated by reforms to recruitment and promotion within the Service.
The apparent success of the CD&W program in strengthening fiscal performance in colonies under empire raises two broader questions: first, did these reforms leave lasting institutional legacies; and second, why did the CD&W program not avert independence? Whether the tax mobilization achieved in the final decades of imperial rule persisted after independence depends on whether the capacities built during that period—namely, personnel qualification and performance incentives—also endured. There are reasons to expect that compliance with the CD&W fiscal mandate laid foundations for postindependence fiscal capacity. Improvements in tax enforcement made previously untapped pockets of wealth more legible to the state, while the gradual “Africanization” of the civil service in the final years of colonial rule likely facilitated the transmission of administrative knowledge to local bureaucrats.Footnote 31 Institutional persistence may also have operated through the many British officials who remained in post after independence, often at the request of newly independent governments (Seidler Reference Seidler2018).
Although the small cross-sectional sample (
$ N $
 = 12) limits formal analysis of persistence, Figures 6a and 6b display positive bivariate correlations between total CD&W funds received during colonial rule and postindependence mean and cumulative taxation. Importantly, the “Allocation Criteria” subsection shows that aid was not systematically allocated to colonies with higher ex ante fiscal capacity, reducing concerns that these correlations simply reflect pre-existing differences. While these figures should be interpreted cautiously, they are consistent with the view that colonial fiscal reforms created bureaucratic organizations that outlived empire and warrant further systematic investigation.
CD&W Funds and Postindependence Fiscal Performance
Note: All series are normalized by local wages and population. Post-colonial fiscal performance is measured using means and logged totals between the last independence in the sample—Swaziland, 1968—and 1990, the end of the Cold War. Refer to Appendix N of the Supplementary Material for shorter and longer intervals.

Figure 6. Long description
This two-panel scatter plot compares colonial funding to post-independence fiscal outcomes.
Panel a, titled Mean Tax After Independence, features an x-axis for Total C D W Funds (Logged) ranging from 1 to 5 and a y-axis for Average Tax Revenue ranging from 0 to 40. A dashed line representing fitted values shows a positive linear trend starting at approximately y equals 12 and ending near y equals 21. Data points include Gold Coast and Northern Rhodesia at the higher end of tax revenue for lower fund levels, while Swaziland and Bechuanaland are at the higher end for both axes. Nigeria and Uganda are positioned near the bottom of the y-axis.
Panel b, titled Total Tax After Independence, features the same x-axis but a y-axis for Total Tax Revenue (Logged) ranging from 4.5 to 6.5. The dashed fitted values line shows a similar positive slope. Swaziland and Northern Rhodesia appear as high outliers in tax revenue. Nigeria and Uganda remain at the bottom of the distribution. Other countries plotted across both panels include Kenya, Tanganyika, Nyasaland, Sierra Leone, Basutoland, and Gambia.
Legends in both panels identify the open circles as tax performance data and the dashed lines as fitted values.
A second question raised by this analysis is why the CD&W program did not avert independence. From a purely accounting perspective, imperial aid contributed to building more capable states and raising living standards: 64% of total CD&W spending was funded locally through improvements in tax technology and enforcement, and nearly 45% of those funds were allocated to welfare services. Yet these achievements did not necessarily resolve the central vulnerability of imperial governance: its deficit of political legitimacy among local populations (Berman et al. Reference Berman, Lake, Padró i Miquel, Yared, Lake and Berman2019; Lake Reference Lake2016). Even as official discourse in the final decades of empire acknowledged deprivation and abuse (Lee Reference Lee1967; Morgan Reference Morgan1980a), colonial rule continued to rely on coercion and discrimination (Kirk-Greene Reference Kirk-Greene1980a; Mamdani Reference Mamdani1996). Moreover, the expansion of interventionist administrative structures—growing from roughly 1,500 colonial service officials in 1900 to 18,000 by 1957—undermined the ideological foundations of indirect rule (Berman Reference Berman1984, 190–1). The resulting “second colonial occupation” (Low and Lonsdale Reference Low, Lonsdale and Low1976) further marginalized local populations within their own territories.
These contradictions were also apparent within the CD&W program itself. While conceived to promote prosperity and prepare colonies for self-government, it denied meaningful political agency to colonial subjects. London’s efforts to align bureaucratic preferences and elicit effort from colonial officials came at the expense of local participation in development decisions—the equivalent of “ownership” in contemporary aid terminology (Pomerantz Reference Pomerantz2024). The program’s “authoritarian paternalistic” character (Berman Reference Berman1984, 182) reinforced the illegitimacy of colonial governance and did not curb demands for self-determination (Cooper Reference Cooper1996). Ultimately, the implementation of the CD&W program reveals a central tension in imperial rule: bureaucratic reform and fiscal capacity can be strengthened through external intervention, but without political legitimacy such gains cannot secure the durability of empire.
ARCHIVAL RECORDS CONSULTED
Parliamentary Records
-
- HC, July 18, 1929. Considered in Committee: Colonial Development Bill, Vol. 230.
-
- HC, February 16, 1945. Floor Debate: Third Reading of the 1945 CD&W Bill, Vol. 408.
-
- HC, November 9, 1950. Floor Debate: Second Reading of the CD&W Bill of 1950, Vol 480.
-
- HC, March 25, 1959. Considered in Committee: Clause 1. Extension Of Provisions as the Schemes for Colonial Development and Welfare. Vol. 602.
Command Papers
-
- Cmd. 6713. Colonial and Welfare Act, 1945: Despatch dated November 12, 1945, from the Secretary of State for the Colonies to Colonial Governments. London: HM’s Stationary Office.
-
- Cmd. 9462. Colonial and Welfare Act, 1955: Despatch dated the April 26, 1955, from the Secretary of State for the Colonies to Colonial Governments. London: HM’s Stationary Office.
-
- Cmd. 672. Report on the Use of Funds, provided under the Colonial Development and Welfare Acts, and outline of the proposal for exchequer loans to the colonial territories, 1959. London: HM’s Stationary Office.
-
- Cmd. 3554. Report of a Committee on the System of Appointment in the Colonial Office & the Colonial Services, Presented by the Secretary of State for the Colonies to Parliament by Command of His Majesty, April 1930, London: HM’s Stationary Office.
Other Records
-
- OD 1/1. Establishment of Colonial Income Tax Office. 1941–42.
-
- OD 1/20. Students general: lists of students attending courses. Overseas Territories Income Tax Office. 1953–72.
-
- Report of a Conference of the Technique of Development Finance in British Colonial Territories, 1951, is enclosed in CO 1025/104, Finance Department, 1957–59, Colonial Development and Welfare: General Principles.
-
- Colonial Office. 1954. Appointments in Her Majesty’s Service. London: HM Stationary Office.
-
- CO 852/589/11, Colonial Development and Welfare Act: Allocation of Funds, 1944.
-
- CO No.198, Post-War Training for the Colonial Service. London: HM Stationary Office 1946.
-
- FO 371 67589: Report of the Conference of African governors, London, November 1947.
-
- CO 87/265/5: Application for a development grant to improve educational services, 1944–47.
-
- CO 877/27/1: Sir Ralph Furse’s “Memorandum for Post-War Training for Colonial Service,” 1943.
SUPPLEMENTARY MATERIAL
To view supplementary material for this article, please visit https://doi.org/10.1017/S0003055426101919.
DATA AVAILABILITY STATEMENT
Research documentation and data that support the findings of this study are openly available at the American Political Science Review Dataverse: https://doi.org/10.7910/DVN/A7K5LU.
ACKNOWLEDGEMENTS
I am grateful to the APSR Editor, Monika Nalepa, and two anonymous reviewers for their insightful and constructive suggestions. I also thank Kate Baldwin, Stephen Chaudoin, Alex Debs, Mark Dincecco, Zuhad Hai, Jessica Hickle, Maria Jose Hierro, Morten Jerven, Dan Mattingly, Gerard Padró i Miquel, Pia Raffler, Lorenzo de la Rosa, Ken Scheve, Christina Schneider, Emily Sellars, Theo Serlin, Marvin Suesse, Yuhua Wang, Yifan Zhou, and seminar participants at Duke, Harvard, Korea, MIT, Princeton, and Yale University and APSA 2025 and IPES 2025, for comments and suggestions. I thank Sarah Chok, Sam Dunham, Yulia Kuzmina, Kaixao Liu, Daevan Mangalmurti, and Laila Delpuppo Messari for excellent research assistance.
FUNDING STATEMENT
This research was funded by the MacMillan Center for International and Area Studies, Yale University.
CONFLICT OF INTEREST
The author declares no ethical issues or conflicts of interest in this research.
ETHICAL STANDARDS
The author affirms this research did not involve human participants.


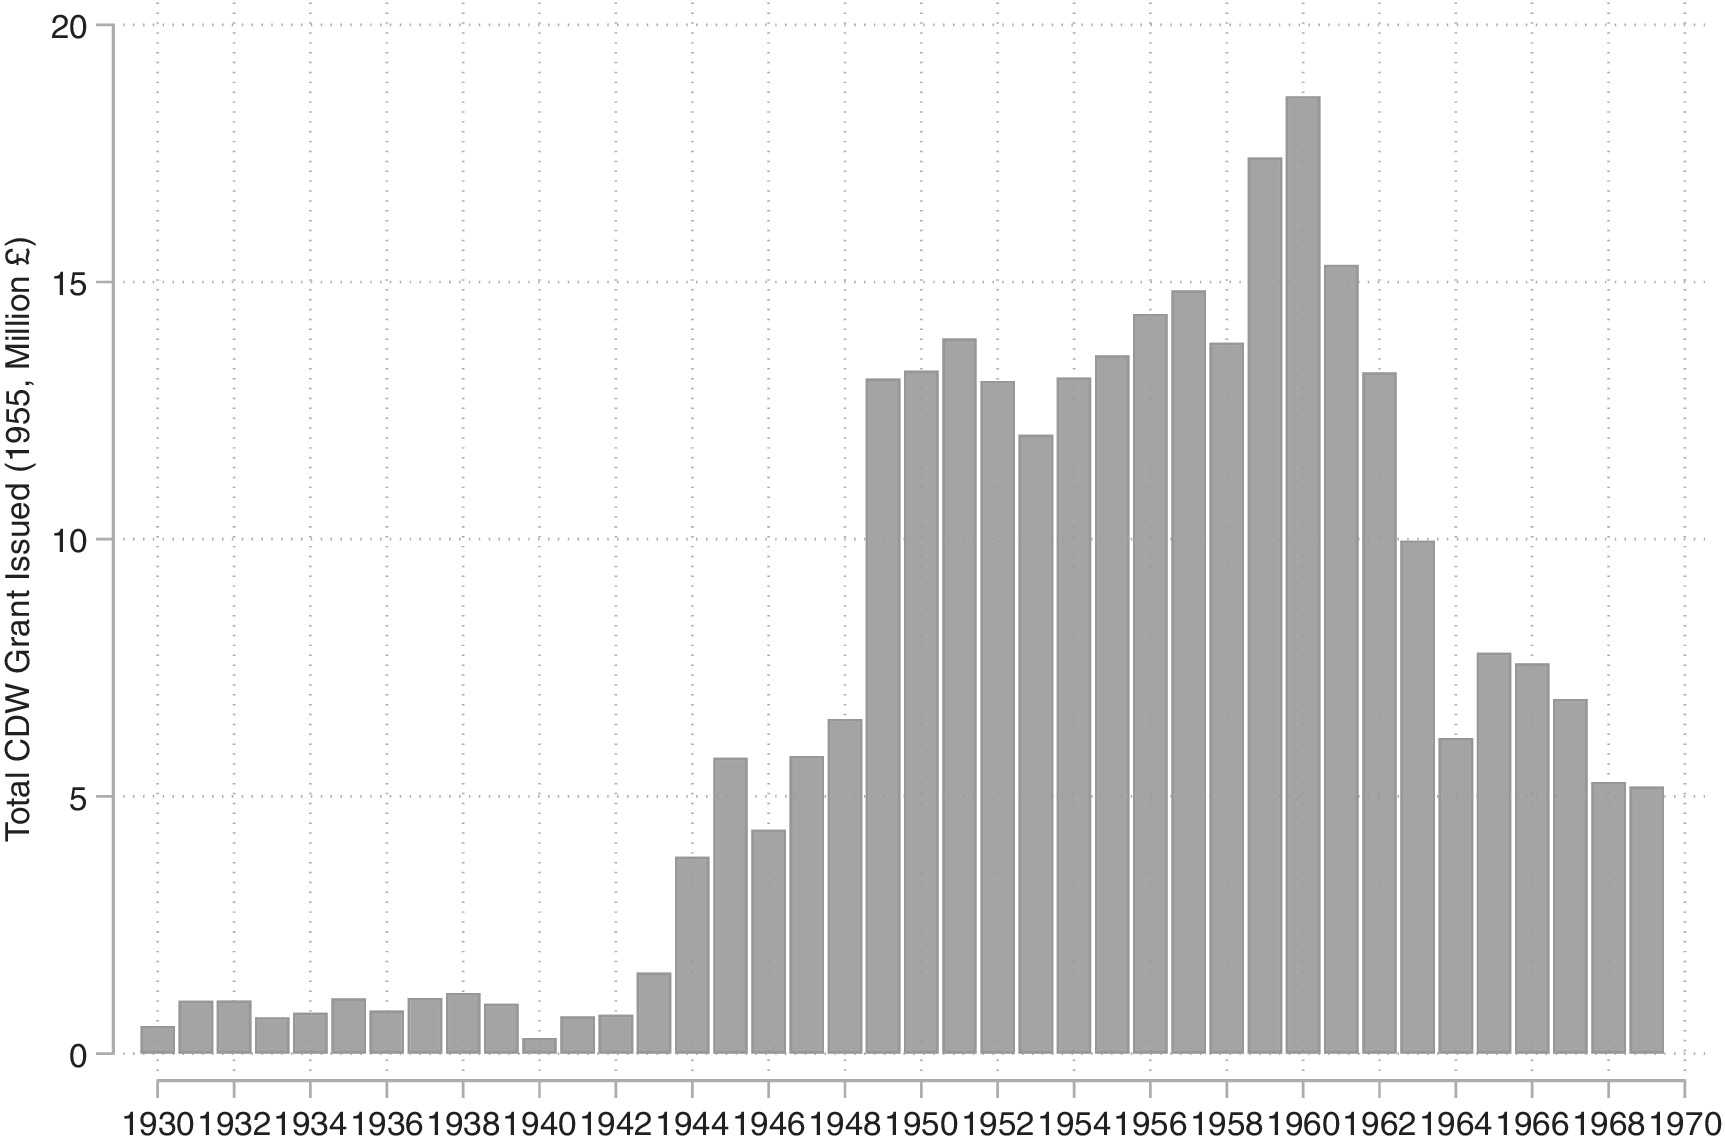
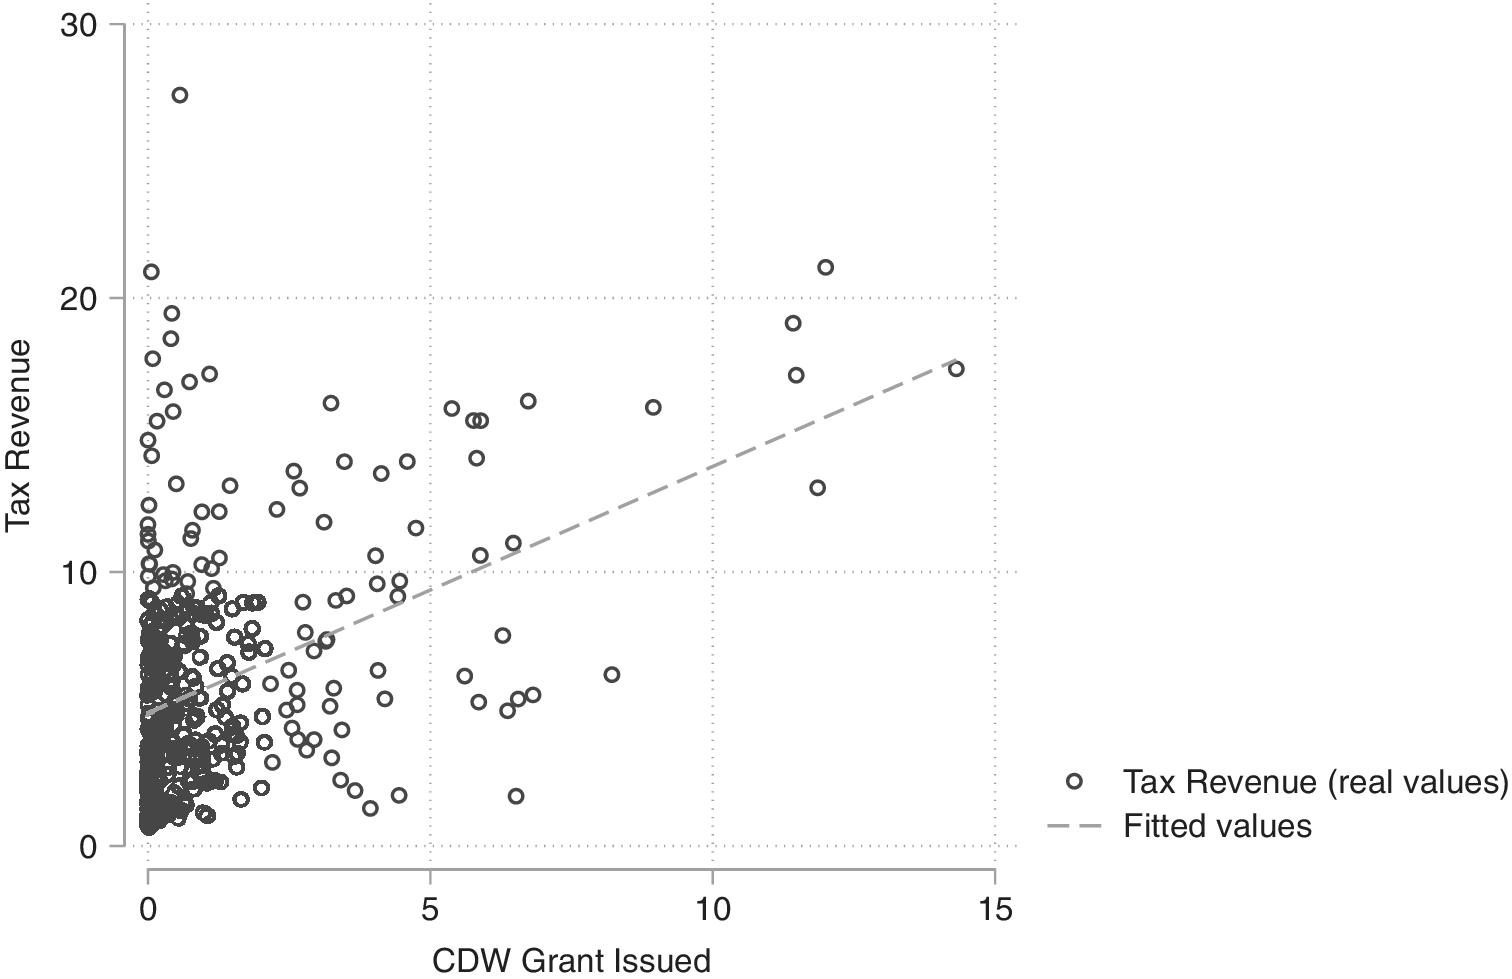
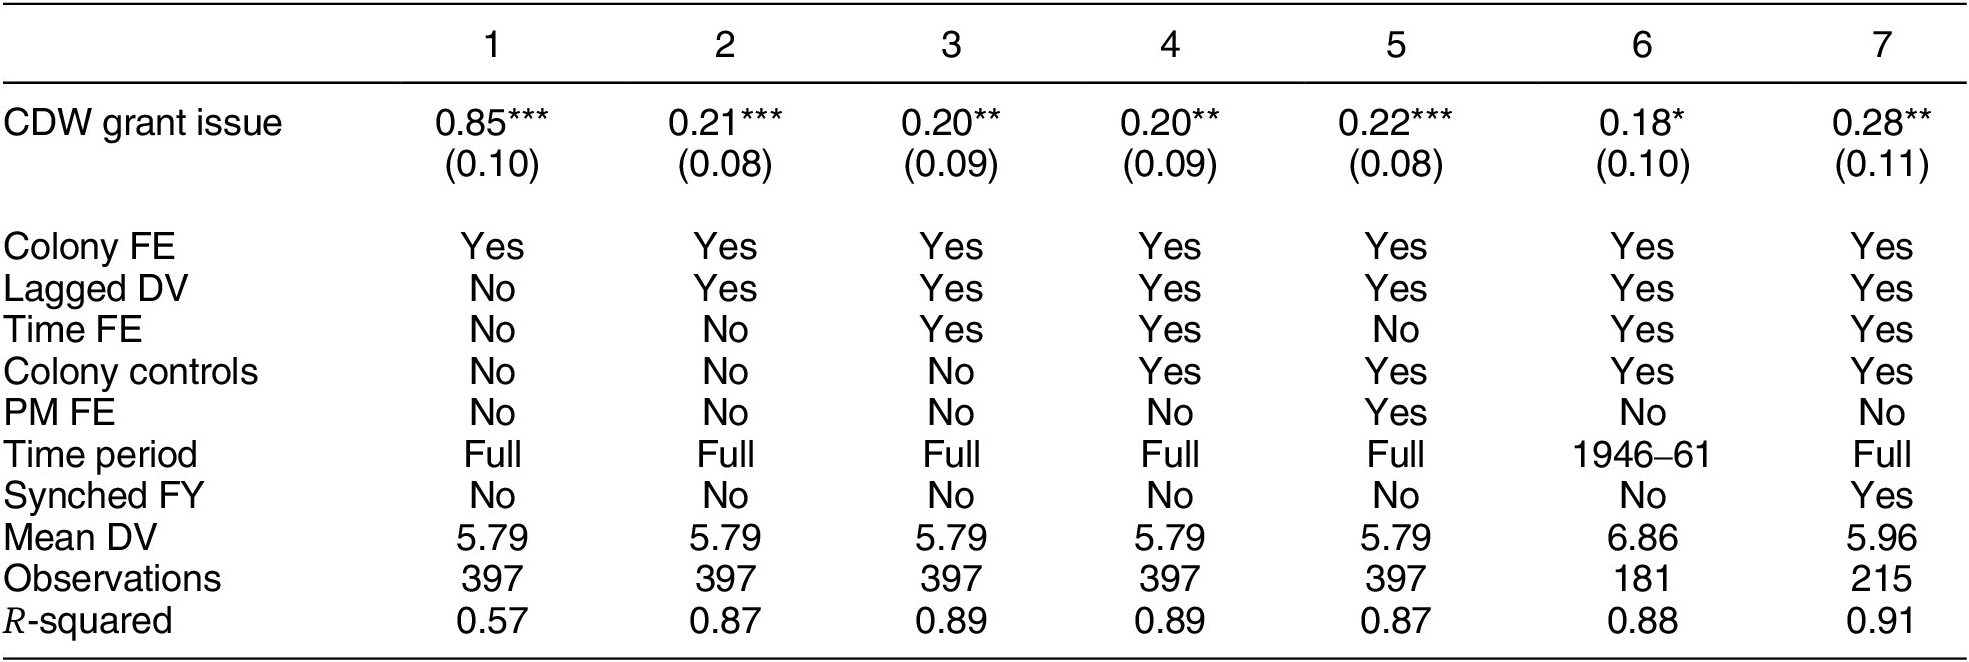
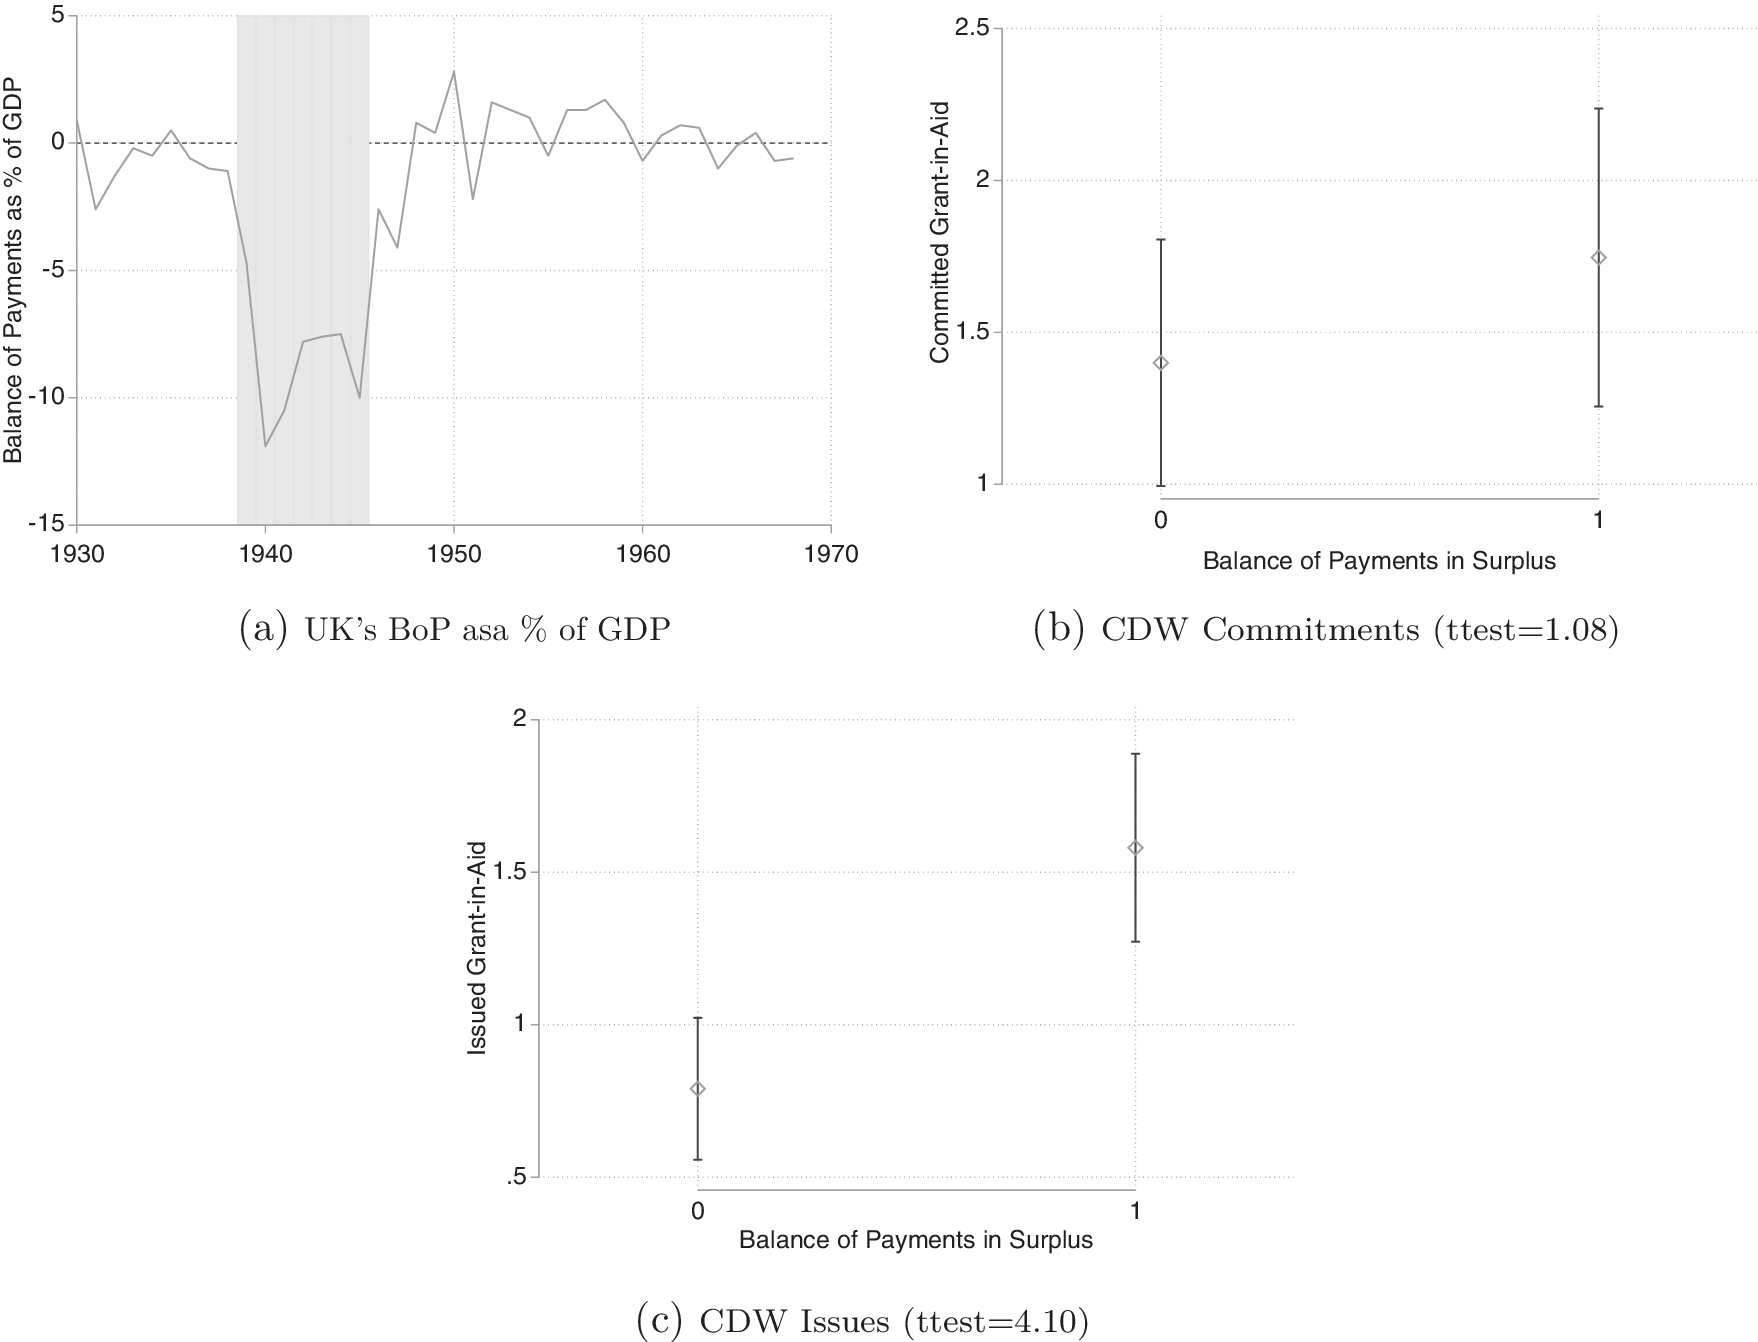
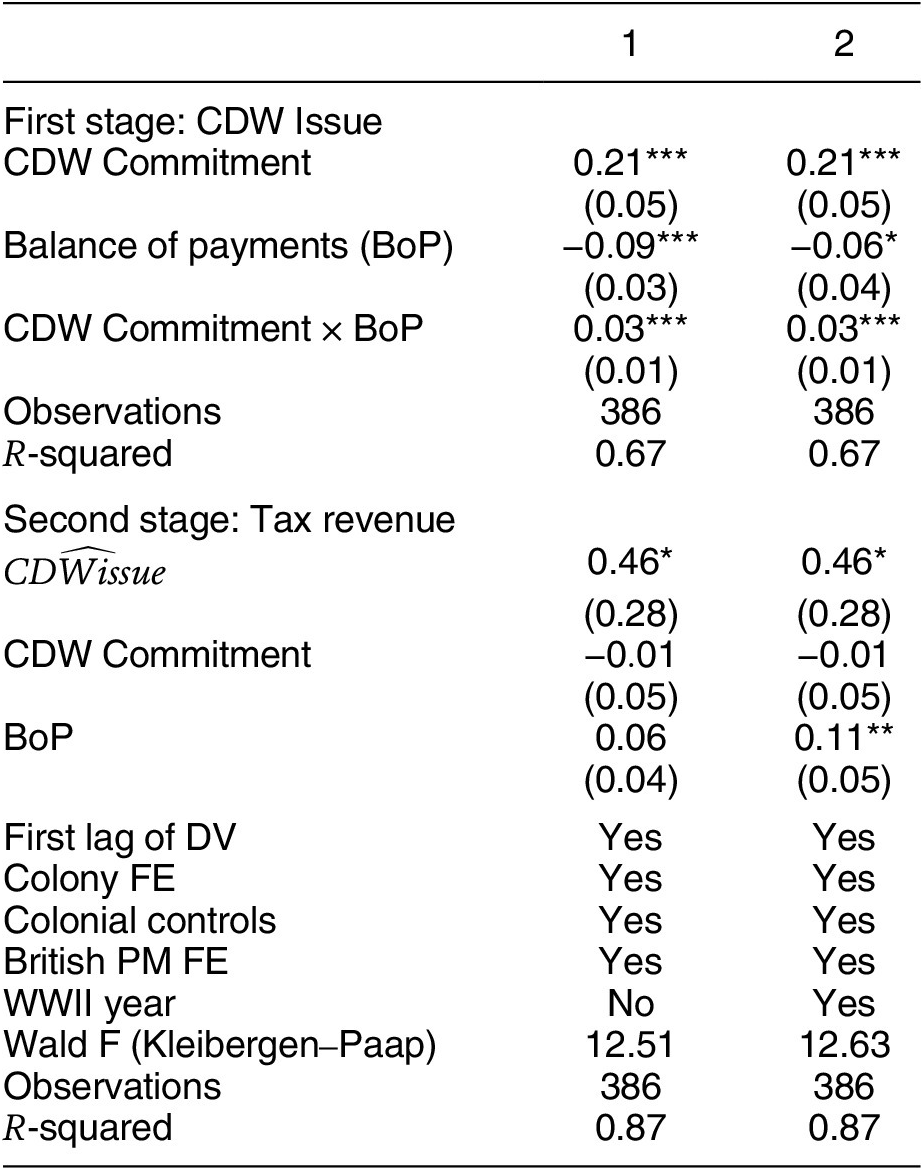
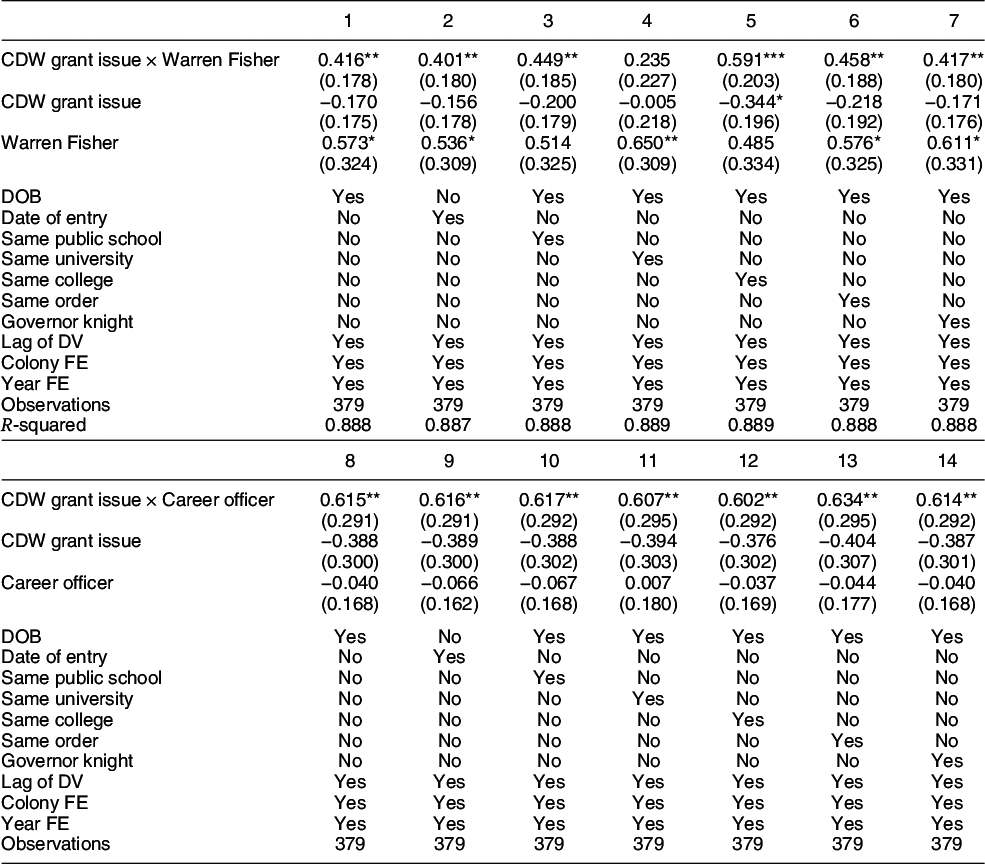
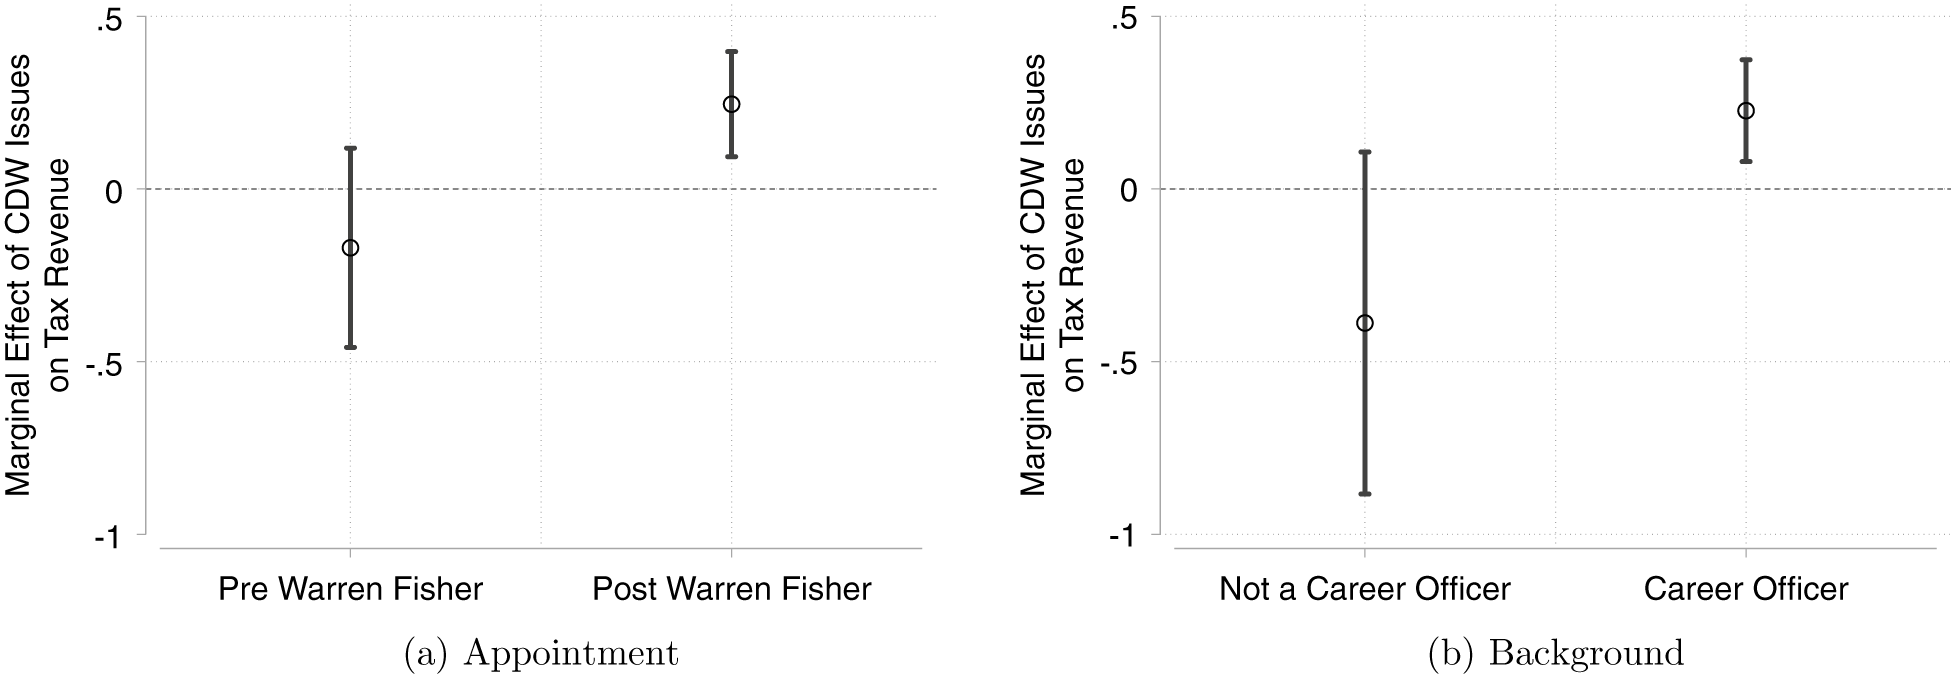

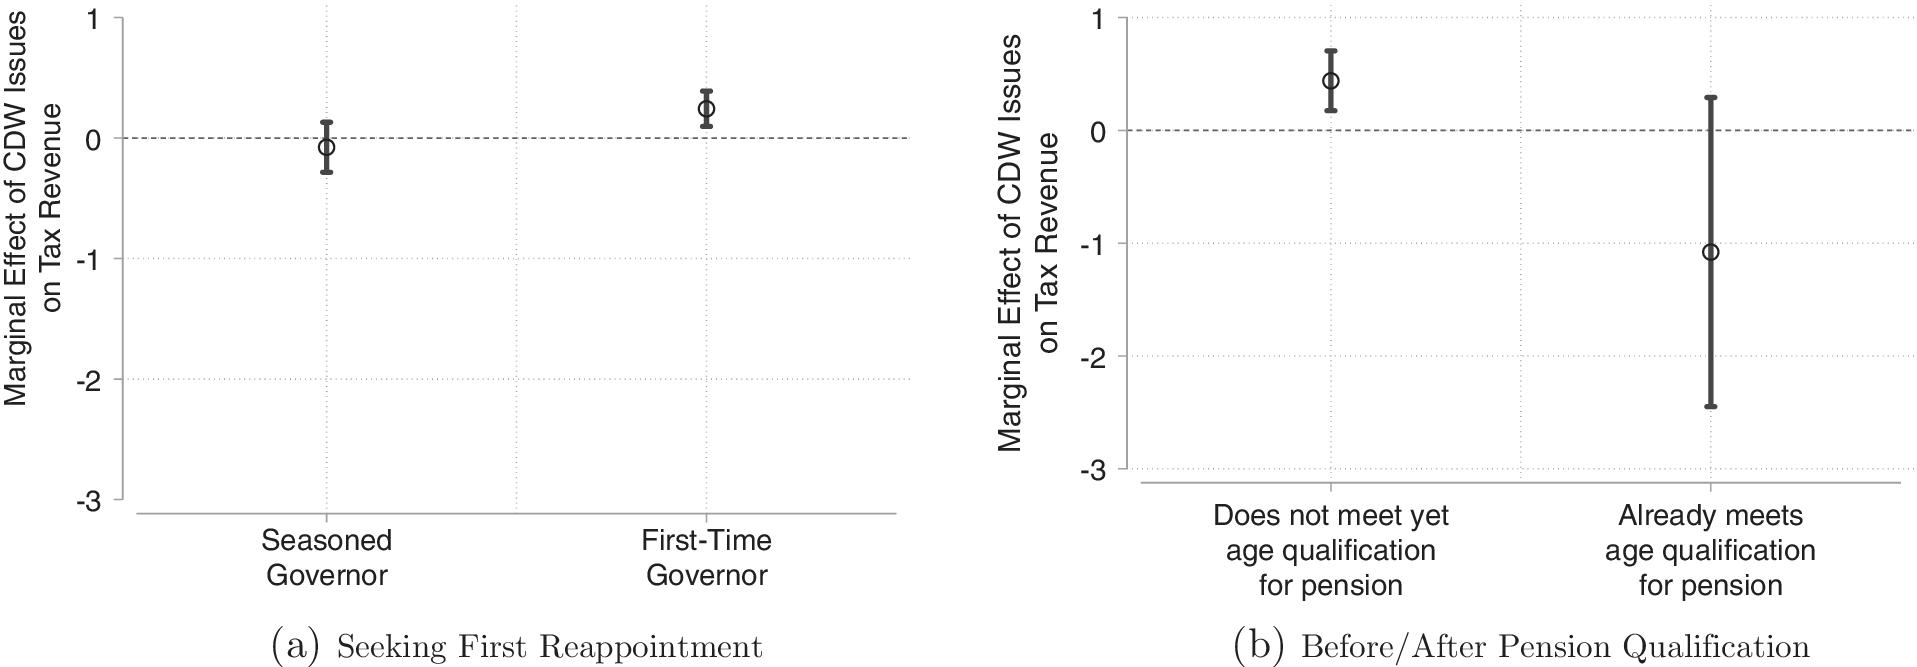
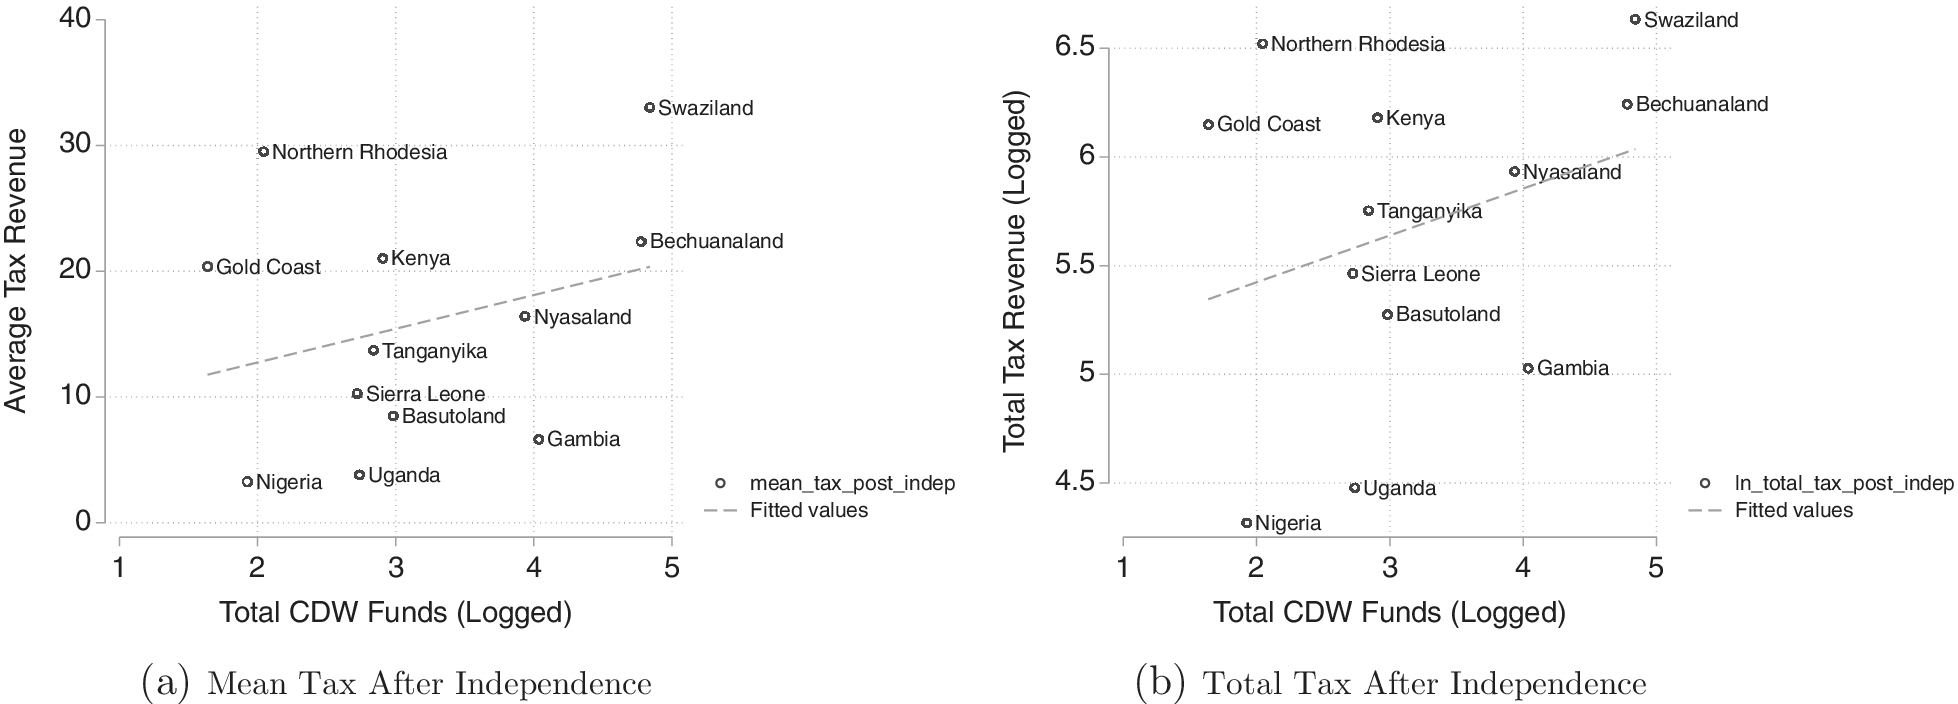


 Open access


Comments
No Comments have been published for this article.