Scholars have long suggested that learning-by-producing plays an important role in the creation of new technical knowledge.1
The term “learning-by-doing” has meanings in many different contexts. For instance, it is applicable to learning arising from both production and invention. In this article, I use the term “learning-by-producing” when there is a learning effect associated with production of commodities in the industry of interest, rather than production of machinery used to make them. For example, learning-by-producing in the shoe and textile industries refers to learning through the production of shoes and textiles. Similarly, in the electrical industry, learning-by-producing denotes learning through the production of electrical equipment and supplies. (The electrical manufacturers are producers of both capital goods and consumer goods.) This definition is narrower than the sense scholars such as Thomson (Path) adopt. In Path, Thomson suggests that shoe machinery firms (capital goods-producers) learned from shoe manufacturers (capital goods-users), and he names this process “learning-by-selling.” Also, see Arrow, “Economic Implication”; and Alchian, “Reliability,” for the theory of learning-by-doing; and Keller, “International Technology Diffusion,” for other learning mechanisms.
Although few studies explicitly discuss the impact of production clustering, or learning-by-producing, on invention, many studies have treated experience at production as a source of invention and innovation, and thereby, the catalyst for technological change. For example, Smith, Wealth, p. 9, argued: “A great part of the machines … were originally the inventions of common workmen, who being each of them employed in some very simple operation, naturally turned their thoughts towards finding out easier and readier methods of performing it.” Also, see Young, “Learning” and “Invention”; and Irwin and Klenow, “Learning-by-Doing.”
These factors have been highlighted by several studies such as Jaffe, Trajtenberg, and Henderson, “Geographic Localization”; Saxenian, Regional Advantage; Feldman and Florida, “Geographic Sources”; Audretsch and Feldman, “R&D Spillovers”; and Arora, Fosfuri, and Gambardella, “Specialized Technology Suppliers.” As regards to the concentration of industrial production, see Krugman, Geography; Kim, “Expansion”; and Dumais, Ellison, and Glaeser, “Geographic Concentration.”
Few studies in the economics of technology investigate links between the location of invention and the location of production. They pay little attention to the possibility that there may be a geographic divorce between these activities. Information on the location of production is often simply employed to control for the effects of concentration in production on the clustering of invention.4
Lamoreaux and Sokoloff, “Geography,” is an exception. They attribute market institutions that facilitated trade in patented technology or that helped mobilize capital to invest in inventive activity as the causes of the geographic divergence between production and invention in the American glass industry. Although intriguing, the study focuses on a single industry and does not probe deeply into other factors, for example, inventor skills that might help explain such geographic divergence.
Given the recent surge of outsourcing in manufacturing and the growing attention to invention and innovation in international policy circles, this article evaluates the learning-by-producing hypothesis by examining the geographic association between invention and production. I study the historical experience of three intriguingly contrasting American industries: two of them traditionally labor-intensive industries, one whose production migrated to a low wage area (textiles) and one which did not (shoes); as well as an industry based on a radically new technology (electrical equipment and supplies).5
In this article, electrical equipment and supplies, and hence the electrical industry, refers to electrical machinery, electric transmission, and distribution, as well as electric wiring and lighting.
I find a weak geographic association between invention and production in both high-tech (electrical equipment and supplies) and low-tech (shoes and textiles) industries throughout this period. Regional shifts in production capacity were not followed by corresponding changes in the patterns of patenting. A significant number of inventors, even in the craft-based shoe industry, were distinguished by their industry-appropriate advanced technical skills instead of direct involvement in production. The location of invention appears to have mirrored the geographic distribution of individuals with such skills. These findings suggest that learning-by-producing was less central in accounting for the geographic differences in inventive activity than generally thought. Rather, the evidence highlights the significance of appropriate technical skills or human capital amongst the population.
EMPIRICAL STRATEGIES
Evaluating the Learning-by-Producing Hypothesis
One way of investigating the learning-by-producing hypothesis is to examine the correlation between the geographic clustering of invention and production. Following previous studies on invention and technological progress that use patent statistics to gauge inventive activity, we test the learning-by-producing hypothesis by comparing the shares of patents and the shares of manufacturing employment across regions.6
See Schmookler, Inventions and Patents; and Sokoloff, “Inventive Activity.”
Nonetheless, there are problems in using this test to evaluate the effect of learning-by-producing on the location of invention. First, patent statistics do not fully reflect inventive activity. Moreover, discoveries associated with learning-by-producing might be innovations, or new applications of existing technical knowledge, rather than inventions, and thereby not patentable. Zvi Griliches, however, argues that patent statistics provide a reasonable, if not powerful, indicator of inventive activity.7
See Griliches, “Patent Statistics.”
Patent statistics may not fully reflect inventive activity in industries that rely on other mechanisms to protect investment in inventive activity, for example, secrecy. This is not a major issue for this article. Unlike industries such as food and chemicals, the three industries selected often employ patent rights to protect their invention. Even if there were some secrecy involved, it is not likely that these practices vary across regions.
In addition to questions about the usefulness of patent statistics in measuring inventive activity, the test may not be sufficient even if the regional distributions of patents and of labor force (production) closely resemble each other. Two problems still arise in disentangling the impact of learning-by-producing on the location of invention. One comes from indirect causation. The observed geographic association between invention and production may not result from learning-by-producing. Instead, resources crucial to both manufacturing and inventive activities may cause the two activities to co-locate. For example, inventive activity may be carried out by individuals working in a capital good sector (such as a textile machinery firm) that locates in proximity to production because of high transportation costs. To address this issue, we can examine biographical characteristics of inventors, for instance, their job description and the organization they belong to. Thus, we can establish whether they are directly involved in production and have benefited from learning-by-producing, or they work for the capital good sector. The other problem in gauging the impact of learning-by-producing is caused by circular causation.9
See Myrdal, Economic Theory.
Another way to deal with the circular causation problem is to examine the change in inventive activity of industries whose centers of production are relocated to new areas. Such a case allows us to focus on the impact of production shifts on the location of invention.
Consequently, we need to enhance comparison of regional distributions of patents and labor force with investigation of biographical information on inventors before concluding that the location of production had a strong impact on the location of invention. Such evidence can also help us identify other factors strongly influencing the location of invention.11
Distribution of inventor's skills may tell us the type of knowledge crucial to carry out inventive activity and the extent to which the reliance on such knowledge influences the location of invention.
U.S. Census Bureau, Measuring America.
Different industrial policies and patent regimes may matter. Khan, Democratization; and Lo, “Strengthening,” illustrate how patent regimes affect inventive activity.
Period and Industries Chosen for the Study
The Second Industrial Revolution was a golden era of scientific and technological breakthroughs. Benefiting from these discoveries, new industries such as electrical machinery and lighting, automobiles, and modern chemicals were established, and even old industries were transformed. The new technologies were much more capital intensive and based on scientific knowledge, and they also induced radical changes in the organization of enterprises.14
See Chandler, Visible Hand; and Lamoreaux, Great Merger.
The three industries examined offer three intriguing contrasts. Shoe and textile production were among the most important manufacturing industries of the First Industrial Revolution. By the late 19th century, both were mature or maturing industries in terms of technology and production.15
Both industries were still based on the mechanical technologies introduced and elaborated during the early and mid-nineteenth century; and technological change was largely of an incremental character for the remainder of the century. Their shares of manufacturing production, moreover, dropped by more than half, whether measured by output or by value added. (See the Census of Manufactures for output; and Temin, “Manufacturing” for value added.)
See Hekman, “Product Cycle”; Wright, “Cheap Labor”; and Kane, Textiles.
DATA
I construct cross-sections of patent records consisting of all shoe, textile, and electrical patents granted by the USPTO in 1870, 1890, and 1910.17
Utility and reissued patents are in the sample, but not design patents because design patents protect the appearance of the patented articles and often overlap with copyrights. From U.S. Patent and Trademark Office, Technology Assessment, the number of utility patents granted by the USPTO was 12,157 in 1870, 25,322 in 1890, and 35,168 in 1910. In contrast, for the three cross-section years combined, there were only 2,262 design patents and 646 reissued patents. (These statistics include a small number of patents that were later revoked.)
See U.S. Technical Committee on Industrial Classification, Standard Industrial Classification for more details on the electrical industry classification.
The USPTO patent classification system is of limited use in selecting only patents intended for the shoe and textile industries, because it is based on functional use. For example, both a bobbin and a reel for fishing rods are classified under class 242: winding, tensioning, or guiding.19
U.S. Patent and Trademark Office, “Patent Classification.”
Among the information collected for each patent is: name and address of patentees and their assignees (individuals or firms who purchased ownership of the inventions before the dates that the patents were granted); and the nature of the assignment (such as whether the patentees retained a stake in the invention after the assignment). For each patentee, I have also retrieved the total number of patents awarded to him over the seven year period centered on the year of the sampled patents.20
For example, the seven year period for a patentee in the 1870 cross-section is from 1867 to 1873.
To explore in detail the biographies of these patentees (inventors) and whether they were directly associated with production, additional information was collected on the patentees from both the U.S. Decennial Census of Population manuscripts, 1850–1880 and 1900–1930; and various city directories.21
Most of the 1890 census manuscripts were destroyed by fire in 1921.
See Appendix 2 for notes on missing inventor biographical information; and Sutthiphisal, “Geography,” appendix A for more details on the samples.
THE GEOGRAPHY OF SHOE AND TEXTILE INVENTION
The Location of Production and the Location of Invention
To probe whether learning-by-producing meant that the location of production in the shoe and textile industries influenced location of invention, I begin with comparing the regional shares of patents to those of manufacturing employment. If learning-by-producing led to a geographic association between production and invention, each region's share of patents in an industry would be roughly similar to that of its share of the industry's labor force.
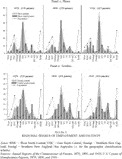
The results presented in Figure 1 seem at first to suggest that the location of invention was closely related to the location of production in the shoe and textile industries. In general, shares of patenting corresponded to shares of employment. A closer look at the patterns across regions, however, reveals that shares of patents in some regions, such as Massachusetts and the South, significantly deviated from their shares of employment in both the shoe and the textile industries.

FIGURE 1 REGIONAL SHARES OF EMPLOYMENT AND PATENTS
During the first half of the nineteenth century, textile production was concentrated in Massachusetts, Southern New England, and the Middle Atlantic. In the 1880s textile production began to relocate from the Northeast, especially Massachusetts, to the lower-wage South. The share of textile employment in Massachusetts dropped from 29 to 22 percent, while the share of employment in the South share nearly quadrupled from 5 to 19 percent during the period from 1870 to 1910. Strikingly, the pronounced regional shift in production did not result in much of an increase in textile invention in the South. The region's share of patenting in textiles remained very low in relative terms, with its textile patent share in 1910 only about one-third of the share of employment. In stark contrast, not only did Massachusetts maintain its leadership in textile technology after the relocation, but its lead grew even larger. The textile patent share of Massachusetts rose to 42 percent, nearly twice its employment share in 1910.
Patenting and employment in the shoe industry showed similar regional patterns. Shoe production remained highly concentrated in Massachusetts throughout the nineteenth century. Between 1870 and 1910, the generation of new technological knowledge in shoes grew ever more concentrated, while the region's shares of employment were roughly stable. Massachusetts accounted for 56 percent of all shoe patents in 1910, though it employed only 42 percent of the workers in the industry. On the other hand, shoe patenting declined in areas where shoe employment expanded, such as Northern New England and the West North Central regions.
The absence of a corresponding increase in the South's share of invention in textiles after the relocation of production, as well as Massachusetts' ever-larger lead in shoe and textile invention without any increase in its production shares, are neither trivial in quantitative significance nor statistical outliers. These regions were major centers of invention or production. The divergent patterns of invention and production raise the question of whether learning-by-producing was an important contributor to the geographic clustering of invention in shoes and textiles. Moreover, even in regions where the shares of patents were comparable to those of employment, one cannot infer a direct causal association between production and invention arising from learning-by-producing.
The Identity of Inventors
To better understand the relationship between the geographic patterns of invention and production, and the impact of learning-by-producing, we can explore whether inventors in these traditional manufacturing industries were directly linked to production, as well as learn about their work experience, technical skills and productivity at invention (defined as number of patents an inventor received over a seven year period). If the location of production had a strong influence on the location of invention, a large proportion of patents in the industry in question would be awarded to inventors whose jobs or occupations seemed connected to production.
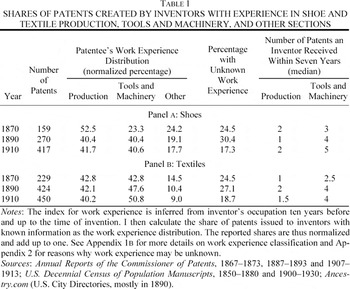
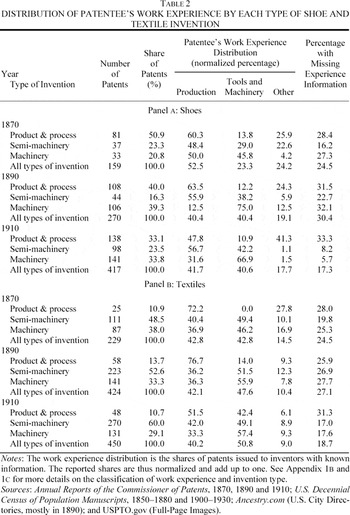
Estimates of the number of patents received by inventors with various types of work experience are reported in Table 1. Two types of inventors generated most patents in shoes and textiles: those who had worked in the production of goods in their respective industries, and those who had worked in the tool and machinery sector. In neither of the mature industries did individuals with experience in production dominate in the generation of new knowledge. Only about 40 percent of the patents were awarded to people involved in production. Moreover, even in product and process related inventions (inventions where we would expect production involvement by potential inventors to be crucial), by 1910 only half went to inventors with production experience (as shown in Table 2).


Furthermore, shoe and textile inventors with experience in tools and machinery were generally more productive, on average receiving significantly more patents within a seven year period than did those with production experience.23
The seven year period chosen is, to some extent, arbitrary. Nevertheless, the results are unlikely to alter if we change time length. Also, this statistic should fairly reflect the productivity of each inventor at invention in the respective shoe and textile industries even though it may include inventions in other industries. Few inventors in the sample generated crossover inventions in other industries.
U.S. Decennial Census of Population Manuscripts, 1880 and 1900–1930; and LexisNexis, U.S. Patents.
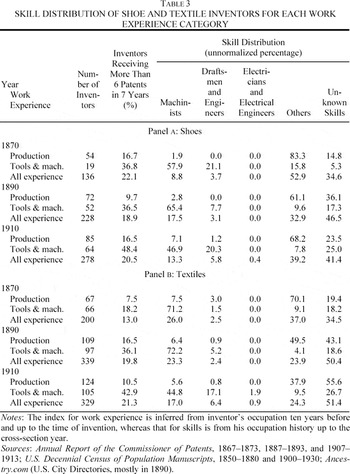
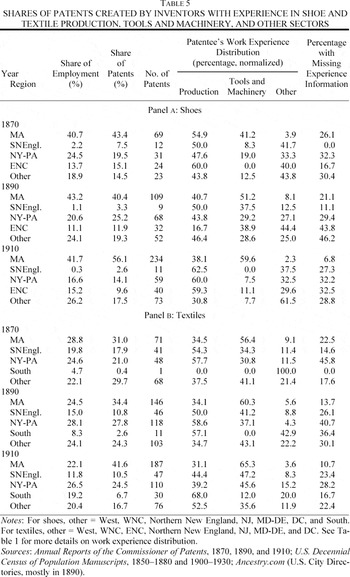
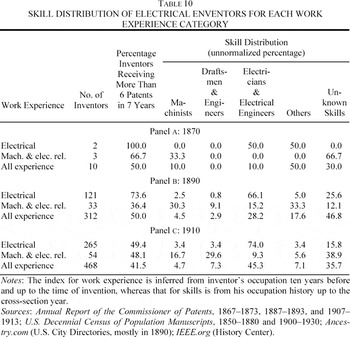
The findings concerning the background of inventors cast further doubt on the notion that the geographic clustering of invention arose directly from learning-by-producing and suggest that the geographic distribution of individuals with appropriate technical skills may be a more important factor influencing the location of invention than proximity to production. Inventors based in tools and machinery were rather distinguished individuals. In all three cross-section years, more than two-thirds of shoe and textile patentees with experience in tools and machinery had worked as machinists or draftsmen and engineers, positions that required high levels of technical skills, as shown in Table 3. In contrast, less than one-eighth of shoe and textile patentees with production experience had worked as machinists or draftsmen and engineers.

The Location of Individuals with Technical Knowledge and the Location of Invention
Could the divergences between the shares of patents and the shares of employment be attributed to the geographic distribution of individuals with different levels of technical skills? To answer this question, it is sensible to first identify the types of technical skills crucial to carry out inventive activity in the two mature industries and the regions in which individuals with such skills were located.
The level and complexity of technology in shoes and textiles changed dramatically during the First Industrial Revolution, as manufacturing in these industries went from a reliance on craft-based hand production to machinery driven by inanimate sources of power. Production with hand tools by skilled workers was displaced by relatively capital-intensive production carried out by less skilled workers.25
See Thomson, Path, for technological development in the shoe industry, and Copeland “Technical Development”; and Weld, “Specialization” for the textile industry.
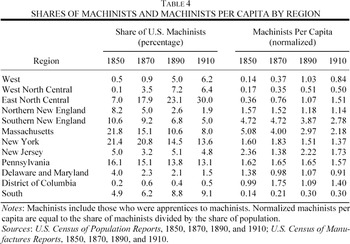
Throughout the nineteenth century, such mechanical knowledge was generated and transferred within the tool and machinery sector. In the early nineteenth century, as a result of high transportation costs, tool and machinery firms were typically established in areas with high concentrations of industrial production, with heavy demand for new machinery or other capital equipment. When Southern New England (and Massachusetts especially) became the leading manufacturing region (on a per capita basis), the tool and machinery sector also flourished in this region, and it remained centered there even into the Second Industrial Revolution.26
See Rosenberg, “Technological Change”; and Hounshell, American System, for the development in the tool and machinery sector during the First Industrial Revolution.

Did the abundance of individuals with mechanical knowledge (workers in the tool and machinery sector) in Massachusetts and the scarcity of such individuals in the South contribute to the wide divergences between the shares of production and the shares of invention in these regions? If individuals with mechanical knowledge played a highly disproportionate role in carrying out inventive activity in shoes and textiles, regions with high concentration of such individuals would generate more inventions than could be explained by their manufacturing workforce (production), and these regions would have a higher proportion of their patented inventions in these industries made by tool and machinery workers than in regions with populations less familiar with tools and machinery.
Comparing the work experience of inventors in Massachusetts, the South, and other regions corroborates the idea that the geographic divergences between invention and production arose from the regional differences in their stocks of mechanical knowledge. As Table 5 shows, in both mature industries, the share of patents created by inventors with tool and machinery experience (and hence mechanical knowledge) is much higher in Massachusetts than elsewhere. Both in 1890 and 1910, Massachusetts was the only region in which such inventors accounted for more than half the patents. In contrast, the South was the region with the lowest proportions of textile inventions awarded to individuals with experience in tools and machinery.27
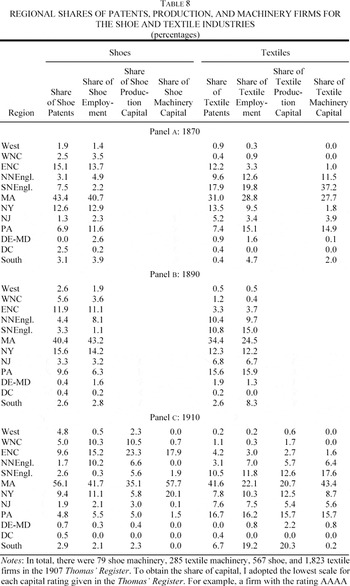
Although the concentration of individuals with mechanical knowledge in Southern New England was comparable to that in Massachusetts, its shares of inventions made by individuals with tool and machinery experience were much smaller than those of Massachusetts. This perhaps arises from specialization within the tool and machinery sector. That is, Massachusetts' larger shoe production volume led to greater specialization in shoe machinery than in other Southern New England states as later shown in Table 8.

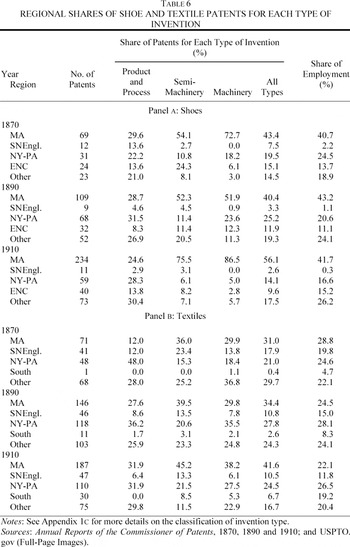
Also of interest are the regional shares of patents in each type of invention: product and process related; semimachinery; and machinery.28
Inventions on machines are categorized into two classes: machinery and semi-machinery to distinguish highly sophisticated inventions from less drastic improvements. See Appendix 1, part C for more details.

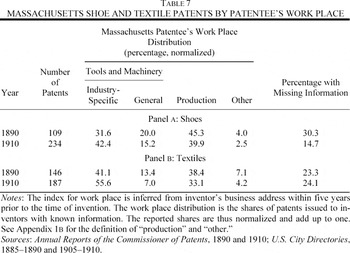
An exploration into business addresses of inventors awarded patents in 1890 and 1910 while residing in Massachusetts further reveals that the majority with experience in the tool and machinery sector did not work for firms that manufactured general tools and machinery, but for firms that produced industry-specific tools and machinery.29
Before 1910, population census manuscripts do not contain information that allows us to differentiate whether an individual worked for an industry-specific capital goods producer. On the other hand, city directories generally provide excellent records of such information. However, they were mostly in microfilms and very few were available for 1865–1870. I thus compile information for only 1890 and 1910 inventors residing in Massachusetts, the state by far with the highest shares of shoe and textile patents and with the largest shares of inventors with experience in tools and machinery.
In 1910 more than 70 percent of the shoe patents awarded to individuals in shoe tool and machinery firms were generated by employees of Bresnahan Shoe Machinery and the United Shoe Machinery companies. Employees of the Draper Company and the Crompton & Knowles Loom Works contributed roughly 85 percent of the textile patents awarded to individuals in textile tool and machinery firms. However, in 1890 Massachusetts' shoe and textile patents created by such individuals in industry-specific tool and machinery firms were not so concentrated. Employees of what would become the United Shoe Machinery Company accounted for 30 percent of the patents made by individuals in shoe tools and machinery, while one employee of Bresnahan Shoe Machinery Company was granted a shoe patent. Likewise, employees of what were later the Draper Company and the Crompton & Knowles Loom Works generated only about one-third of the patents made by individuals in textile tools and machinery. (Employees of the well-known Lowell Machine Shop and Mason Machine Works created about 8 percent in 1890.) See Thomson, Path, for the creation of the United Shoe Machinery Company as well as Gibbs, Saco-Lowell; and Mass, “Mechanical and Organizational Innovation,” for developments in the textile machinery industry.

These findings from business addresses highlight the importance of individuals working for industry-specific machinery firms in Massachusetts. Because these individuals located where there were industry-specific machinery firms, I examine the regional shares of industry-specific capital goods producers and compare them with those of patents and capital goods users. As Table 8 shows, in 1910 the regional shares of textile machinery firms, measured by capital stock, were closer to the textile patent shares than were the shares of textile production, measured by employment.31
Capital ratings reported in Thomas' Register of American Manufacturers are used to calculate the regional shares of capital goods-producers' capital in 1910. The Thomas' Register appears to include almost all of the manufacturers. (Very small companies may be omitted.) Although not as ideal for comparison as the shares of employment, the shares of capital seem to be a reasonable proxy. The regional shares of textile capital-good users' capital in 1910 are comparable to those of employment. The 1870 figures on textile machinery from the Census of Manufactures may not be fully comparable to the 1910 figures obtained from the Thomas' Register. The 1870 Census had statistics only on cotton and woolen machinery, excluding other textile machinery, such as for silk manufacturing.
Figures for the shoe industry obtained from the Thomas' Register are perhaps more problematic than those of the textile industry. The regional shares of shoe machinery firms were susceptible to how shoe machinery firms are identified. The shares presented in Table 8 include seven sewing machine firms that also produced shoe sewing machines. If such firms were excluded, the shares of shoe machinery firms would be 4.5 percent for the East North Central region, 83.5 for Massachusetts, and 5.6 for New York. Furthermore, the figures for shoe producers' capital may not be as accurate as those for shoe machinery, textile machinery, and textile producers firms because the Thomas' Register only has records of boot and shoe manufacturers. Small boot and shoe makers were not listed.

These findings from the mature industries (business addresses and shares of industry-specific machinery firms) illustrate the limited explanatory power provided by the learning-by-producing hypothesis.33
There seems a stronger correlation between the shares of patents and those of employment, as compared to the shares of industry-specific machinery capital in Table 8, especially in Southern New England. The shoe industry, to some degree, had a similar pattern. The weak correlation between the patent shares and the shares of industry-specific machinery firms' capital may reflect increasing returns in industry-specific capital goods producers. Hence, only a region with a sufficiently large number of these firms, such as Massachusetts, was able to benefit. Such increasing returns may occur long before 1870. From the 1860 Census of Manufactures, the shares of textile machinery capital were approximately 37 percent for Massachusetts, 27 for Southern New England, 16 for Pennsylvania, and 12 for Northern New England. In addition, the divergence between the patent shares and the shares of textile machinery capital in 1870, particularly in Southern New England, may arise from errors in the figures reported by the Census. The figures for 1860 and 1910 were reasonably comparable, unlike those for 1870. A further investigation into the 1870 Census of Manufactures reveals that a significant number of machinery establishments in Massachusetts were reported under the unspecified category, and so were not included in the textile machinery statistics. In contrast, very few machinery establishments in Rhode Island (an important state in Southern New England's textile tools and machinery) were reported under such a category. (See, for example, Worcester County, Massachusetts and Providence County, Rhode Island.)
A direct test of learning-by-producing in the manufacturing of capital goods is to compare the change in production, preferably an exogenous relocation, of capital goods with the change in invention.
THE GEOGRAPHY OF ELECTRICAL INVENTION
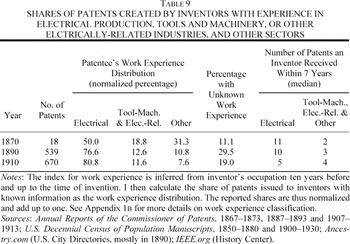
Individuals with advanced technical knowledge were even more responsible for inventive activity in the electrical industry than in the two mature industries. As Table 9 shows, individuals who had experience in the industry and were highly specialized at invention created the great majority of inventions in the electrical industry.35
The census manuscripts did not provide a detailed description differentiating between production of electrical goods and electrical equipment. Nevertheless, the distribution of the positions they had held (in Table 10) does give us some hints on whether these inventors were directly involved in production.
The fall in inventor productivity in electrical inventions probably reflects the fact that 1875–1890 was the era of great discoveries in electrical technology.
Having designed electrical products, these inventors likely had better ideas on how to construct the products, and hence they might be involved in production. Nonetheless, their primary jobs were not in production. See Passer, Electrical Manufacturers; and Institute of Electrical and Electronics Engineers, Inc., “IEEE History Center” for more details on famous electrical inventors.


For example, Elihu Thomson, the co-founder of the Thomson-Houston Electric Company, began his career as an assistant professor of chemistry at the Philadelphia Central High School in 1870.38
Hughes, Networks, p. 141, claimed: “Philadephia's Central High School … offered advanced technical and scientific courses that were not altogether different from the courses given in the Technischen Hochschulen (“technical higher schools”) in Central Europe.”
Institute of Electrical and Electronics Engineers, Inc., “IEEE History Center”; Passer, Electrical Manufacturers, pp. 22–26; and LexisNexis, “U.S. Patents.”
How did electricians and electrical engineers acquire their skills? Electric technologies were radically different from those underlying steam- and water-powered machinery. Unlike mechanical or other technologies that could be mastered by physical observation or construction, electrical technologies were abstract, requiring knowledge of how to interpret and make sophisticated technical diagrams and scientific calculations. Therefore, it was more difficult for electrical knowledge to be acquired by physical construction or through apprenticeship programs in (traditional) tools and machinery.
Because of the novelty of electrical technology, individuals with electrical knowledge were scarce during the early years of the industry and no region had a historical legacy of such human capital. An individual who was trained at an institution of higher learning would therefore have an advantage over others in understanding the electrical technologies.40
See Mann, Study, for a sample of engineering curriculum during 1870 and 1916.
Institute of Electrical and Electronics Engineers, Inc., “IEEE History Center”; Passer, Electrical Manufacturers; and Hughes, Networks.
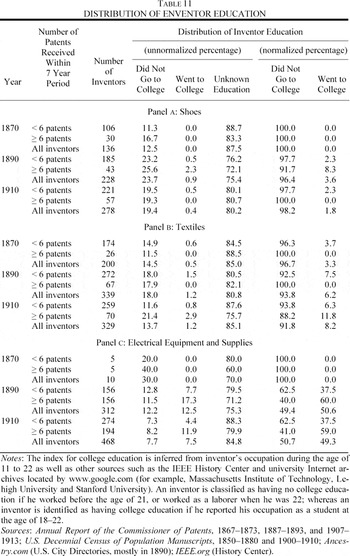
A quantitative examination of the educational background of inventors corroborates the notion that electrical inventors tended to be relatively highly educated. As Table 11 reports, electrical inventors, whether relatively productive or unproductive at invention, were often highly educated, as compared to the general population in the late nineteenth century, or even the technologically creative shoe and textile inventors. Based on the inventors sampled from 1890 and 1910 for whom inferences about educational attainment can be drawn from census materials (only about 20 percent of the total), roughly one-half of electrical patentees went to college, as compared to less than 10 percent for shoe and textile inventors.42
The importance of higher education in electrical inventive activity is even more apparent when we compare “unproductive” electrical inventors receiving fewer than six patents in seven years (about 37 percent went to college) to “productive” shoe and textile inventors receiving at least six patents in seven years (less than 12 percent did so). This pattern holds even after controlling for age as shown in Sutthiphisal, “Geography,” chapter 6.

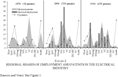
Familiarity with, if not mastery of, the scientific basis of electricity was an enormous advantage in making contributions at the frontiers of electrical technology. Those who attended engineering schools were likely more capable of dealing with technical diagrams, carrying out the necessary calculations and measurements, as well as applying the relatively abstract principles involved in electrical technology. Therefore, we expect patenting rates to be higher in regions where engineering schools (or institutions offering training in related sciences) were clustered. The results in Table 12 and Figure 2 support this conjecture.43
The statistics on number of engineers in each region also include mining engineers. The Census did not distinguish different types of engineers. There were likely many mining engineers in the West.
By the late 1880s, several U.S. institutions offered electrical engineering programs. Massachusetts Institute of Technology offered a four year course in electrical engineering in 1882. Cornell University offered its first electrical engineering courses in 1883, and then a four year undergraduate program in electrical engineering program in 1885. (See Hughes, Networks, pp. 143–44.) Nonetheless, the geographic association between engineering schools and engineer inventors is less than perfect because these electrical engineers were young and scarce in supply, and hence they were very geographically mobile. (See Sutthiphisal, “Geography,” chapter 6, for more detail.)


FIGURE 2 REGIONAL SHARES OF EMPLOYMENT AND PATENTS IN THE ELECTRICAL INDUSTRY
In contrast, production location does not seem to have had a powerful impact on where inventive activity in the electrical industry was carried out. The divergence between invention and production is even more apparent in the electrical industry than in the shoe and textile industries.45
Measurement errors associated with patent and employment data may explain some of the divergence between production and invention observed in the electrical industry. First, there is a possibility that inventors who had close ties with multi-state firms (fairly common in the electrical industry), might use their business addresses rather than place of residence when they applied for patents. However, among inventors that I matched to the census manuscripts, addresses seemed to be in the state where they lived (inferred from their children's birth places). Second, in the Census of Manufactures, all electrically related production is in one category: electrical apparatus and supply. This category includes products not selected for the sample (such as electrical transportation equipment). These electrical employment statistics are therefore slightly different from employment levels in firms using what this article classifies as electrical patents. I do not expect the difference to be significant because many large electrical companies during that time such as General Electric and Westinghouse were not specialized producers. They produced a wide spectrum of electrical goods within the same state. Consequently, the census statistics should appropriately measure employment in the subset of the electrical industry being studied.
Electrical invention was less clustered at the regional level than for shoes and textiles. This finding may seem inconsistent with the technological spillovers hypothesis that inventors in emerging-technology industries are especially likely to cluster, to exploit opportunities to exchange ideas and receive the most up-to-date information. Such a finding that electrical invention was scattered, however, does not necessarily contradict the hypothesis. Because they are calculated from regional level statistics, the patent shares only indicate the extent to which patenting rates vary across regions, not whether inventive activity was highly clustered in a few areas within a region. Sutthiphisal, “Geography,” chapter 5, shows that electrical invention was much more concentrated in urban areas than shoe and textile invention.
CONCLUSIONS
To investigate the influence of the location of production on the location of invention, this article has examined the experience of selected technologically mature and emerging “high-tech” industries during the Second Industrial Revolution. Both the evidence drawn from geographic patterns of patenting and production, as well as from close examination of the work histories and experience of patentees, suggests that invention was overall not directly associated with production. Not only were there important discrepancies in each of the industries between the geographic distributions of inventive activity and production, but the most productive inventors, and those disproportionately located in the centers of invention, were distinguished more by their strong technical backgrounds than by their actual involvement in production. Moreover, regional shifts in production location seldom inspired corresponding increases in invention. Regions that had high rates of patenting in an industry were those that had an abundance of individuals with the technical skills appropriate to the technology in that sector.
Although regional differences in the availability of individuals with the appropriate technical skills may have been partially due to the location of contemporaneous production, other factors played a more important role. The dominance of Massachusetts in accounting for new technologies in shoes and textiles came from the concentration of the (industry-specific) tool and machinery sector in that state (and in Southern New England more generally) since the early and mid-nineteenth century. It was individuals with technical knowledge accumulated through experience in tools and machinery (particularly, the industry that produced the capital goods) who were the most productive generators of new technologies in the shoe and textile industries. Even as production in these industries shifted elsewhere late in the century, the locations of the centers of invention remained the same. Indeed, if anything, their centrality increased. With improvements in transportation, communication, and institutions involved in the transfer of technology across regions, it was less necessary for those equipped with the technical knowledge to be effective inventors to locate where their inventions would be applied to production.
The sources of regional variation in the abundance of individuals with the specialized knowledge required to be effective at invention in the electrical industry were somewhat different. The reliance on individuals with technical knowledge was even stronger because of the greater complexity of the technology. However, because the technology was just beginning to be introduced in the 1880s, and because familiarity with the basic elements of electricity was scarce, there were no long-established concentrations of individuals with the requisite human capital. The closest analogue, perhaps, were the locations of engineering schools or other institutions of higher learning with programs in fields related to electricity. The geographic patterns of invention in the new technology industry offer a striking contrast with those in shoes and textiles. The former was characterized by greater variability over time in the locations of high rates of invention. Again, however, the location of inventive activity was not so directly associated with production.
The historical experience examined in this article suggests that less-developed countries that are recipients of shifts of production today may have to wait a long time before they develop into important generators of new technological knowledge. The build up of stocks of industry-specific technical knowledge sufficient to support high levels of inventive activity will not follow smoothly or automatically from an increase in production. Even if these countries promote human capital formation, not only will the process likely take many years, but there are also difficult issues surrounding the formation of human capital that developing countries have to resolve. For example, they must consider that appropriate institutions facilitating human capital accumulation may vary with the level of technological development. Whereas colleges seem to promote knowledge diffusion in science-based industries such as the electrical industry, technical schools or apprenticeship programs can perhaps effectively support industries that employ mature technology.
In many ways the difficulties facing follower countries that seek to jump quickly to the technological cutting edge seem even more formidable in the early twenty-first century than they were in the nineteenth century. Operating at the technological frontier requires much more technical and specialized knowledge today than it did a century ago. Those countries that have only recently begun to industrialize are much further behind the leaders than were the developing nations of the late nineteenth century (for example, Germany, Sweden, and Japan). The challenge is certainly daunting. It would not be surprising if many observers found the prospects gloomy. However, a more optimistic perspective on the same circumstances can be reasonably offered. An enormous gap between the technology at the cutting edge and the technology in use suggests that there is ample room for advance in a less-developed country's total factor productivity. It is both possible and desirable for a follower to realize substantial productivity and economic growth, even without being responsible for shifting out the technology frontier. Even as regards developing a potential for high rates of invention, improvements in transportation and communication have made it easier for developing countries today to send their people to receive formal training abroad, or to otherwise access technological information, than it was during the Second Industrial Revolution.47
The examples of Taiwan and South Korea give confidence that the case for optimism is based on more than mere hope. Among countries that received U.S. utility patents in 2001, Taiwan ranks fourth and South Korea eighth, comparable to countries that are traditionally more technologically advanced such as the United Kingdom and France. (See U.S. Patent and Trademark Office, Technology Assessment.)
Appendix 1: Classification Schemes
A. GEOGRAPHIC REGIONS
The geographic classification scheme that divides the United States into 13 regions are based on the U.S. Bureau of Census' scheme with finer divisions utilized for areas with higher inventive activity such as New England and Middle Atlantic. The regions are as follows. (a) West – AZ, CA, CO, ID, MT, NM, NV, OR, UT, WA, and WY. (b) West North Central – IA, KS, MN, MO, ND, NE, and SD. (c) East North Central – IL, IN, MI, OH, and WI. (d) Northern New England – ME, NH, and VT. (e) Southern New England – CT and RI. (f) Massachusetts. (g) New York. (h) New Jersey. (i) Pennsylvania. (j) DE-MD – DE and MD. (k) District of Columbia. (l) South – AL, AR, FL, GA, KY, LA, MS, NC, OK, SC, TN, TX, VA, and WV. (m) Other – AK and HI.
B. WORK EXPERIENCE
The index for work experience is drawn from the inventor's occupation at the previous or current census (or city directory). The index uses his occupational title up to ten years prior to the patent year. (a) The production category is only applicable to shoe and textile inventors. Inventors in this category had occupational titles implying experience in the production and trading of goods in the industry. Last makers and loom fixers are included in this category. (b) The tool and machinery category is applicable to all three industries. Unless specifically listed as workers in some other manufacturing industry, shoe and textile inventors classified into this category include all with occupations such as machinists, draftsmen, mechanical engineers, toolmakers, as well as model and pattern makers. Textile inventors who were millwrights, shuttle makers, and needle makers are also included. Electrical inventors classified into this category are only those with experience in general tool and machine works (not those working for electrical machinery firms). (c) The electrical and electrically related categories are only applicable to electrical inventors. An inventor is classified as having experience in electrical equipment and supplies if he was an electrician, an electrical engineer, or had worked in production and trading of electrical goods and equipment, except those related to electrical transportation and communication and equipments. An inventor is classified as having electrically related experience if he was involved in electrical transportation and communication equipment. (d) The other category includes those who were not classified as having production, tool and machinery, electrical, or electrically related experience. For example, they were farmers, lawyers (both patent and general practice), dentists, teachers, carpenters, and blacksmiths.
C. INVENTION TYPE
The index for invention type is inferred from detailed descriptions of invention including patent drawing, specification, and claims. The classification scheme for the shoe and textile industries is as follows. (a) The product and process category refers to inventions that were goods or means to produce such goods in the respective industries. Shoe heels, shoe peg, new shoe construction methods, chemical treatment of clothes and new weaving methods are included in this category. (b) The semi-machinery category refers to inventions that were machinery accessories and incremental improvement of existing tools and machinery such as mechanisms and work supports as well as new hand tools or apparatus such as shoe knives, lasts, shuttles, spindles, bobbins, knitting machine needles and dyeing apparatus. (c) The machinery category refers to inventions that are new machinery, not just its part. (d) The other category are inventions that were not part of the industry core such as boot blacking apparatus, shoeboxes, shoe brushes and ribbon holder for retail stores.
Appendix 2: Notes on Missing Inventor Biographical Information
Biographical information (especially occupational titles at some points during the inventor's life) is missing for some patentees in the sample. During the period that I constructed the sample, the on-line resources did not always allow me to search for an individual unless he was the household head. Even if the inventor was the head in a census year, I occasionally cannot obtain information because either his name was not recorded correctly or there were many individuals with the same name living in the same county.
Because young, single, and foreign-born individuals are less likely household heads and because urban areas tend to have more individuals with the same name, the biographical information of inventors in the sample is biased to some extent. However, there is no reason to believe that there is any systematic bias across regions or types of occupation.
I am very grateful for insightful advice from Kenneth Sokoloff. I have also benefited from comments offered by Daniel Ackerberg, Naomi Lamoreaux, Shih-tse Lo, Mary MacKinnon, Jean-Laurent Rosenthal, the editor, two anonymous referees, and participants at the 2004 NBER Summer Institute, the 2004 EHA Meeting and the UCLA Economic History Seminars. Finally, I would like to thank Eileen Chou, Carolina Corral, Hong Tran, and Jicky Trantrong for their excellent research assistance as well as the staffs at the Science, Technology and Patents Department, Los Angeles Public Library for their patience with my demanding use of the computing resources to access the USPTO on-line database.