I. INTRODUCTION
A. Chemical mechanical polishing process
In multilevel metallization or interconnection scheme used for the manufacturing of integrated circuits (IC), the metal interconnections are not confined to one plane; they span several planes and are isolated by insulating layers and connected by the wiring in the third dimensions through holes in the dielectric planes.Reference Taur, Mii, Frank, Wong, Buchanan, Wind, Rishton, Sai-Halasz and Nowak1–Reference Luo and Dornfeld3 Chemical mechanical polishing (CMP) is a process that creates smooth and planarized surface. CMP is the process of choice to planarize the constituent materials of IC interconnect scheme.Reference Steigerwald, Murarka and Gutmann2–Reference Borst, Gill and Gutmann6 For this reason, the CMP process is also known as chemical mechanical planarization. An excellent review on CMP process technology has been published by Zantye et al.Reference Zantye, Kumar and Sikder5 Over a decade, CMP has been the fastest growing process technology in IC manufacturing. In 2012, worldwide sale of CMP consumables were well over $2.5 billion and still growing at a healthy pace. CMP steps accounts for up to one-third of all chip-manufacturing steps.
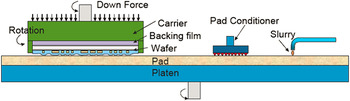
One of the plausible mechanisms of CMP is the three body contact where the high points of the wafer and pad asperities come in contact with each other in the presence of abrasive slurry (see Fig. 1).Reference Taur, Mii, Frank, Wong, Buchanan, Wind, Rishton, Sai-Halasz and Nowak1–Reference Zantye, Kumar and Sikder5Figure 1 shows schematic of a typical CMP tool that consists of the following essential parts: platen that holds the polishing pad, pad conditioner, a wafer carrier, and a slurry arm dispenser. During CMP, the wafer to be planarized is held at pressure by a retaining ring pressed face down against a rotating polishing pad soaked with chemically and physically active slurry.Reference Steigerwald, Murarka and Gutmann2–Reference Zantye, Kumar and Sikder5 Typically slurry contains small abrasive particles (<100 nm) such as alumina, ceria, or silica at concentrations ranging from 0.10% by weight to 25% by weight. Slurry is being dispensed by a slurry arm close to the center of the pad from where the centrifugal force spreads it over the entire pad surface. A diamond conditioner is often used to regenerate the polishing pad surface that can undergo glazing if not dressed.Reference Runnels and Eyma7 Due to the close contact between the pad surface and the wafer during CMP, the mechanical, chemical, and physical properties of a polishing pad and pad surface roughness play a significant role in the material removal rate (RR), wafer defect level, and the final global/local planarization of the wafer surface.Reference Luo and Dornfeld3,Reference Runnels and Eyma7–Reference Oliver12
A schematic diagram of a CMP polisher.

The polishing properties of CMP pads are both intrinsic and extrinsic functions of the polymer type used and the resulting foam morphology.Reference Zantye, Kumar and Sikder5,Reference Oliver12–Reference Prasad17 OliverReference Oliver12 has shown that several factors contribute to the modification of pad properties. Commercially available hard polishing pads are typically made up of thermosetReference Steigerwald, Murarka and Gutmann2,Reference Zantye, Kumar and Sikder5,Reference Reinhardt, Roberts, McClain, Budinger and Jensen13 or thermoplastic polyurethane polymers.Reference Prasad16,Reference Prasad17
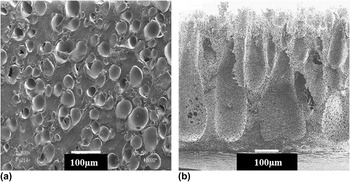
Pore microstructure and porosity have been shown to be important parameters for CMP pads. McGrath and DavisReference McGrath and Davis18 have shown that pores act as a slurry fluid reservoir underneath the wafer during polish. There are several known methods to generate porosity in a CMP pad. Examples include the use of microspheres,Reference Reinhardt, Roberts, McClain, Budinger and Jensen13,Reference Mochizuki19 dispersed water-soluble particles,Reference Shiho, Aoi, Hasegawa and Kawahashi20 phase separation and coagulation,Reference Imada21,Reference Hoffstein and Shinagawa22 supercritical fluid mixing,Reference Prasad16,Reference Prasad17 and solid-state foaming.Reference Prasad16,Reference Prasad17 In thermoset polyurethane polymer-based pads, porosity is typically achieved by blending with microspheresReference Reinhardt, Roberts, McClain, Budinger and Jensen13,Reference Mochizuki19 or by air frothing during the polymerization reaction.Reference Crevasse, Easter, Maze and Micelli23 A scanning electron microscopy (SEM) micrograph of one such commercially available thermoset polishing pads (IC1010™, Dow Electronic Materials, Phoenix, AZ) that contains microspheres is shown in Fig. 2(a) (closed pores). Soft polishing pads are typically based on polyurethane impregnated felts or nonwoven fabric.Reference Imada21,Reference Hoffstein and Shinagawa22 SEM micrograph of one such commercially available soft polishing pad is shown in Fig. 2(b) that contains vertically aligned pores.Reference Steigerwald, Murarka and Gutmann2,Reference Zantye, Kumar and Sikder5,Reference Iwase and Iwao14,Reference Imada21,Reference Hoffstein and Shinagawa22
Cross-sectional SEM micrographs of two types of commercially available CMP pads: (a) IC 1010 (top pad Shore hardness of 65D) and (b) Fujibo (top pad Shore hardness of 20A).

Polishing pads play a critical role in modulating the slurry flow and have significant impact on resulting polished wafer quality. The efficiency of slurry transport by a pad influences material RR, wafer polishing uniformity, wafer scratch defects, planarization efficiency, and CMP process stability. The slurry transport is facilitated by porosity, grooves, and pad surface roughness (asperity).Reference Luo and Dornfeld3,Reference Yeomans, Denardis and Borucki24–Reference Castillo-Mejia, Kelchner and Beaudoin28 Among those, groove designReference Luo and Dornfeld3,Reference Yeomans, Denardis and Borucki24,Reference Elmufdi and Muldowney25 plays a very important role along with surface roughness and waviness.Reference Castillo-Mejia, Kelchner and Beaudoin28,Reference Zhang and Luo29 Groove design controls slurry flow, resulting in polish rate uniformity, defect control, and effective slurry consumption rate.Reference Luo and Dornfeld3,Reference Yeomans, Denardis and Borucki24,Reference Elmufdi and Muldowney25
It has been shown by Elmufdi et al.Reference Elmufdi and Muldowney30 and MarkhamReference Markham31 that the contact area between a pad and a wafer has significant influence on the material RR and defectivity. It is desirable to have higher asperity–wafer contact area, which in turn lowers stress at asperity contact points and hence lower defectivity. The contact area has been shown to depend on surface morphology, which in turn depends on pore size, pore size distribution, and material properties.Reference Elmufdi and Muldowney30,Reference Markham31 Therefore, it is desirable to manufacture pads with controlled porosity and pore size to increase the pad–wafer contact area as well as to maintain pad-to-pad polishing consistency.Reference Yu, Jia, Venkataraman and Li15
B. Solid-state microcellular foaming process
Recently, CMP porous polishing pads based on the solid-state microcellular foaming (SSMF) process was introduced under the trade name of EPIC D200™ (Cabot Microelectronics Corporation, Aurora, IL).Reference Prasad16,Reference Prasad17 From this point, and throughout the paper, we will refer to this type of pads as D200 pad. Typically, a closed cell pore structure will result if the SSMF foaming process is used to create porosity in thermoplastics. The SSMF process is capable of producing average pore size from few microns to well above 100 μm and yet keep the density or percent porosity (% P) similar in all samples by controlling the process parameters, such as gas saturation pressure (P sat) and foaming temperature (T f).
Microcellular plastics refer to close-celled thermoplastic foams with a very large number of small bubbles. Typically, the cell diameter is of the order of 10 μm or less and there are 108 or more cells per cubic centimeter (cm3) of the foam. The SSMF process is a novel process to create microcellular structure in foamed plastics. Martini-Vvedensky et al.Reference Martini-Vvedensky, Waldman and Suh32,Reference Martini-Vvedensky, Suh and Waldman33 patented this technology as a means to reduce the density of solid plastics and thus to save on material costs in applications where the full mechanical properties of solid plastics were not needed.
Traditionally, the microcellular plastics have been made in a two-stage batch process. In the first stage, the polymer is placed in a pressure vessel with a high-pressure and nonreacting gas such as CO2 or N2.Reference Martini-Vvedensky, Waldman and Suh32 Over time, the gas diffuses into the polymer and attains a uniform concentration throughout the polymer specimen. When this specimen is removed from the pressure vessel and brought to atmospheric pressure, a “supersaturated” specimen that is thermodynamically unstable due to the excessive gas dissolved into the polymer is produced. In the second stage, the specimen is heated to what is termed the foaming temperature. This step is typically carried out in a heated bath or oven with temperature control. The dissolved gas lowers the glass transition temperature of the polymerReference Zhang and Handa34 and the foaming temperature needs only to be above the glass transition temperature of the gas–polymer system in order for the bubbles to nucleate and grow. The nature of interaction between the gas and the polymer determines all the key parameters in the microcellular foam processes. Thus, solubility and diffusivity of the gas at different saturation pressures and temperatures play a fundamental role in bubble nucleation and bubble growth, which in the end determine the final microstructure and properties of the microcellular materials.
It was recognized that although the batch process could be used to study new systems and characterize mechanical properties, the potential of these novel materials could not be realized unless the process could be scaled up for mass production. At the University of Washington, a semicontinuous process to produce rolls of microcellular foams from rolls of polymer film was developed by Kumar and Schirmer,Reference Kumar and Schirmer35,Reference Kumar and Schirmer36 whereas Seeler et al.Reference Seeler, Billington, Drake and Kumar37 demonstrated the feasibility of producing a net-shape part in a sintering process based on saturating and foaming polycarbonate powder. Despite this process being environmentally friendly, the SSMF has gained only limited commercial success.Reference Prasad16,Reference Prasad17,Reference Nadella, Powers and Malone38
C. TPU as CMP pad material
TPU is a member of the thermoplastic elastomer family. TPUs are segmented block copolymers forming hard and soft domains in the bulk.Reference Oertel39,Reference Szycher40 Each TPU type uses a specific combination of the three classes of raw materials: isocyanate (difunctional, aromatic, and aliphatic), polyol, or polyamines and chain extender (low molecular weight diols). Thermodynamic incompatibility between the segments results in phase separation and subsequent organization into hard and soft domains.
Although TPU-based microcellular foams have been used for over 10 years as CMP pads,Reference Prasad16,Reference Prasad17 literature lacks a systematic study of the effect of foaming process variables as a function of TPU material characteristics, such as polymer hardness and chemical composition. Only a handful of publications exist on this topic.Reference Michaeli and Heinz41–Reference Dai, Liu, Wang, Yang, Xu and Han46 Moreover, very limited published studies exist that highlight the polishing performance of a polyurethane-based CMP pads.Reference Prasad16,Reference Prasad17,Reference Prasad, Xiang, Wang and Remsen47–Reference Sun, Hawkins, Tsai, Chiu and Naman51 Although, many studies exist that examine the influence of pad physical properties, such as pad compressibility, modulus, and surface roughness,Reference Zantye, Kumar and Sikder5,Reference James52–Reference Allison, Swisher, Wang and Patker58 only a few have reported the influence of pad pore size, porosity, polymer hardness, and stiffness on CMP performance.Reference Yu, Jia, Venkataraman and Li15,Reference Kasai, Woo Nam, Li, Kasthurirangan, Fortino, Prasad, Gaudet, Naman and Sun50,Reference Li, Gaudet and Nair59
In this study, we report the effects of TPU polymer hardness, porosity, pad stiffness, and pore size on ILD CMP performance for polishing pads made by the SSMF process. The versatility of the SSMF process in the fabrication of CMP pads in a variety of polymer hardness range is demonstrated here. The process can be fine-tuned to control pad porosity, pore size, pore size distribution, and polishing pad modulus/hardness by controlling processing parameters such as gas saturation pressure (P sat), gas desorption time, gas desorption temperature, and foaming temperatures (T f). This study covers TPU resin hardness range from Shore 75A to Shore 72D, porosity range from 10% to 50%, and pore size range from 0.45 μm to 106 μm. The manufacturing process including scale up from bench scale to commercial scale, raw material and resulting polishing pad properties and ILD CMP performance are presented. Though this study focuses on TPU-based pads and their CMP performance, the concept is applicable to other thermoplastics as well as thermoset materials.
II. EXPERIMENTAL
A. Materials and characterization
TPU materials used in this study are all commercial grades, available from a variety of sources and ranges in Shore durometer hardness scale from 75A to 72D. TPU material characteristics used in this study are listed in Table I along with some typical thermal properties. The TPU hard segment consists of diphenylmethane-4,4′-diisocynate and 1,4-butanediol and soft segments consist of long chain polyether-based polyols.Reference Prasad, Xiang, Wang and Remsen47,Reference Prasad, Remsen and Xiang48 Shore hardness was measured using Shore durometer as per ASTM D2240-10. The % compressibility (% C) was determined at 0.035 MPa (5 psi) pressure using an Ames meter. The probe of the Ames tester was first zeroed (without the sample), and then the sample thickness was measured (T 1). A 2270 g weight is placed on the probe and the sample thickness is measured after 1 min (T 2). % C is the ratio of the difference in thickness (T 1 − T 2) to the initial sample thickness (T 1).
TPU resin molecular characteristic and thermal properties.

a Only hard segment T g is discernible by DMA.
b Soft segment T g by DMA.
Polymer melting point (T m) and crystallization temperature (T c) were obtained using a differential scanning calorimeter (DSC) Q2000 from TA Instruments (New Castle, DE) at a heating and cooling rate of 10 °C/min. Polymer glass transition temperature (T g) and storage modulus (E′) were obtained using a Dynamic Mechanical Analyzer (DMA) TA Q50 from TA Instruments at an operating frequency of 1 Hz and a heating rate of 2.5 °C per min. T g is defined by tanδ peak (defined as ratio of loss modulus, E″ and storage modulus, E′). Unless stated differently, all E′ data reported here is at 30 °C. Weight average (M w) and number average (M n) molecular weight were determined using gel permeation chromatography (GPC). GPC was carried out at 70 °C in 0.1% dimethylacetamide (DMAc) solution at a flow rate of 1 mL/min that contains 0.05 M NaNO3 and 250 ppm butylatedhydroxyl toluene on a PL 220 chromatograph. The solution was filtered at room temperature using a 0.45 μm Poly(tetrafluroethylene) (PFTE) filter. The system was equipped with a refractive index detector and calibrated with polystyrene standards. Melt index (MI) was obtained on dry samples at 210 °C using 3.8 kg load. MI measurements were done under nonstandard conditions (3.18 kg load was used instead of standard load of 2.16 kg). The reason being that some of the resin samples had very high melt viscosity even at 210 °C. Consequently, such high viscosity samples would not flow through the melt indexer at 2.16 kg load. This is especially true for harder TPU resins. When the load was increased to 3.8 kg, all TPU samples could easily flow through the melt indexer. This allowed us to collect the MI data for all the TPU samples studied here at a given shear rate and temperature.
Foamed specimens were either knife-cut or freeze fractured in liquid nitrogen. The exposed surface (cross-section) was studied using a scanning electron microscope (SEM). All SEM work was done on a Jeol JCM-500 Neoscope at an accelerating voltage of 10 kV at high vacuum settings. To prevent charging of samples, specimens were coated in a Cressington sputter coater, model 6002-8 using a 60/40 Au/Pd target to a thickness of approximately 4 nm.
SEM micrographs were used for pore size calculation. Average pore size was measured using Pax-It Software. A minimum of 30 pores per SEM micrograph are measured using Pax-It image analysis software. This is done by manually drawing horizontal lines from one edge of the pore to the other and allowing the software to calculate pore size for each of the bubbles. The software also calculates the pore size distribution of the sample including minimum, maximum, average size, and standard deviation.
The foamed sheet’s porosity was determined by density measurement using ASTM standard D792. Foam density was measured on Mettler Toledo XS series scale (Model 205) that utilizes the Archimedes’ buoyancy principle to measure specimen density. Liquid used was 100% ethanol, as this did not wet the specimen surface and pores. All samples were allowed to stand under ambient conditions for at least 72 h prior to measuring the density, as these foam samples tend to increase in foam density with time. Equation (1) was used to calculate percent porosity (% P) of a foamed specimen.
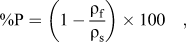 $${\rm{\% P}} = \left( {1 - {{{\rm{\rho }}_{\rm{f}} } \over {{\rm{\rho }}_{\rm{s}} }}} \right) \times 100\quad ,$$
where ρf is foamed specimen density and ρs is unfoamed specimen density.
B. Foaming process
All samples were extruded in 1.5 ± 0.5-mm thick sheet form. Solid-state foaming was done either in a bench scale pressure vessel or in a large commercial pressure vessel following the method of Nadella et al.Reference Nadella, Powers and Malone38 Initial process conditions were obtained using the bench scale pressure vessel. Specimen of known weight and size were placed in a bench scale pressure vessel purchased from Syrris Inc. (Atlas 200 bar sodium pressure system). The operating range of the pressure vessel is 0.1–20 MPa (14.5–3000 psi) and operating temperature range is from −40 °C to +200 °C. Pressure vessel temperatures can be accurately controlled to ±0.1° and pressure to ±0.01 MPa. The vessel is then pressurized by CO2 gas to a desired pressure and temperature. Once TPU sheet is saturated with required amounts of gas (24–48 h of saturation time), the pressure vessel is rapidly depressurized followed by submerging the gas saturated specimen to a desired T f in silicon oil bath. Typical T f is above T g but below onset of polymer T m (see Table I). Typically, it takes less than 2 min to completely depressurize the vessel. All gas-saturated specimens were held for 2 min in oil bath to ensure complete foaming of the specimen. Foamed specimens were then thoroughly washed to remove any oil residue and vacuum dried for subsequent characterization.
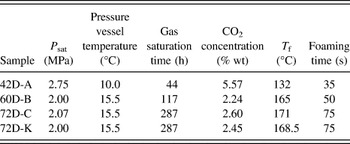
Bench scale process conditions were utilized to scale up the foaming process using large commercial pressure vessels. Processing conditions, such as gassing pressure and temperature, foaming temperature, and foaming time, were directly transferable from bench scale to commercial scale with minor adjustments. This is particularly important when one considers the scale up factor of 2000×. A convection oven was used to foam gas-saturated specimens at desired T f. Some typical detailed SSMF process conditions that were used during foaming of specimens in the large vessel are tabulated in Table II.
Selected TPU SSMF process conditions used to produce CMP pad specimens.

C. Foaming conditions and resulting foam morphology in the large pressure vessel
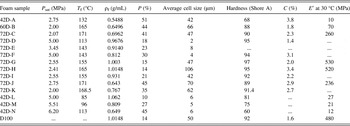
SSMF foaming process conditions for several of the specimens are listed in Table III along with some key physical properties.
TPU foam processing conditions and resulting foam physical properties.a

a Foam properties listed here are only for the samples where skin layer was removed from top and bottom surface of the foamed sample.
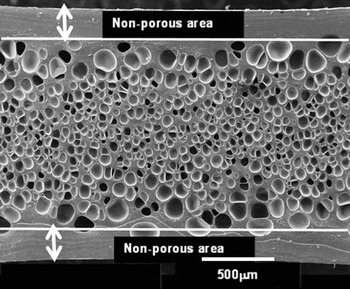
Figure 3 shows cross-sectional SEM micrographs of the TPU foamed sample of 87 Shore A resin hardness that was made using a commercial manufacturing process. The foam morphology is characterized by a nonporous or skin layer at the top and bottom surface of the sheet and a uniform pore size structure in the middle of the sheet. Such foam morphology is very common for the foams made using the SSMF process and has been subject to intense research by Kumar et al.Reference Kumar and Weller60 and Nadella et al.Reference Nadella, Mehta, Kumar and Li61 The reason for observing a skin layer has to do with the faster rate of gas diffusion from the surface of the gas-soaked polymer films during depressurization, film transport, and foaming. During commercial operations, the transport time is significant enough to cause significant gas loss from the film surface. Furthermore, gas loss from the surface can also occur when the film is exposed to convection heat during the foaming process. Due to faster gas diffusion at the surface, it is expected that near the surface the gas concentration will be below the critical gas concentration (C*) required for the bubble nucleation and hence the skin formation.Reference Kumar and Weller60,Reference Nadella, Mehta, Kumar and Li61 Consequently, it is expected that the top and the bottom parts of the foamed specimen will be nonporous. The thickness of the skin layer is highly dependent on the resin hardness as a gas diffusion rate will be governed by the T g of the polymer (see Table I). For harder resins, such as 72D and 60D, where T g is well above the room temperature, the skin morphology is barely discernible, whereas for softer resins, such as 87A and 75A, the skin thickness can be anywhere from 10 to 300 μm. In this particular example, the skin layer thickness is 250 μm at both top and bottom surface of the soft resin foamed specimen, and the porous area has a thickness of 1250 μm.
Cross-sectional SEM micrographs of TPU foamed samples of 87 Shore A hardness resin that was foamed using a commercial pressure vessel depicting typical foam morphology with a nonporous or skin layer at the top and bottom surface of the foamed sheet. In this particular example, skin layer thickness is 250 μm at the both top and bottom surface of the foam and the foamed area has a thickness of 1250 μm.

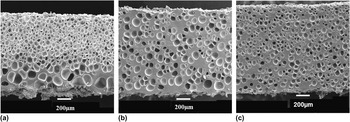
As will be demonstrated later in the next section of the paper, pore size and % P play a significant role in CMP results. Hence, to have uniform pore structure in the thickness direction of the CMP pads, it is a common practice to remove the skin layer either by the buffing process or by the skiving process. In this study, all samples were buffed to remove the nonporous area prior to any CMP experiments. In this way, we can ensure that the pore size or the pore structure is uniform during the polishing cycle as CMP pad wears away during diamond conditioning and wafer polishing. Some typical SEM micrographs for foam samples that were used for CMP are depicted in Fig. 4, where the top and bottom skin portions were buffed off. As one can see from micrographs of Fig. 4, the foamed top polishing pads used in this study are characterized by excellent control in pore size, % P, and pore size distribution. All the polishing pads used in this study were constructed from the foams with pore morphologies similar to those shown in Fig. 4.
Cross-sectional SEM micrographs of foamed TPU samples: (a) 42D-A, (b) 60D-B, and (c) 72D-C, where the nonporous layer was removed by the buffing process from the top and bottom surface of the foamed sheet.

D. CMP pads
Pads with a systematical change in pore sizes, resin hardness, and % P were manufactured using the commercial process described in Sec. B and C. By adjusting the foaming conditions that control the pore size and porosity independently, the foamed sheets with average pore sizes of <2 μm to average pore size of up to 106 μm and average % P ranging from 10% to 50% were obtained for different Shore hardness TPU resins (see Table III). As shown in Fig. 3, commercially produced samples may have skin thickness anywhere from 10 to 500 μm that needs to be removed prior to CMP experiments. The sample characteristics listed in Table III are for the samples where the skin layers were removed by the buffing process.
Unless specifically pointed out, all pads in this study were concentrically grooved with following dimensions: groove width = 508 μm, groove pitch = 3048 μm, and groove depth = 318 μm. The grooved pads with above dimensions will be addressed as “CC 20/120” throughout the manuscript. In some cases, the experimental pads were compared with the commercial D100™ pads (Cabot Microelectronics Corporation, Aurora, IL) whose groove depth was 762 μm.
E. CMP process and conditions
A commercial fumed silica ILD slurry Semi-Sperse® 25 (SS25 from Cabot Microelectronics Corporation, Aurora, IL) was used in this study. The as-received slurry contained 25 wt% solid at pH 11 and it was diluted in 1:1 ratio with laboratory-grade deionized water (one part of slurry and one part of water) at point-of-use. ILD chemical mechanical polishing was conducted in a Class I clean room environment with a Mirra (200 mm) polisher (Applied Materials, Santa Clara, CA). Unless specifically pointed out, the slurry flow rate was set at 200 mL/min for Mirra. 200 mm diameter size silicon dioxide wafers used for ILD polishing work (known as PETEOS or plasma-enhanced tetraethyl-orthosilicate or simply TEOS wafer) was supplied by Advantiv Technologies, Inc., Fremont, CA, where the prepolishing oxide thickness was 15,000 Å. The change in monitor wafer thickness due to CMP was determined using a model KLA-Tencor UV-1050 (KLA-Tencor, Corp., Milpitas, CA). The RR was determined as the change in monitor wafer thickness per unit polishing time. The thickness of the wafers was measured across the wafer diameter with 49 measurement points and 3-mm edge exclusion. Defectivity (scratch count) was measured on Surfscan SP1 tool (KLA-Tencor, Corp., Milpitas, CA). Defect counts from dark field composite channel with Oblique light (DCO) channel at 0.225-ns threshold were reviewed by SEM (Model: SEMVision, Applied Material, Santa Clara, CA). Defectivity was reported as number of random scratches per wafer if all data were collected on the same experiment. However, for the comparison of defectivity, data collected from different polishers or different experiments, the defectivity data were normalized to the control D100 pad.
III. RESULTS AND DISCUSSION
A. Foaming process conditions and resulting foam morphology
The key process conditions that are known to control foam properties are P sat, percent gas uptake (a function of gas solubility in polymer, pressure vessel temperature), interfacial tension between bubble and polymer matrix, and T f.Reference Martini-Vvedensky, Waldman and Suh32–Reference Kumar and Schirmer36
SSMF foaming process conditions are listed in Tables II and III along with key physical properties of some of the foamed materials used in this study. Equilibrium gas concentration and foaming temperature limits are defined by the polymer hardness. Typically, softer TPUs will absorb more gas at a given P sat compared with harder TPUs. Also, in the case of softer resin, one has to use lower T f due to its lower melting compared with a harder TPU (see Table I). To meet our objective to produce specimen of different cell size and different % P, we used different P sat and T f conditions for different hardness resins. In this study, we used P sat from 2 to 6.2 MPa and T f from 85 to 171 °C. Here it is important to note that we did not always optimized two of the foaming conditions: foaming time and T f. The purpose of this study is to explore the effect of SSMF processing conditions on foam morphology by creating porous specimen in a wide variety of pore size and porosity range. Furthermore, we want to explore the effect of various cell size and % P on CMP behavior. For example, we wanted to create samples that have similar pore size but different levels of % P or keep the porosity level similar in all samples but change the pore size. By choosing different foaming time and temperature conditions for a gas-saturated specimen at a fixed saturation pressure, we were able to create foamed samples in a wide range of cell size and porosity.
As one can see from the data of Table III, P sat and T f have significant influence on resulting foam morphology. As expected, for a given hardness, CO2 solubility in TPU increases with increasing P sat as predicted by Henry's Law.Reference Vieth62 As a result, cell size and % P are strongly affected by the amount of gas present. For example, compare the % P and cell size of samples 72D-C and 72D-K. Both these samples were soaked at approximately 2 MPa pressure and foamed at approximately 170 °C and yet the resulting cell size and % P are different in these two samples. Also, T f strongly affects the foam morphology. For a fixed gas concentration, higher T f results in larger cell size. For example, samples 72D-G and 72D-H have a very similar gas content of 2.5% and yet the resulting pore size is 2.5 times larger for sample 72D-H because this sample was foamed at 10 °C higher temperature.
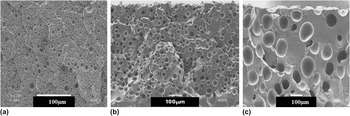
We also studied the foam morphology of some of the samples of Table III by SEM. Freeze-fractured cross-sectional SEM views of 72D foamed samples are shown in Figs. 5 and 6. Figure 5(a) shows the SEM picture of 72D-D foam that has an average pore size of 2 μm and % P of 18. Figure 5(b) shows the SEM picture of 72D-G foam sample that has an average pore size of 47 μm and yet the porosity is 15%, which is close to that of sample 72D-D. Similarly, SEM micrograph of 72D-H foam sample shown in Fig. 5(c) has an average pore size of 106 μm and yet, the % P is 14. Figure 5 serves as an example to demonstrate that the SSMF process can be used to produce the pore size ranging from few microns to over 100 μm for a similar foam density or % P. To vary the pore size at a fixed porosity, we had to use different P sat and T f for each of the samples (see Table III for conditions).
Cross-sectional SEM micrographs of foamed TPU samples of 72 Shore D resin hardness depicting various pore sizes for a similar % P that can be obtained via the SSMF process. Samples (a) 72D-D, pore size = 2 μm; (b) 72D-G, pore size = 47 μm; and (c) 72D–H, pore size = 106 μm. Please note that the SEM images are not to the same scale.

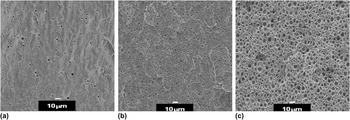
Cross-sectional SEM micrographs of foamed TPU samples of 87 Shore A resin hardness depicting various % P that can be obtained for a similar average pore size via the SSMF process. (a) Sample 42D-L, % P = 10, pore size = 6 μm; (b) sample 42D-M, % P = 27, pore size = 5 μm; and (c) sample 42D-N, % P = 45, pore size = 6 μm.

The SSMF process is also capable of producing wide range of % P (from few percent to above 80%) while controlling similar pore size. As an example, Fig. 6(a) shows SEM micrograph of freeze-fractured sample 42D-L that has a porosity of 10% and an average cell size of 6 μm. Figure 6(b) shows SEM micrograph of sample 42D-M that has % P of 27 and yet has an average pore size of 5 μm, which is similar to the one observed for sample 42D-L. Similarly, Fig. 6(c) shows SEM micrograph of foam sample 42D-N that has % P of 45 but the average pore size is of 6 μm. The above two examples demonstrate the novel behavior of the SSMF process where we are able to create foam samples in a wide range of % P and cell sizes by controlling mainly two processing parameters: P sat and T f.
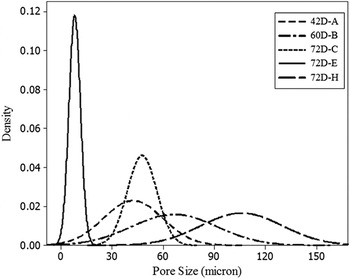
Yet another novel feature of the SSMF process is its ability to control pore size distribution. As an example, Fig. 7 shows a pore size distribution plot for a few selected samples from Table III. Figure 7 depicts the pore size distribution for samples 72D-A, 72D-B, 72D-C, 72D-E, and 72D-H, where the average pore size varies from few microns to 106 μm. The plot of Fig. 7 demonstrates that the SSMF process can produce samples from relatively narrow to broad pore size distribution. The pore size distribution is a strong function of process condition. Typically, a narrow pore size distribution is seen with samples that have an average pore size of below 40 μm. The pore size distribution broadens for samples with larger pore size. We have observed similar pore size distribution for all other hardness TPU material studied here.
Pore size distribution for selected foamed TPU samples (42D-A, 60D-B, 72D-C, 72D-E, and 72D-H).

Results of Figs. 5–7 are reproducible for all other hardness TPU resins studied here. The results of Figs. 5–7 serve to demonstrate that the SSMF foaming process is a novel enabling pad manufacturing process that results in the closed pore structure with excellent pore size, pore size distribution, and porosity control at various TPU resin hardness levels.
B. CMP results
1. Effect of polymer resin hardness on ILD wafer polishing results for similar porosity and pore size
A series of pads made of TPU polymer with different resin hardness (87A, 60D, and 72D) but of similar number average pore sizes and similar porosity were selected for Mirra polishing. It was pointed out earlier that the skin layers were removed from all the foamed samples that were used in the construction of polishing pads for CMP. Physical properties of the samples used in CMP are listed in Table III.
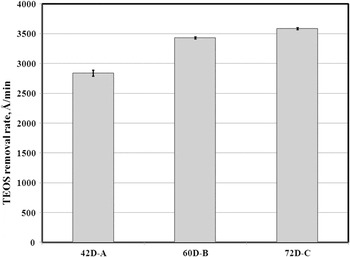
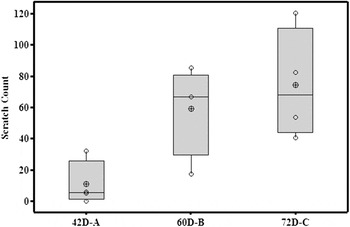
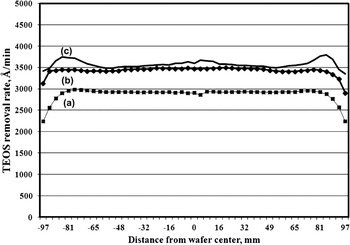
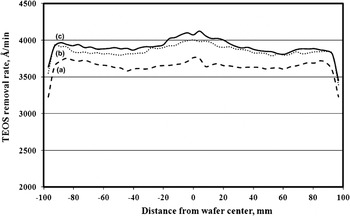
Figure 8 shows the effect of polymer resin hardness on the TEOS RR (average rates from four wafers). TPU resin hardness seems to affect ILD RR. About 25% increase in TEOS RR is seen for harder 72D pads compared with softer 87A pad samples. The effect of polymer resin hardness (for similar porosity and pore size) on TEOS wafer scratch defectivity is plotted in Fig. 9. Harder resin pads result in substantially higher scratch defects. The polymer resin hardness seems to have no significant impact on material RR profiles as seen from Fig. 10. For all hardness resin pads tested here, RR profiles are flat across the wafer if the rate drop off 1 cm from the edge is excluded.
Effect of resin hardness on the TEOS RR for similar porosity and pore size pad samples (See Table I for resin hardness of samples 42D-A, 60D-B, and 72D-C).


Effect of pad resin hardness on the TEOS RR profile for similar porosity and pore size pad samples. (a) Sample 42D-A, (b) sample 60D-B, and (c) sample 72D-C. X-axis represents the wafer thickness measurement location from the center of the wafer toward the edge of a 200-mm diameter size wafer.

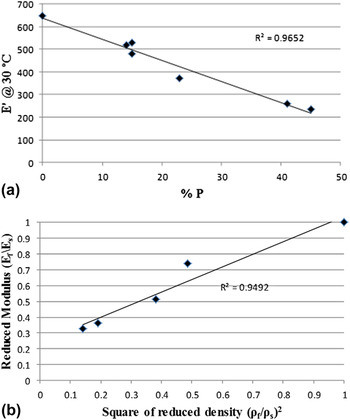
Pad hardness is known to affect mciroscratches and defects.Reference Robinson and Oliver63 In case of foamed materials, there are two types of hardness: the resin hardness as a result of fixed hard and soft segment ratio and the bulk hardness as a result of porous structure. Even though, hardness and modulus represent two different physical characteristics of a material, it has been observed that in the case of TPU resin, the modulus decreases with decreasing hardness. The bulk hardness and bulk modulus of a porous foam material is a strong function of % P as shown in Figs. 11(a) and 12(a). However, it is not clear as to which of the two hardness and/or modulus affects the wafer defectivity.
(a) Plot of TPU foam storage modulus, E′(bulk modulus) as a function of % P for a TPU resin hardness of 72 Shore D. (b) Plot of reduced TPU foam storage modulus, E′ as a function of square of reduced foam density.

(a) Plot of TPU foam sheet hardness (bulk hardness) as a function of % P for a TPU resin hardness of 72 Shore D. (b) Plot of reduced TPU foam hardness as a function of square of reduced foam density.

In case of ILD CMP, SiO2 being removed is much harder than the pad asperity hardness. Hence, in this case, the defectivity results in the event of indentation or impingement of abrasive particles that are trapped on the asperity or in-between the asperity tips. It has been shown that total contact area between a CMP pad and a wafer is largely responsible for both material RR and defectivity.Reference Elmufdi and Muldowney30 Total contact area depends on pad surface morphology such as asperity height and distribution as it results from pad microstructure and material properties such as pad hardness and stiffness. It has been shown that higher contact area results in lower defect due to lower contact pressure.Reference Elmufdi and Muldowney30 Here, it is reasonable to assume that the pad contact area will increase with decreasing resin hardness as asperities gets softer due to lower amounts of hard segments present in the resin. This could then explain why we are seeing lower defectivity with decreasing pad hardness for similar porosity and pore size pads.
Gibson and AshbyReference Gibson and Ashby64 provided an analytical treatment for the mechanical behavior of a broad range of cellular materials. The most significant feature of the cellular solid is strong dependence of the relative density, ρf/ρs (density of the cellular material, ρf, divided by density of the solid material, ρs) on foam mechanical properties such as modulus. The simplest closed-cell cubic model was introduced by Gibson and Ashby to describe the deformation of the foam as shown in Eq. (2)
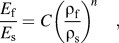 $${{E_{\rm{f}} } \over {E_{\rm{s}} }} = C\left( {{{{\rm{\rho }}_{\rm{f}} } \over {{\rm{\rho }}_{\rm{s}} }}} \right)^{\!n} \quad ,$$
Where E f and E s are modulus of foamed and solid specimen, respectively, and the value of the two constants C and n depend on whether the foam has open or closed cell structure.Reference Roberts and Garboczi65Equation (2) predicts that the relative modulus is proportional to the square of the relative density for closed cell foams.
Figure 11(a) shows a plot of storage modulus, E′ at 30 °C as a function of % P. Figure 11(b) shows a plot of reduced foam modulus as a function of square of the reduced density. Similarly, Fig. 12(a) shows a plot of 72D microcellular foam hardness as a function of % P. In both these figures, the % P was calculated using Eq. (1) and the reduced density was calculated using Eq. (2). All the modulus and density values for the unfoamed samples are listed in Table I and that of the foamed specimen are listed in Table III. Here, we chose to plot the foam data for a fixed resin hardness of 72D, but similar results were also seen with other resin hardness foams. As one can see, the % P and relative density, both significantly affect the bulk hardness as well storage modulus of the foamed material even though the resin hardness is the same. Hardness and storage modulus, both properties of microcellular foams decrease in proportion to the % P as indicated by R 2 value of 0.85 and 0.98, respectively. This result may have significant implication on the ILD polishing RR and scratch defect count discussed in reference to Fig. 9. This is the reason why in most ILD polishing experiments % P was kept constant. By keeping the % P constant, one is able to decouple the effect of resin hardness/modulus from the bulk pad hardness/modulus. An important point to be noted is that storage modulus and Shore hardness of foamed specimen have a strong dependence on % P and not so much on pore size.
The plot of Fig. 11(b) is in good agreement with those predicted by Eq. (2). As predicted by the theory, we see a strong correlation between reduced modulus and square of reduced density (R 2 = 0.96), which indicates that storage modulus of TPU microcellular foams can be reasonably estimated by the Gibson–Ashby model.Reference Gibson and Ashby64
For vinyl polymers, energy absorption measures such as impact strength was shown to decrease linearly with the reduced foam density.Reference Juntunen, Kumar, Weller and Bezubic66 This result was shown to be contrary to the popular belief that the microcellular structure will always improve the energy absorption behavior due to the increased resistance to crack propagation offered by the microvoids.Reference Juntunen, Kumar, Weller and Bezubic66 In Fig. 12(b), we have plotted reduced hardness as a function of square of reduced density. Here in Fig. 12(b), we do not see such a strong correlation between reduced hardness and square of reduced density as was seen in Fig. 12(a) (R 2 = 0.55), but a linear decrease in TPU hardness with decrease in square of the relative density is clearly seen. Hardness of a polymer is a relative description of a material’s ability to resist penetration of a metal conical indenter known as a durometer. It is the property of a material, which gives the ability to resist being permanently deformed, when a load is applied. The greater the hardness of the material, the greater resistance it has to deformation. However, the term has also been associated with material stiffness or resistance to scratching, abrasion, or cutting. The results of Figs. 11 and 12 indicate that at least in the case of TPU microcellular foams both the foam modulus or stiffness (E′) and hardness decrease linearly with increase in % P or square of the reduced density.
2. Effect of pore size on CMP results (fixed resin hardness and % P)
A series of pads made from the same TPU polymer resin hardness (72D) and % P but with different number average pore sizes of 2, 47, and 106 μm were selected for the ILD polishing (72D-D, 72D-G, and 72D-H). Physical characteristics of the pad samples used are listed in Table III.
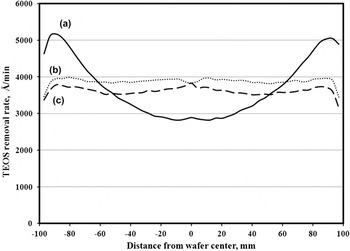
Figure 13 shows the profiles of the silicon oxide RR. For CMP pads with large pore sizes (47 and 106 μm), RR profiles are flat across the wafer if the rate drop off seen at a distance of 1 cm from the wafer edge is excluded. Such RR profiles are typical for industrial standard IC1010 and D100 pads and have been attributed to the rebounding effect when retaining ring of the wafer carrier is pressed against the pad.Reference Li, Gaudet and Nair59,Reference Bajaj, Hymes, Vaduri and Fisher67,Reference Sugimoto, Arimoto and Ito68 On the other hand, under identical polishing conditions, the pads with small pore sizes (2 μm) show a nonuniform RR profile. The ILD RR at the edge of the wafer is much higher and the RR in the center is much lower for the small pore size pad compared with the larger pore size pads. This is not typical of most commercial pads whose average pore size is >40 μm. For this pad, with small pores, the RR gradually increases from wafer center toward the wafer edge. The RR difference between the 1 cm from wafer edge and the wafer center is >2000 Å/min. We were unable to obtain a flatter profile for small pore size pads even after adjusting various CMP tool parameters such as polishing down force, retaining ring pressure, conditioner sweep profile, platen rpm, slurry flow and slurry arm location, and different types of conditioner disk that are known to fix the problem. Results of this study indicate that smaller pore size pads are not desirable for the polishing of TEOS wafers. The result obtained here is in agreement with those observed by Li et al.Reference Li, Gaudet and Nair59 for TPU pads of pore size <20 μm.
Effect of pore size on the RR profile for a similar % P and foamed pad hardness samples. (a) Sample 72D-D, % P = 18, pore size = 2 μm; (b) sample 72D-G, % P = 15, pore size = 47 μm; and (c) sample 72D-H, % P = 14, pore size = 106 μm. X-axis represents the wafer thickness measurement location from the center of the wafer toward the edge of a 200-mm diameter size wafer.

The explanation for this behavior has been discussed by Li et al. elsewhere.Reference Li, Gaudet and Nair59 The small pore size can negatively affect the RR profile in two ways. First, the small pore size reduces the slurry holding capacity. Although the RR in ILD CMP has been shown to be a chemical process,Reference Li, Gaudet, Sun and Naman69 ILD CMP is widely considered as a mechanical processReference Taur, Mii, Frank, Wong, Buchanan, Wind, Rishton, Sai-Halasz and Nowak1–Reference Zantye, Kumar and Sikder5 and hence, certain minimum amount of slurry is essential to maintain ILD RR. Low slurry holding capacity means that there are less slurry particles available for the asperities to transport them into pad wafer contact zone, implying lower RR. Second, small pore sizes result in the smoother pad surface with low asperity heights. Pad relies on conditioning to rejuvenate pad asperities.Reference Elmufdi and Muldowney30,Reference Markham31 As the pad pore size becomes smaller, especially below 10 μm, it is more difficult for the diamonds, which are more than 10 times larger the pores to maintain efficient cutting of the pad surface. Thus, the smooth surface created will increase the adhesion force between the wafer and the pad surface. According to Homma,Reference Homma70 high friction will lead to higher RR. Since, small size pore pads show a higher ILD RR at the edge, it is hypothesized here that the small pore pads must have higher adhesion friction as well as higher slurry flow rate at the edge due to suction force created by the motion of wafer. However, the high adhesion at wafer edge also prevents the fresh slurry flow into wafer center, resulting in slurry “starvation.” Thus, the combination of high adhesion friction force at the edge of the wafer and slurry starvation at center of the wafer results in a nonuniform RR profile in small pore size pads.
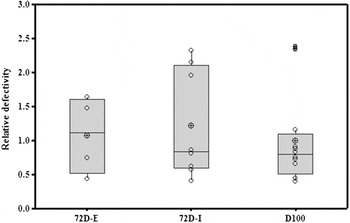
Figure 14 shows the defectivity data (total scratch counts) for TEOS wafers as a function of two pore size, 8 and 42 μm for similar % P pads (samples 72D-E and 72D-I). In this plot, for reference purposes, we have also included the defectivity data for the industry standard D100 pad, whose average pore size is 50 μm. The results of Fig. 14 indicate that similar defect counts are seen from smaller to medium size pores and the defects are comparable with the industry standard pads such as D100 pads. As it was discussed in Sec. I, since pad hardness and modulus of these three pads are similar, it is expected that they all will have similar total pad contact area and hence similar defectivity.
Effect of average pore size on normalized wafer defect count for samples 72D-E, 72D-I, and D100 (defects were normalized with respect to the defect counts observed for the control D100 pad sample polished under identical conditions). All the TPU polishing pad samples used here have fixed resin hardness of 72D and similar % P.

3. Effect of % P on CMP results (fixed resin hardness and similar pore size)
A series of pads made from the same TPU polymer resin hardness (72D) having similar average pore size (from 50 to 70 μm) but different porosities (from 15% to 45%) were selected for the Mirra polishing (samples 72D-G, 72D-K, and 72D-J).
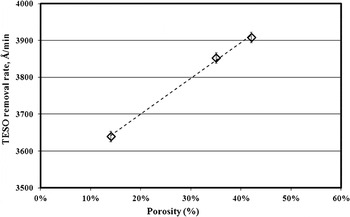
Figure 15 shows the average TEOS RR as a function of % pad porosity. As seen from the plot of Fig. 15, there is only a nominal increase in the ILD RR by 8% for a 30% increase in the pad porosity. It is expected that as the % porosity increases, the ILD RR should also increase proportionately due to the following two reasons. First, increasing % P in larger pore size pads should proportionately increase the slurry holding capacity.Reference Li, Gaudet and Nair59 Increased slurry holding capacity means that there are more slurry particles available for the asperities to transport them into pad wafer contact zone, implying higher ILD RR. Secondly, as the % P increases, the required amount of material to be removed from the pad surface by a diamond conditioner also decreases proportionately due to higher void volume. This leads to more open pores on pad surface. Higher void fraction should lead to an increase in pad asperity amount that comes in contact with the wafer and hence, the coefficient of friction (COF) between pad and wafer should also increase. Due to increase in COF, higher RR is expected.Reference Homma70 However, according to Fig. 15, we only see a nominal increase in the ILD RR for a substantial increase in the pad % P. We believe that the reason for this nominal increase in RR is associated with a substantial decrease in the foam bulk hardness and modulus with increasing % P [see Figs. 11(a) and 12(a)]. The lower bulk modulus will increase the pad contact area, which in turn will lower local contact pressure, and hence lower RR.Reference Markham31
Effect of % P on the TEOS RR. (a) Sample 72D-G, % P = 15; (b) sample 72D-K, % P = 35; and (c) sample 72D-J, % P = 45.

TEOS RR profiles as function of pad porosity for samples of Fig. 15 are plotted in Fig. 16. Figure 16 shows a very similar TEOS RR profile for a change in pad porosity by 30%, though the profile curve shifts to a higher RR with increasing pad porosity. For large size pore pads the RR profile is uniform except for slightly higher RR in the center of the wafer. Again, this type of behavior is normal for most commercial pads and can be fixed by adjusting known CMP process parameters.
Effect of % P on the TEOS RR profile. (a) Sample 72D-G, % P = 15; (b) sample 72D-K, % P = 35; and (c) sample 72D-J, % P = 45. X-axis represents the wafer thickness measurement location from the center of the wafer toward the edge of a 200-mm diameter size wafer.

IV. CONCLUSIONS
We have demonstrated here that the SSMF process can be used to manufacture CMP pads in a wide variety of pore size and porosity range using a wide range of TPU hardness resins. The SSMF process offers unique process capability to manufacture CMP pads of tunable properties to fit specific CMP needs. Effect of top sheet properties, such as pad hardness, pore size, pore size distributions, and percent porosity on ILD RRs and wafer defects, were also investigated. Results indicated that significant level of scratch defect reduction was achieved by the polishing pads made from softer polyurethane resins, while only a moderate increase in the ILD RR was seen with increasing TPU resin hardness. There is a nominal increase in the ILD RR with increasing percent porosity for fixed pore size and resin hardness pads, even though the effective pad modulus decreased with increasing porosity. In the pore size range studied here, pore size has little or no influence on wafer defectivity (for a fixed hardness and porosity pads) but has significant influence on the ILD RR profile. Small pore CMP pads cause a nonuniform RR profile.
ACKNOWLEDGMENTS
The authors wish to acknowledge Dr. Jayakrishnan Nair and Dr. Robert Vacassy for their constructive comments and suggestions. The authors also wish to acknowledge Cabot Microelectronics Corporation support and permission to publish this work.