


Introduction
In recent decades, income inequalities have increased for the majority of the world's population, whether they live in developing, emerging or developed countries.Footnote 1 Latin America, however, is, perhaps surprisingly, one of the few exceptions to this global trend: levels of income inequality in the region actually fell during the 2000s.Footnote 2 This recent reduction in income inequality does not alter the fact that Latin America remains today one of the most unequal places on earth,Footnote 3 a problem which has plagued the region over the whole of the twentieth century.Footnote 4 Even if incipient, however, this development, which goes against the grain of trends elsewhere, merits scholarly attention. What were the determinants of this turn in the region's evolution?
Scholars have pointed to broad socio-economic shifts in the region as an important part of the explanation for this recent fall in income inequality. In particular, the period between 1990 and 2014 saw a deep change in the political cycle in Latin America. Governments that, after the 1980s debt crisis, had applied neoliberal policies following the recommendations of international organisations in the ‘Washington Consensus’ period,Footnote 5 were gradually replaced by ‘new Left’ governments. This period, referred to as the ‘pink tide’,Footnote 6 was characterised by the election of governments that exhibited greater sensitivities to demands from society,Footnote 7 with more progressive – at times, populist – agendas, promising, among other things, to reduce inequality.Footnote 8 Giovanni Andrea Cornia argued that a ‘New Policy Model’ was emerging in the region, whereby governments were establishing new systems of social protection and welfare state configurations.Footnote 9 For sure, a shift towards a more redistributive policy was suggested in the manifestos of multiple governments, including those led by Luiz Inácio Lula da Silva (Brazil), Néstor Kirchner and Cristina Fernández de Kirchner (Argentina), Rafael Correa (Ecuador), Evo Morales (Bolivia), and Tabaré Vázquez and José Mujica (Uruguay). This political cycle coincided with an expansive economic cycle, supported by a rise in commodity prices. Hence, an emerging political will to respond more fully to societal demands coincided with an increase in material resources that could be used to support these policy changes.Footnote 10 As part of this wave of policy reform, governments in the region adopted new approaches to fiscal policy, claiming these would help improve redistribution and forge more inclusive development.Footnote 11
Until the recent period, scholarly analysis of fiscal policy in Latin America concluded it had proved pretty much impotent as regards reducing income inequality.Footnote 12 However, recent scholarship on the topic has begun to show glimpses of optimism. Richard Bird and Eric Zolt argue that the consolidation of democracy in the region has helped forge a new environment whereby a progressive fiscal contract is emerging.Footnote 13 Citizens – particularly from the middle class – are becoming more inclined to pay taxes as they perceive adequate public services are being delivered. Capturing this shift, Cornia et al. claim a ‘New Fiscal Pact’ is finally emerging in Latin America.Footnote 14
These recent studies are providing first insights into how fiscal policy is influencing the evolution of income inequality in Latin America. This new wave of scholarship falls into two main sets. The first set conducts highly disaggregated analyses of a single country or a small set of countries, and tests for the effects of various fiscal instruments on income inequality.Footnote 15 These studies provide rich empirical detail at the country level, but fail to provide a basis for a broader study of the effects of fiscal policy across the region. The second set of research incorporates a very broad sample of countries – usually including countries in Latin America and other developing countries – but analyses only a small number of fiscal policies.Footnote 16 Lacking is a region-wide study of the effects of key fiscal instruments – covering both taxation and public spending – across Latin America. This paper seeks to fill this gap, and is the first to provide a wide and detailed analysis of the role of fiscal policy in reducing income inequality across the Latin American region as a whole. It therefore complements other works on the topic, by providing a more comprehensive study than that found in single case studies, as well as providing knowledge about the effects of fiscal policy across the region, facilitating comparison with developments in other regions in the world.
To do this, we maximised the sample of countries, fiscal policies and time-period, given data restrictions. We analysed 17 Latin American countries over the period 1990 to 2014. We broke this period up into two sub-periods, 1990 to 2002 and 2003 to 2014. The first sub-period was characterised by ‘Washington Consensus’ oriented policies accompanied by increasing income inequality. The second sub-period was characterised by a change in economic policies, towards progressive policies and decreasing income inequality.Footnote 17 In common with most large-scale studies of recent fiscal policy, we focused on consequences for income inequality at the national level. In addition, our analysis addressed a relevant characteristic of the region by considering the extent to which robustness of the national results was observed at both the urban and rural levels. This is particularly important in the case of Latin America because the region is classified as ‘over-urbanised’, with 81 per cent of its population living in urban areas and two-thirds of its population living in cities of over 300,000 inhabitants.Footnote 18 Thus, our approach shed light not only on the extent to which fiscal policy was effective in reducing income inequality across the region as a whole but, in addition, on the extent to which fiscal policy was working at the urban and/or rural levels.
To study fiscal policy structure, we examined the effects of nine fiscal policy instruments on income inequality. Hence, we included public spending on education – the social spending function most commonly associated with redistribution in the literature – but also considered spending on health, social security and housing, which have received less scholarly attention. To analyse public revenues, we considered social contributions, as well as the main components of the tax structure: personal income tax and taxes on property, on goods and services, and on international trade and transactions. Following Cornia and Luis López-Calva and Nora Lustig,Footnote 19 we evaluated the impact of fiscal policy on income inequality using the Gini index as a proxy.
Given that fiscal policy is included in the literature as a potential determinant of inequality, it is important to know more empirically about the effects of various fiscal policy instruments on the evolution of inequality. The main contribution of this paper is to provide a detailed empirical examination of the relationship between fiscal policy and the evolution of income inequality in Latin America between 1990 and 2014. We present evidence of how nine specific, important, fiscal instruments have had an effect on income inequality at the national, urban and rural levels in most Latin American countries. Likewise, we identify a changing relationship over time, finding different patterns in the relationship between fiscal policy and income inequality in the periods 1990–2002 and 2003–14.
Overall, we find fiscal policy played a significant – albeit small – effect in reducing inequality across the Latin American region over the whole period (1990–2014). As regards timing, we find higher redistributive effect associated with fiscal policy from 2003. From the spatial perspective, we find that national redistributive results were driven by urban level dynamics. As regards fiscal instruments, we observe significant redistributive effects on income distribution as a result of public spending on education, social contributions and public revenues from personal income taxes. However, as we shall see, the positive gains made by fiscal policy are fragile and reversible. In the final years of the period under study, we observe that income inequality reductions stagnated across the region.
The rest of this paper is organised into four sections. In the next section, we explore the recent decline in income inequality in Latin America; then we present evidence from the recent wave of studies into the effect of fiscal policy on income inequality reduction in the region; in the following section we conduct our analysis for the region; finally, we explain our results and conclusions. The Appendix contains statistical data.
Income Inequality in Latin America
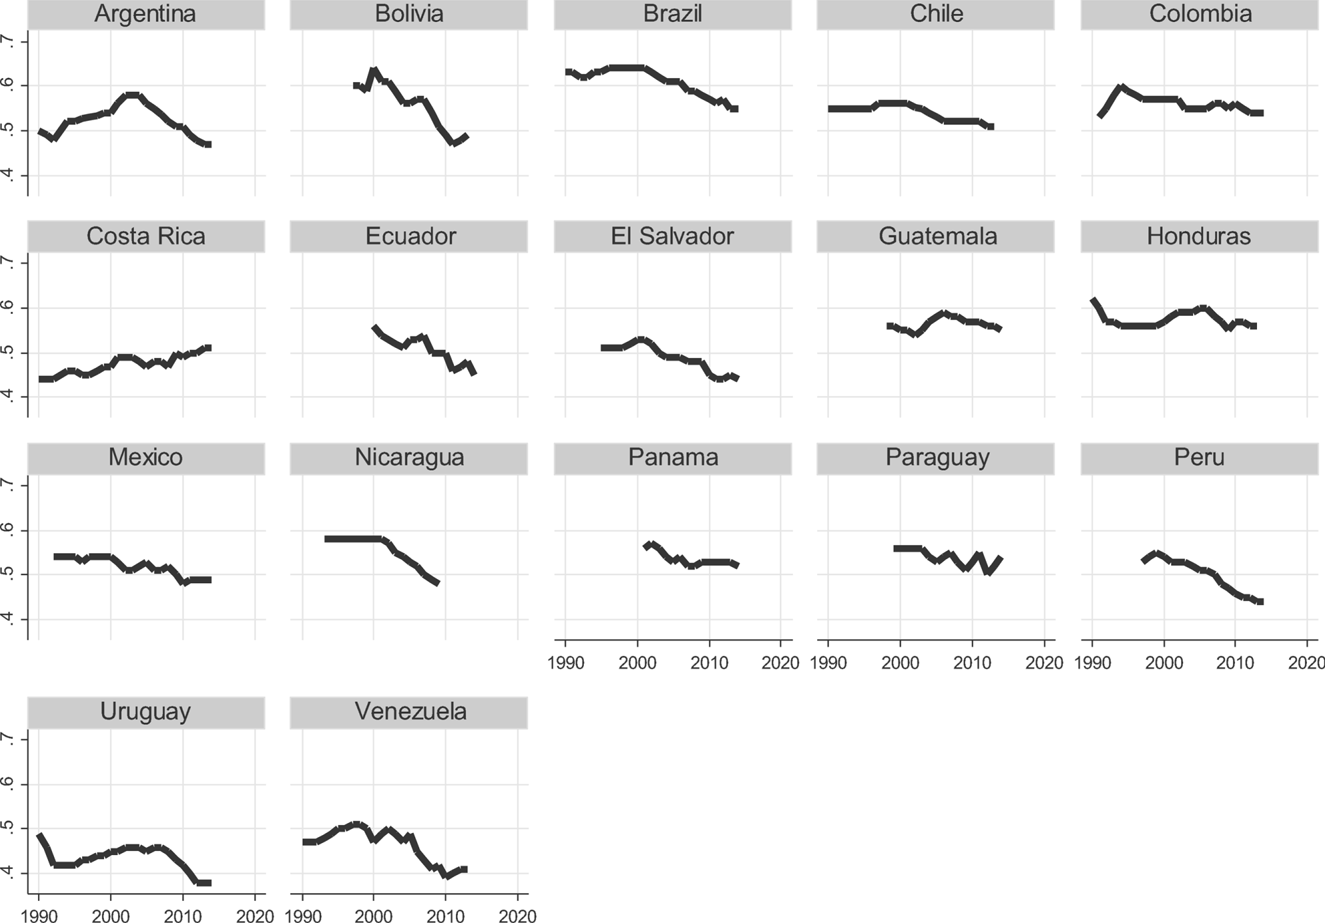
Latin America constitutes a middle-income region characterised by development and social cohesion problems associated with long-term inequalities in wealth, income and opportunities.Footnote 20 Our description of the dynamics of income distribution in Latin America is based on the evolution of the Gini coefficient (Figure 1). This coefficient is the most commonly used measurement of inequality, as it allows for comparison with other countries over a relatively long time-period. Gini is essentially an index of concentration which provides synthetic information on income distribution in a single coefficient. Anthony Atkinson has pointed out the limits of this coefficient as regards its capacity to capture issues around income polarisation, the top or bottom incomes and asymmetries in the composition of income; in particular, income from capital.Footnote 21 So, although the Gini coefficient is not a perfect measure of inequality, it is the index of choice among many scholars working on this topic,Footnote 22 and is used here, with the caveat that due caution must be exercised when interpreting our results.Footnote 23
Gini Index at the National Level for 17 Latin American Countries, 1990–2014

On analysing the evolution of the Gini coefficient in Latin America, two phases in the trajectory of inequality in Latin America can be seen between 1990 and 2014. The Gini coefficient rose from 0.54 in 1990 to 0.55 in 2002; in other words, the average level of income inequality, which was already high, worsened further.Footnote 24 This trend was generalised throughout most of the region: inequalities rose in Argentina, Bolivia, Brazil, Chile, Colombia, Costa Rica, Ecuador, El Salvador, Paraguay and Venezuela, whilst they remained constant in Mexico, Nicaragua and Peru, falling only in Guatemala, Honduras, Panama and Uruguay. From the beginning of 2000s, however, change in the region was palpable, as Latin American economies grew more than the world average and new, more progressive, governments came to power, most emblematically those led by Lula and Néstor Kirchner in two of the biggest Latin American economies, Brazil and Argentina respectively, in 2003. Income inequality started to fall across the region, as reflected in a significant decline in the Gini coefficient, from 0.55 in 2002 to 0.49 in 2014.Footnote 25 Again, this trend was generalised, as income inequality fell across most countries: Argentina, Bolivia, Brazil, Chile, Colombia, Ecuador, El Salvador, Honduras, Mexico, Nicaragua, Panama, Paraguay, Peru, Uruguay and Venezuela. Costa Rica and Guatemala were the only countries where income inequality actually increased during this period. From 2012, there was a slowdown in the reduction of inequality in the region.Footnote 26 Nevertheless, by 2014, most Latin American countries had lower levels of income inequality than in 1990. Despite this, Brazil, Chile, Colombia, Costa Rica, Guatemala, Honduras, Panama and Paraguay still endured Gini coefficients higher than 0.50, above the regional mean.
To test the robustness of these trends, the evolution of other, complementary, variables related to inequality can be considered. For instance, the Theil and Atkinson coefficients (which measure income inequality) reflect the same regional and national trends as those described previously.Footnote 27 Moreover, the evolution of poverty in the region also declined over this period, falling in relative terms, from 45.9 per cent in 2002 to 28.5 per cent in 2014. In absolute terms, more than 50 million people were lifted out of poverty in the period between 2002 and 2014.Footnote 28 Finally, analysing the ratio between the highest and lowest quintiles in terms of income, we observe that, in general terms, this trend increased during the 1990s and fell from 2000.Footnote 29 Overall, then, most indicators confirm the trend towards a small increase in income inequality during the 1990s, and a continuing improvement the next decade.
This recent fall in income inequality should be put into perspective. Inequality levels in Latin America are still above the world average.Footnote 30 However, the decline is significant, and scholars have sought to determine the fundamental external and internal reasons that explain this development.Footnote 31 Cornia observes that the fall in income inequality was nearly universal in the region. Countries with different economic structures (more or less dependent upon exports, remittances and foreign investment) and with distinct political orientations generally – albeit unevenly – experienced reductions in income inequality.Footnote 32 He concludes that strong economic growth, particularly between 2003 and 2008, provided the foundations upon which income inequality was reduced through public policy reform. Saúl Keifman and Roxana Maurizio agree, finding that strong economic growth, accompanied by fiscal and trade surpluses, had a positive impact on labour markets and income distribution.Footnote 33 Evridiki Tsounta and Anayochukwu Osueke find that economic growth was conducive to declining income inequality in the region, though its impact was limited.Footnote 34 They also find that domestic policies on education and taxation, as well as higher foreign direct investment flows, were associated with reduced income inequalities. Hence, the literature agrees that economic growth provided a solid basis for progressive public policies to work. However, there is no consensus around the empirical redistributive effect of fiscal instruments in Latin America. To analyse this, we now turn to the specific role of fiscal policy on income inequality.
Fiscal Policy and Inequality in Latin America
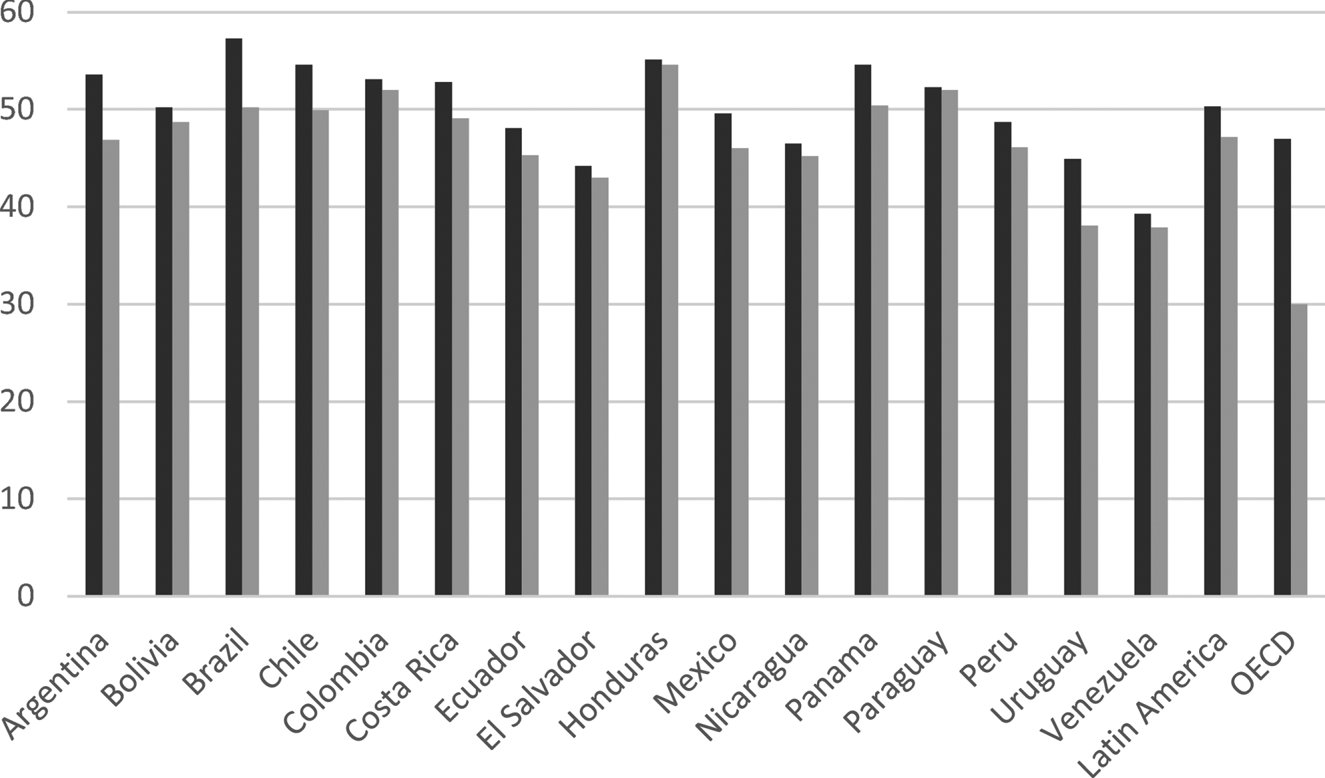
Scholars have demonstrated empirically that fiscal policy has helped reduce income inequalities across OECD countries.Footnote 35 However, the empirical evidence shows that this process is weaker in developing countries, as in the case of Latin America (see Figure A.1, in the Appendix).Footnote 36 Fiscal policy typically fails in developing regions for a mix of reasons, including historically low levels of taxation and spending, instability in fiscal policy and the fact that the tax structure and spending mix have tended to be less progressive than in developed areas.Footnote 37
Latin America's trajectory in fiscal policy is no exception. For years, most empirical studies on the effects of fiscal policy on income inequality in the region found little or no evidence that it had had much traction in reducing inequalities. James Mahon provided a useful summary of the findings of more than 30 empirical studies published between 1993 and 2010 on the effects of public spending and taxation on income distribution in 18 Latin American countries.Footnote 38 In summary, these studies found at best only weak evidence that fiscal policy mattered: where it did, spending accounted for greater redistribution than taxation.
It was only in the 2000s that this began to change. Recent scholarship on the topic, using data from 2000 onwards, found some evidence that fiscal policy was having a positive effect on income inequality. This scholarship can be divided roughly into two bodies: first, work that examines fiscal policy in a single country or small set of countries, which is rich in empirical detail but not comparable at the Latin American level; and second, studies which include many Latin American countries but a small number of fiscal instruments, limiting what is known about the success of a broad set of fiscal tools. We present the main findings of both before proceeding to our analysis.
Of the recent single-country studies, of particular importance is the work produced as output of the ‘Commitment to Equity’ project led by Nora Lustig. This project explores the effects of taxation and social spending on income inequality and poverty in Latin America (and beyond). Project output has included an application of standard fiscal incidence methodology to Argentina,Footnote 39 Bolivia,Footnote 40 Brazil,Footnote 41 Mexico,Footnote 42 PeruFootnote 43 and Uruguay.Footnote 44 Each of these studies analysed a broad, non-uniform, range of different fiscal instruments. The six studies included in-kind transfers in education and health, and Conditional Cash Transfer (CCT) programmes, and found that both contributed to lowering income inequality. The studies of Brazil, Mexico, Peru and Uruguay also considered direct taxes, finding them to lower income inequality in the latter two cases only. Though empirically rich, weaknesses of these studies include potential omission of relevant variables in the search for causal effects and difficulties in comparing the performance of fiscal policy across Latin American countries more broadly. Cornia has edited another important study on fiscal policy.Footnote 45 This volume includes national studies on Ecuador,Footnote 46 Chile,Footnote 47 Uruguay,Footnote 48 Mexico,Footnote 49 El SalvadorFootnote 50 and Honduras.Footnote 51 Methodologically, these studies are constituted as structured comparisons of pairs of countries using the Gini coefficient as a proxy of inequality.
The second set of studies works with country-wide samples but a small number of fiscal instruments. Juan Carlos Gómez Sabaini and Ricardo Martner analysed the Gini indices before and after taxation across 19 Latin American countries for the period 1990–2006.Footnote 52 These authors found that taxation started to be slightly more effective in reducing inequalities from 2005 onwards than most of the studies cited in Mahon had indicated.Footnote 53 Ivonne González and Martner conducted a cross-sectional analysis of the effects of seven fiscal policy instruments in 18 Latin American countries for the period 1990 to 2010.Footnote 54 This work remains one of the most comprehensive and comparable studies of the effects of fiscal policy in Latin America to date as regards the sample size and range of fiscal policy instruments studied. The authors found that various fiscal policy instruments – in addition to other institutional and macroeconomics variables – were associated with reduction in income inequality, including social spending on education, public investment and a progressive tax system. Tsounta and Osueke found that greater spending on education explained nearly one quarter of the total decline in income inequality, while an increase in tax revenue, including increases in direct taxes (personal and corporate income taxes), was also significant for 18 Latin American countries in the first decade of the 2000s.Footnote 55 Cornia et al. found that recent direct taxation was associated with a decline in income inequality across 18 Latin American countries between 1990 and 2008.Footnote 56 Finally, Michael Hanni, Martner and Andrea Podestá conducted standard fiscal incidence analysis to assess the redistributive effect of taxation, social contributions and public transfers in 17 countries between 2011 and 2012, finding that public transfers were most important in reducing income inequality.Footnote 57
Summing up, the recent scholarship seems to indicate a change in the effect of fiscal policy in relation to income inequality in Latin America. However, evidence is not conclusive at the regional level. Moreover, it is difficult to compare results because of the different methodological approaches deployed, the number of observations, and the countries included. Our analysis maximises the number of Latin American countries, fiscal policies and time-periods studied to contribute to the body of knowledge on the relationship between fiscal policy and income inequality in the region. In particular, this helps to determine which fiscal instruments have been effective in reducing inequality at the Latin American level and provides a means of comparison with other regions in the world.
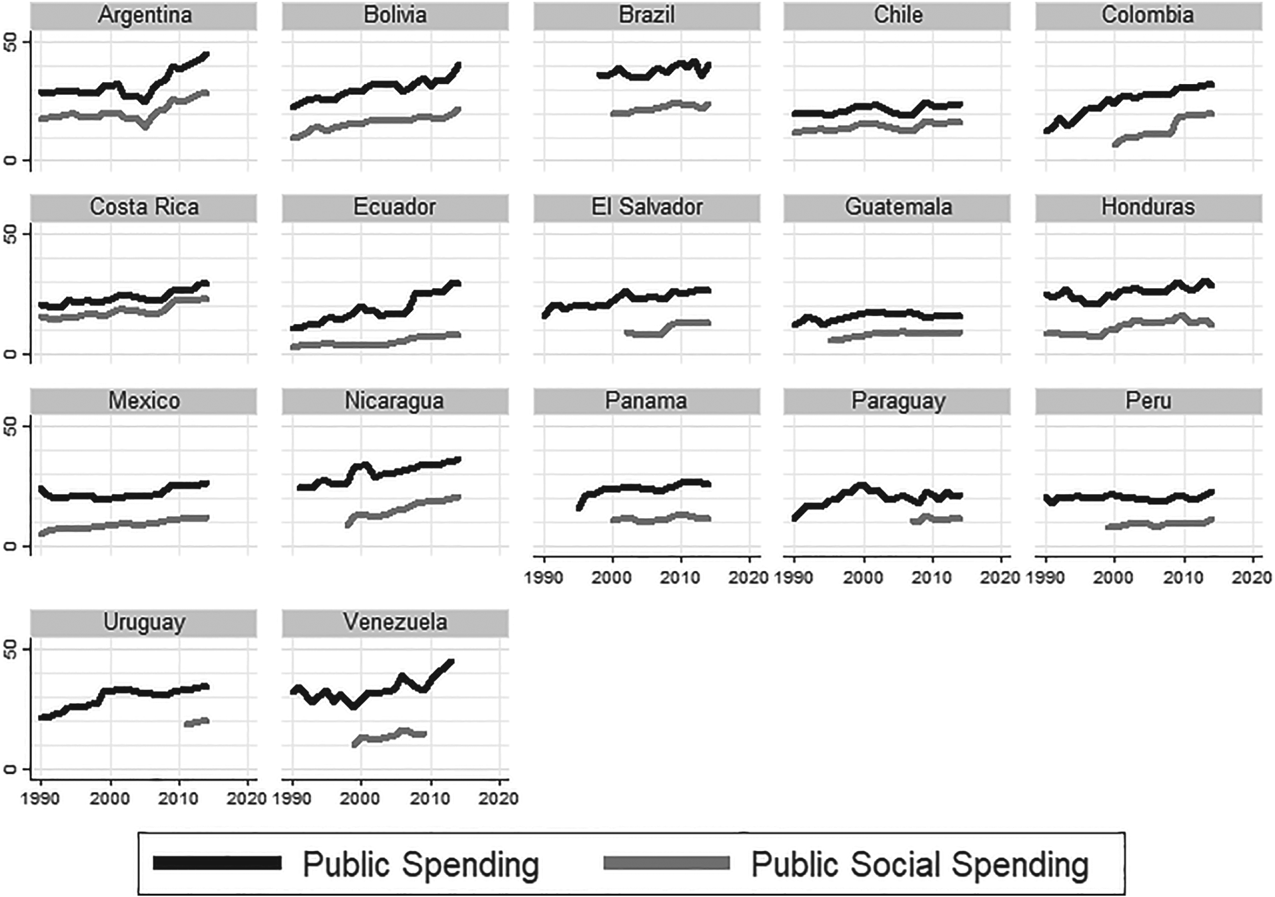
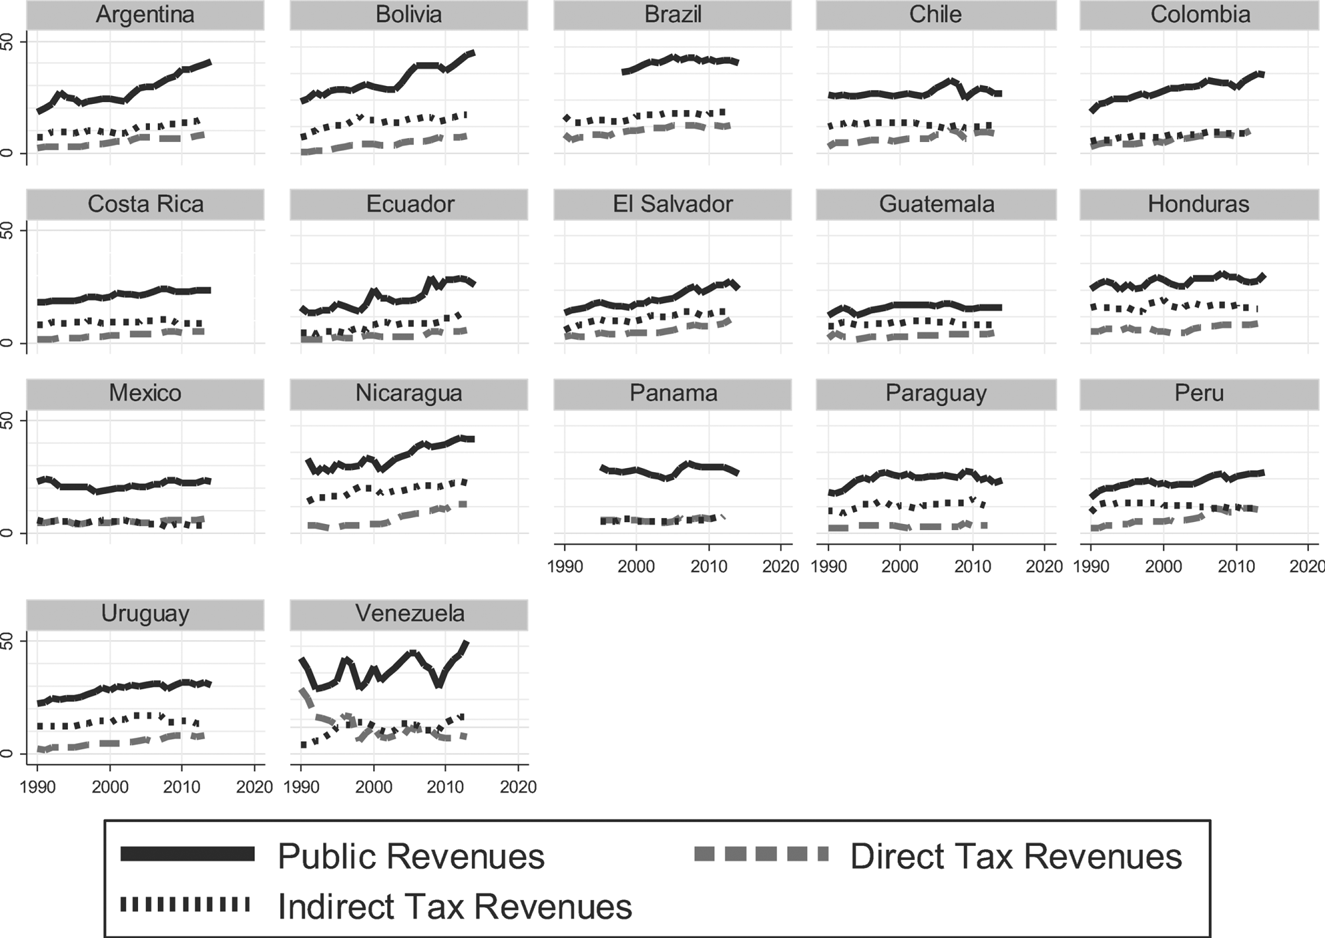
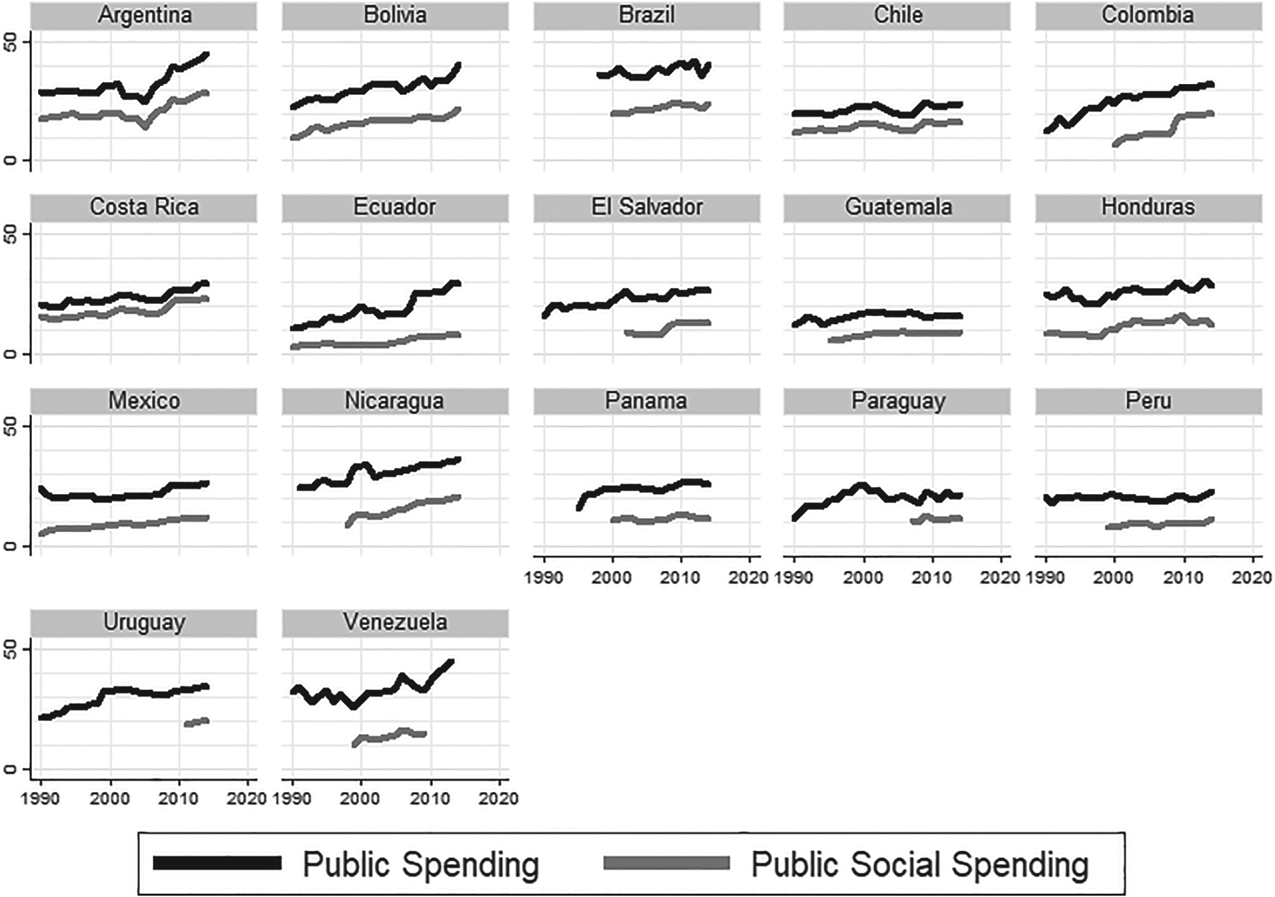
Before presenting the empirical analysis and the findings, we briefly discuss the recent evolution of fiscal policy in Latin America. On analysing the evolution of public spending and public revenues between 1990 and 2014 in aggregate terms, we observe three major trends (Figures 2 and 3).Footnote 58 First, public finance in general grew – but only slowly – between 1990 and 1998: average public spending across Latin America increased from 19.9 to 23.6 per cent of GDP while average public revenues increased from 18.5 to 22.3 per cent. Second, from the end of the 1990s to 2014, there was a significant increase: public spending and public revenues reached 29.8 and 26.5 per cent of GDP respectively. Third, it is also important to consider changes in the composition of public spending and revenues. Social spending increased from 10.3 per cent of GDP in 1990 to 16.4 per cent of GDP in 2014. Most notably, this increased in Argentina and Brazil, to 28.1 and 24.2 per cent of GDP in 2014 respectively. This regional trend can mainly be explained by greater public spending on education and health, and the expansion of social policies linked to CCT programmes, for instance, Bolsa Família in Brazil,Footnote 59Familias en Acción in Colombia and Bono de Desarrollo Humano in Ecuador. This is complemented by the growing importance of social contributions, particularly in Argentina, Brazil, Costa Rica, Nicaragua and Uruguay, where the ratio of social contributions to GDP exceeded 7 per cent in 2014. On the other hand, although indirect taxes remain higher than direct taxes, the gap has slightly narrowed. In 1990, revenues from direct taxes represented only 54 per cent of revenues from indirect taxes in Latin America. In 2014, this ratio increased to 62 per cent. Hence, over the last decade, fiscal reforms have become slightly more progressive as regards their propensity to redistribute income.
Public Spending: Total and Social, 1990–2014 (% GDP)
Public Revenues: Total, Direct Taxes and Indirect Taxes, 1990–2014 (% GDP)

Testing the Impact of Fiscal Policy on Income Inequality
We analysed the effects of nine fiscal instruments (public spending on education, health, social security and housing, social contributions, and taxes on personal income, property, goods and services, and international trade) on income inequality across 17 Latin American countries for the period between 1990 and 2014.
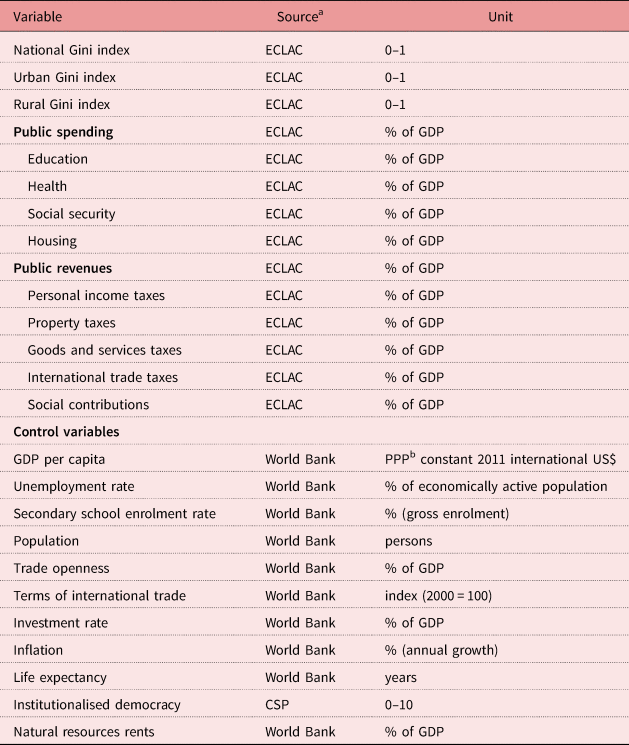
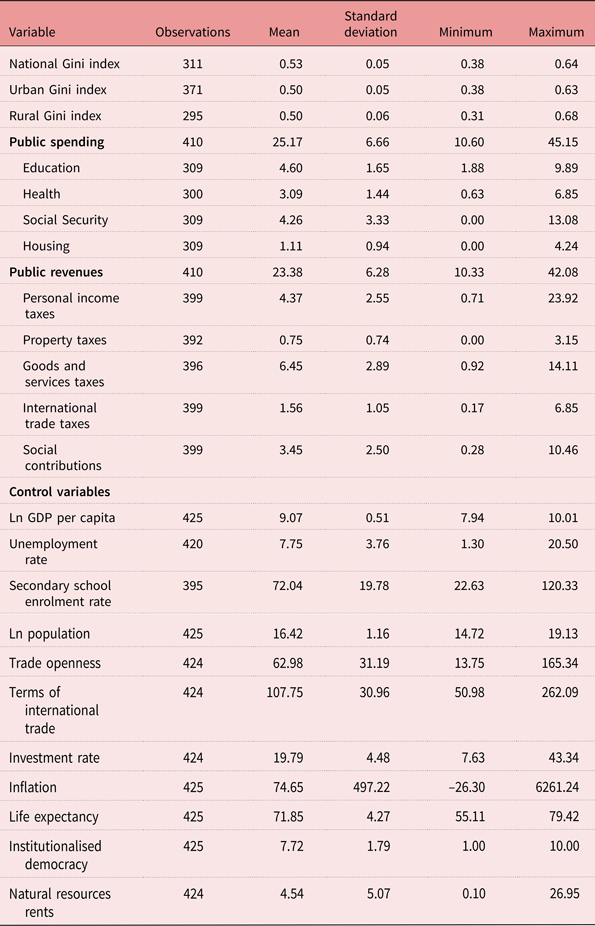
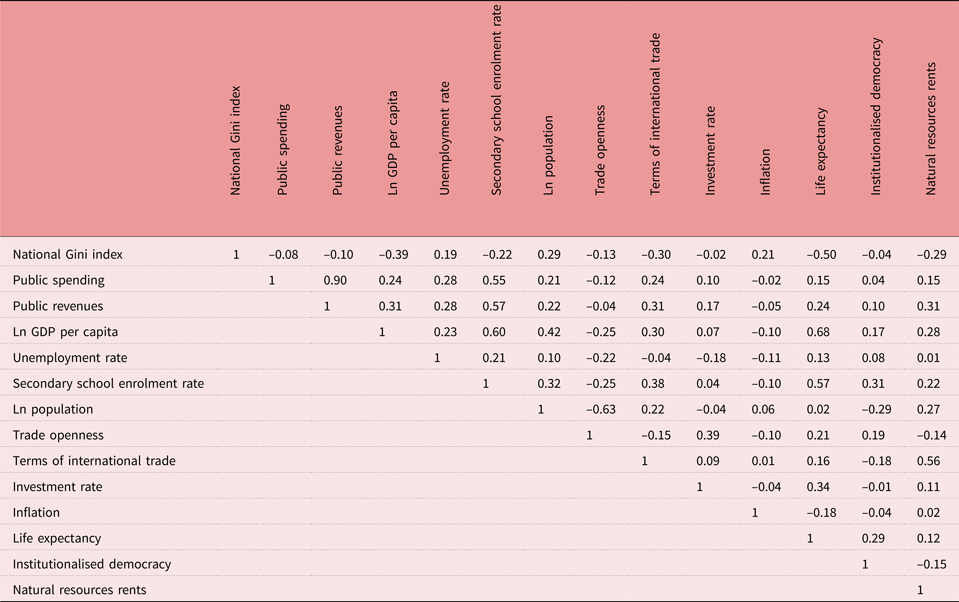
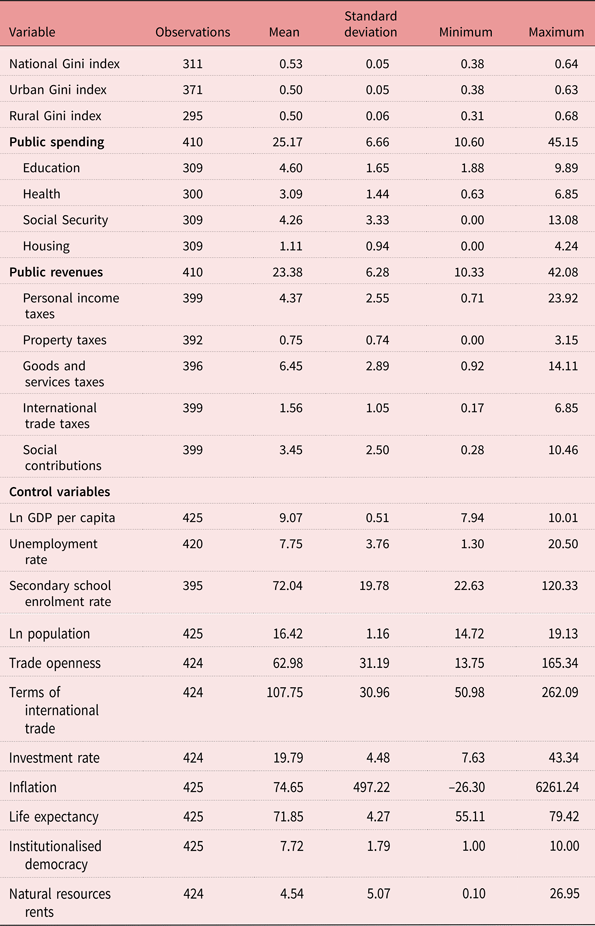
Table 1 presents the variables used to measure income inequality, fiscal policy and the control variables. For income inequality, we used the Gini index, as noted in the section ‘Income Inequality in Latin America’, above. The Economic Commission for Latin America and the Caribbean (ECLAC) has provided data on the Latin American Gini index since 1990 at the national, urban and rural levels.Footnote 60 Hence, to analyse the effects of fiscal policies in Latin America, we used ECLAC's estimations of the national Gini index as the main dependent variable, and urban and rural Gini indices as dependent variables testing the robustness of the results. For fiscal policy, we considered the four most relevant components of public social spending: education, health, social security and housing; and the five most relevant components of public revenues: personal income taxes, property taxes, indirect taxes on goods and services, indirect taxes on international trade, and social security contributions. In order to minimise the bias in the estimated coefficients for fiscal variables, we used a series of control variables that the empirical literature has identified as potential determinants of income inequality.Footnote 61 These controls included GDP per capita, the unemployment rate, the secondary school enrolment rate, population, trade openness, terms of international trade, the investment rate, inflation, life expectancy, institutionalised democracy and natural resources rents. The descriptive statistics for these variables are included in Table A.1 (in the Appendix). The satisfactory operation of these control variables was tested by analysing the correlation coefficients between them and with the Gini index and fiscal variables (Table A.2, in the Appendix). We found no correlation problems in the set of variables considered.
Variables and Data Sources

a ECLAC/CEPALSTAT; World Bank, World Development Indicators, 2018; Center for Systemic Peace, Polity IV Project: Regime Authority Characteristics and Transitions Datasets, 2017, available at http://www.systemicpeace.org/inscrdata.html (last accessed 26 Dec. 2019).
b Purchasing power parity.
Due to data availability issues, our sample of 17 Latin American countries across 25 years (1990–2014) constituted an unbalanced panel. The Ordinary Least Squares (OLS) regression methodology, used by authors such as António Afonso et al., González and Martner, Branko Milanovic and Jeffrey Williamson,Footnote 62 when analysing the determinants of inequality, could introduce bias in our estimations. We therefore adapted the methodology to our unbalanced panel and, following Darryl McLeod and Lustig, Juan Antonio Montecino, and Tsounta and Osueke,Footnote 63 used a basic model of Fixed Effect (FE) panel regression, controlling for the length time bias by including a time trend. To control for dynamic effects and overcome possible problems derived from endogeneity, we checked the robustness of the previous results comparing them with those obtained applying the bias-corrected Least-Squares Dummy Variable Corrected (LSDVC) estimator. Given our case, a small panel with 17 countries, this estimator outperformed Generalised Method of Moments (GMM) estimators in dynamic unbalanced panels. The LSDVC estimator used the GMM Blundell-Bond estimator and corrected it according to small panels.Footnote 64 We considered that a variable exhibited a robust effect when both FE and LSDVC estimated coefficients were significant and had the same positive or negative relationship with the dependent variable.
We therefore performed diverse regressions adapting the following general equation to the FE and LSDVC models:
 $$Gini_{it} = \; \alpha _i\, + \,F_{itk} + X_{itm} + trend + \varepsilon _{it}$$
where i includes each of the 17 Latin American countries in the sample (Argentina, Bolivia, Brazil, Chile, Colombia, Costa Rica, Ecuador, El Salvador, Honduras, Guatemala, Mexico, Nicaragua, Panama, Paraguay, Peru, Uruguay and Venezuela); t is the year; F is a vector that includes k fiscal variables; and X is a vector of m control variables. We performed regressions for the period analysed (1990–2014) and both sub-periods (1990–2002 and 2003–14) split by the year when Lula and Néstor Kirchner arrived in government in Brazil and Argentina, as the most relevant and illustrative moment in the change of political cycle in Latin America. Finally, we tested the robustness of the national results comparing them with those obtained at the urban and rural levels.
The results obtained from the models show that fiscal policy had a positive effect in reducing inequality in Latin America across the whole period. However, the effects of these findings are small and depend on the kind of fiscal instrument, whether they were implemented at the rural or urban level and, above all, the sub-period under consideration.
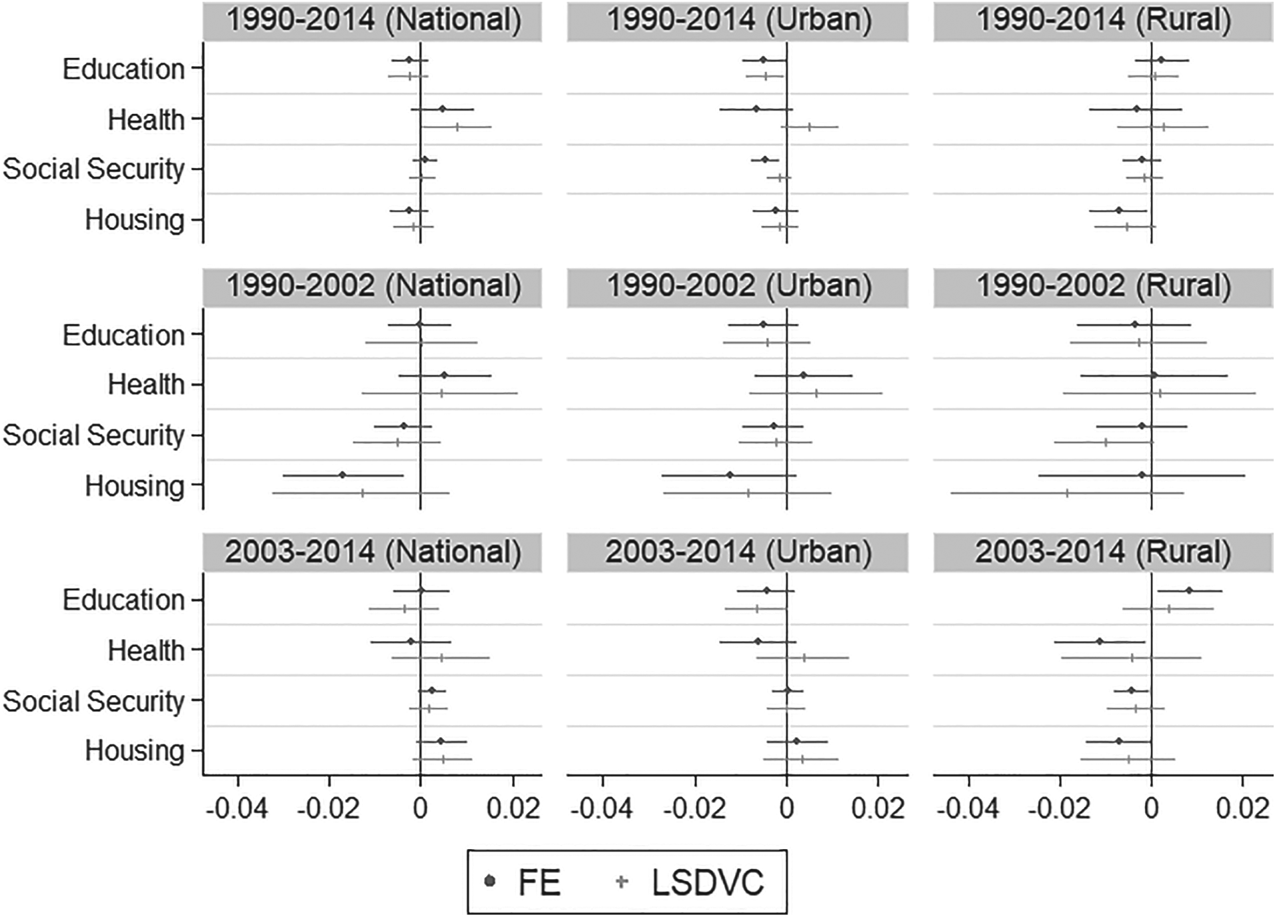
When examining the effect of fiscal policy instruments on the public spending side, as seen in Figure 4, we found a robust significant effect on public spending for the whole period only on education at the urban level. The estimated effect shows that an increase of 1 per cent in the ratio of the public spending on education to GDP was related to a decrease of 0.004 in the Gini coefficient. In the rest of the components, there was a lack of a robust significant effect both for the whole period and for both sub-periods at the national, urban and rural levels.
Fiscal Variables: Coefficients and Confidence Intervals (90%) (Public Spending)

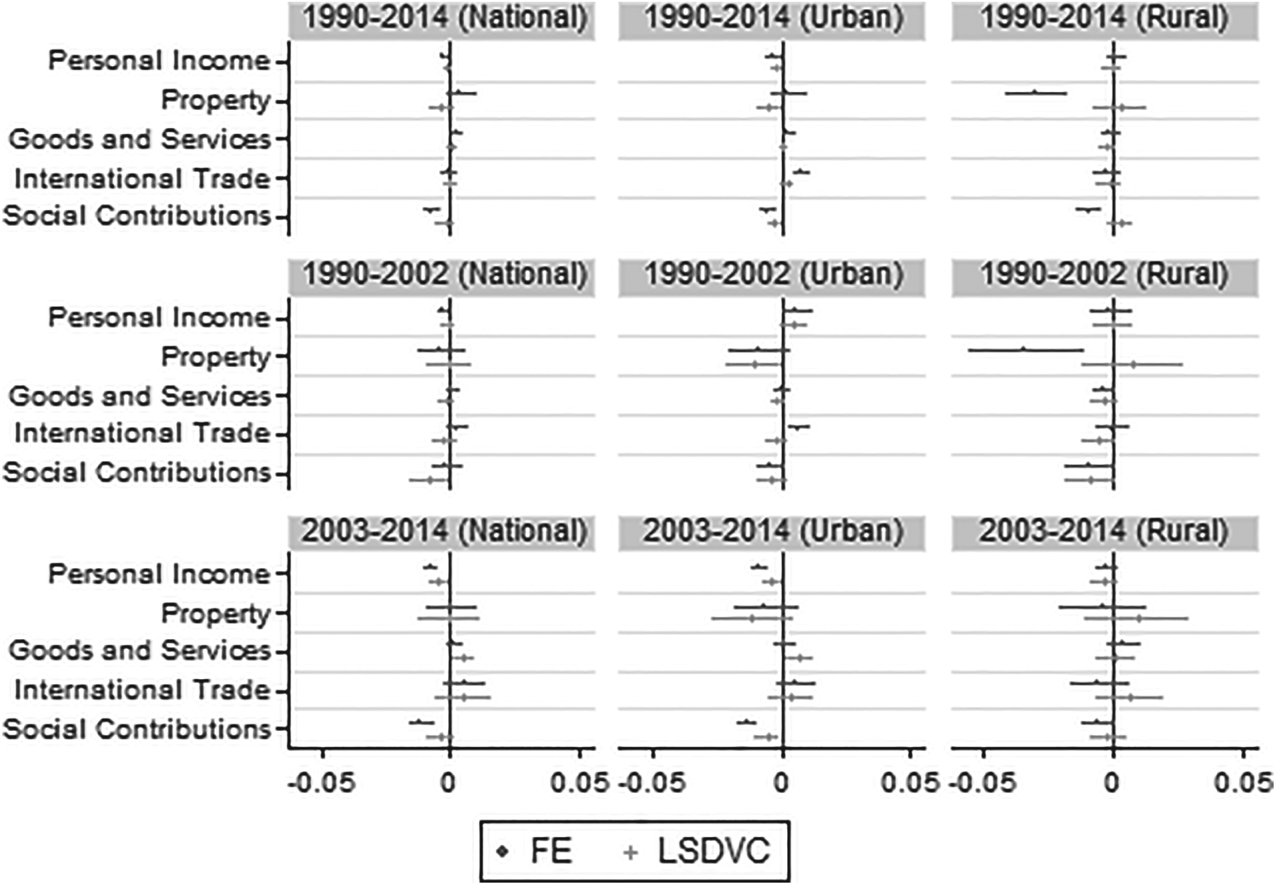
On the other side (public revenues) of fiscal policy, we found a greater number of fiscal instruments associated with income inequality reductions, as seen in Figure 5. Personal income taxes were associated with falling income inequality between 2003 and 2014 at the national and urban levels. During this period, depending on the model used, an increase of 1 per cent in the ratio of revenues from personal income taxes to GDP was related to a decrease of between 0.005 and 0.007 in the Gini coefficient, at the national level. In the same terms, the effect estimated at the urban level was related to a decrease of between 0.004 and 0.009 in the Gini coefficient.
Fiscal Variables: Coefficients and Confidence Intervals (90%) (Public Revenues from Taxes and Social Contributions)

In respect of social contributions, we found the same kind of effect, although only at the urban level, for the whole period 1990–2014 and for the sub-period 2003–14. For the whole period, an increase of 1 per cent in the ratio of social contributions to GDP was associated with a decrease of between 0.003 and 0.005 in the Gini coefficient, depending on the model used. For the sub-period 2003–14, this increased its intensity to an estimated effect of between 0.006 and 0.013 in the reduction of the Gini coefficient.
These results suggest the redistributive effect of fiscal policy in Latin America was driven by changes in fiscal policies related to the region's economic expansion and the new political cycle at the beginning of the twenty-first century. In the sub-period from 2003, certain fiscal instruments were particularly effective in reducing income inequality in the region. Urban dynamics appeared to be driving this process. We found a robust redistributive reduction in income inequality as result of public spending in education, personal income taxes and social contributions at the urban level. Only personal income taxes seem to have had a redistributive effect at the national level. On the other hand, during the sub-period 1990–2002 (at any level), and at the rural level (in any period), we did not find any robust redistributive effect.
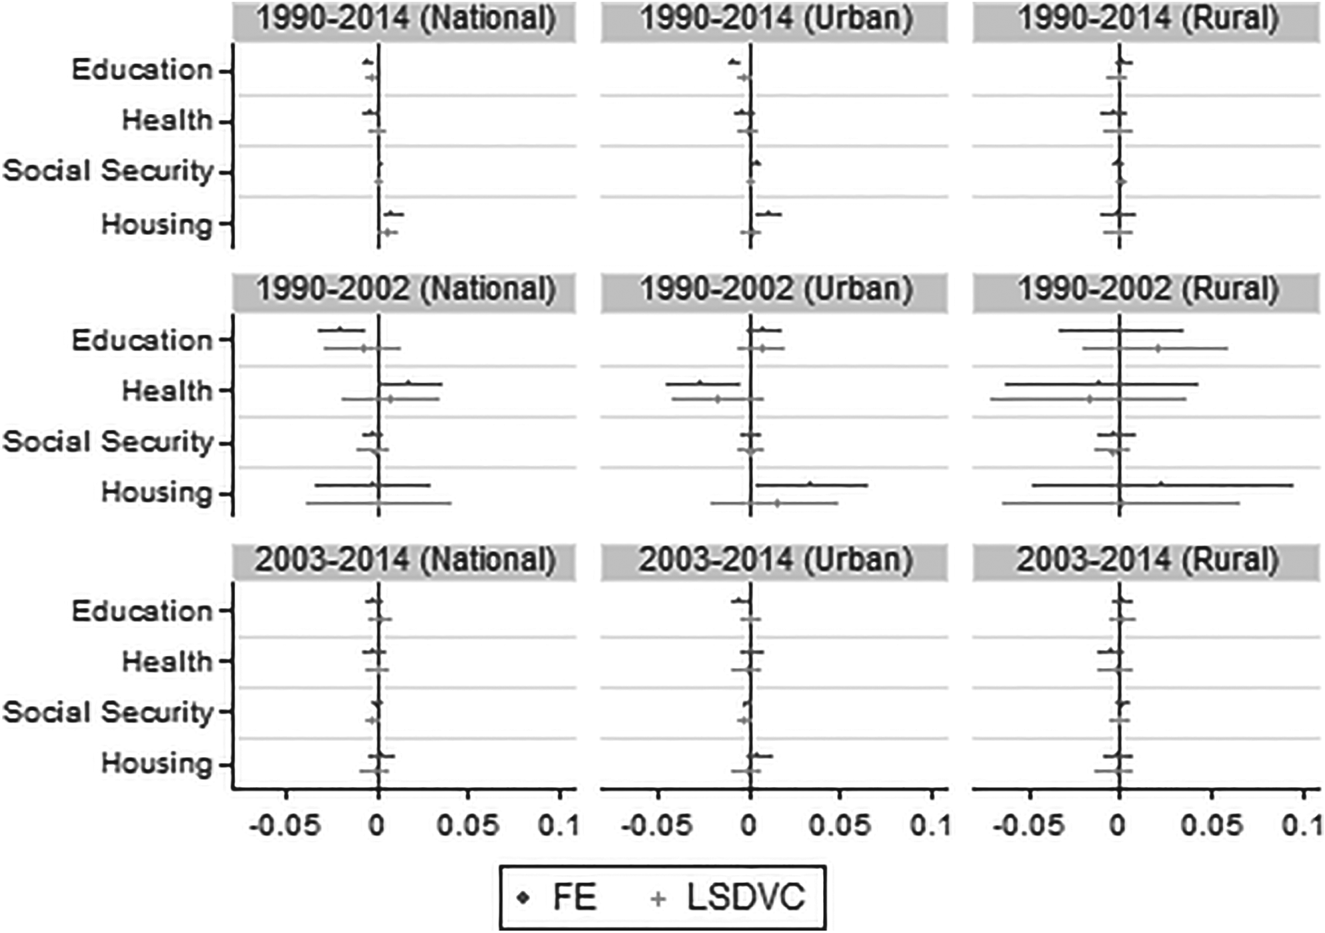
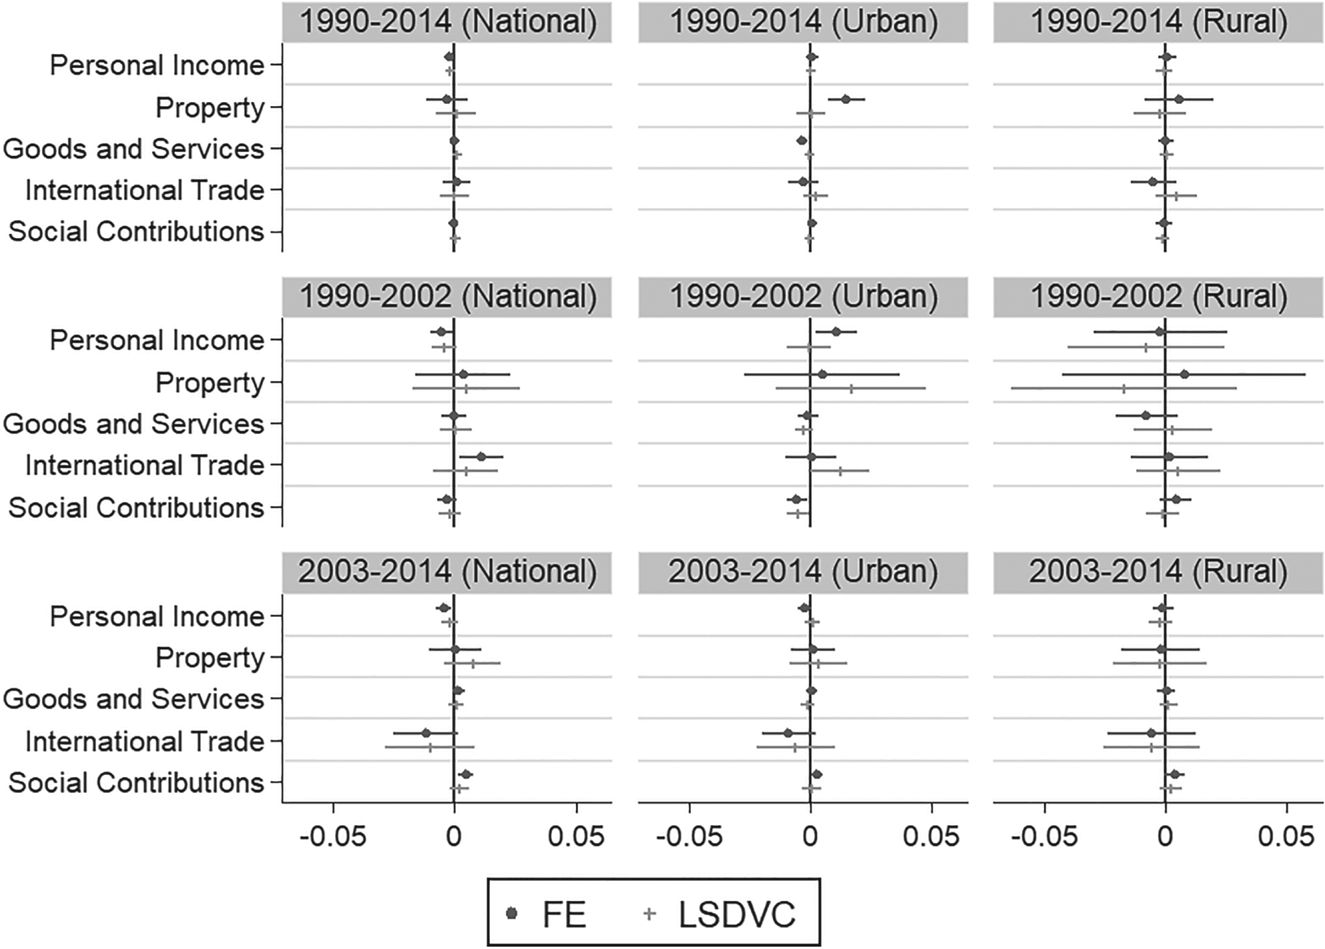
We checked the robustness of the previous results and analysed them to determine if they were driven by a general regional process or by the new political cycle with a growing role of progressive governments (Figures 6 and 7). We created an interaction effect between the fiscal variables and a dummy variable that identified progressive governments. This dummy variable took the value 1 if the government in office was progressive, and the value 0 otherwise. The source for this dummy variable was the Database of Political Institutions hosted at the Inter-American Development Bank.Footnote 65 Most of the estimations related to the interaction effect were not significant. There was only a very slightly progressive effect, in terms of income inequality redistribution, related to progressive governments in the case of personal income taxes, at the national level for the whole period, and social contributions, at the urban level between 1990 and 2002. So, this analysis confirms the robustness of all the previous results at the level of the Latin American region as a whole. The role of fiscal policy in reducing income inequality appears to be more related to a general regional process than to any specific kind of government.
Coefficients and Confidence Intervals (90%) for Interaction Effects between Fiscal Variables and Progressive Governments (Public Spending)

Coefficients and Confidence Intervals (90%) for Interaction Effects between Fiscal Variables and Progressive Governments (Public Revenues from Taxes and Social Contributions)

Conclusions
While most countries and regions of the world – both developed and developing – have witnessed increased income inequality in recent decades,Footnote 66 Latin America is an exception, seeing income inequality fall during the early years of the twenty-first century. Of course, this singular, recent trajectory does not alter the fact that this middle-income region is still one of the most unequal in the world. Different institutions and policies can mitigate or correct distributional tensions caused by national dynamics or by globalisation and transnationalisation processes.Footnote 67 These institutions and policies in Latin America, in the context of a new policy cycle combined with economic growth facilitated by the commodity boom, seem to have been instrumental in this change. Economic growth in Latin American countries during the commodity boom, driven by the increase in commodity prices and the value of exports, allowed for the creation of a fiscal space which was used to promote socially-demanded redistributive policies. On the one hand, economic growth led to a direct increase in public revenues. On the other hand, it also led to reduced unemployment, which allowed the prioritisation of redistributive polices and the channelling of more resources to social policies such as CCTs or public spending on health or education. These direct effects of economic growth on the expansion of fiscal space and redistribution of resources were accompanied by tax reforms, reinforcing the progressive effect.
Whilst most rich OECD countries are heading towards fiscal consolidation,Footnote 68 characterised by competition among countries for tax breaks to corporations and high-income earners, and increasing tax evasion and avoidance, all of which lead to increasing income inequality, Latin America has dared to differ. Policies in the region have undergone change: Cornia argued that a ‘New Policy Model’ was emerging in the region,Footnote 69 whereby governments were establishing new systems of social protection and welfare state configurations.Footnote 70 As part of this more general shift, fiscal policies also changed from 2000; Bird and Zolt, and Cornia et al. argued a new ‘fiscal pact’ was emerging.Footnote 71 Although policy change in the region could be explained away as being of minor importance, when compared to regions and countries elsewhere which are moving towards fiscal consolidation and increased inequality,Footnote 72 and in light of Latin America's historical trajectory, this shift is important.
A body of work is emerging with a view to understanding the determinants and dynamics of this falling inequality in the region. Until recently, the vast majority of the work on fiscal policy in Latin America had not detected a redistributive effect.Footnote 73 This changed only recently, when new work started to detect that fiscal policy was indeed playing a role in reducing income inequality.Footnote 74 However, as most of this research was done at the country level, a knowledge gap remained as to what was happening in the region as a whole. This article contributes to the emerging literature on the role of fiscal policy and falling income inequality by systematically analysing the region, maximising the number of fiscal instruments and time-periods possible and taking into account the geographical (urban/rural) dimension. We found that fiscal policy played a significant, albeit small, effect in reducing inequality in the region and we explain where it was effective, when, and which instruments performed best.
First, as regards where fiscal policy worked, we found the national dynamic was driven by an urban pattern in terms of the impact of fiscal policies on income distribution. With 81 per cent of its population living in urbanised areas, Latin America is the second most urbanised region in the world. The region also contains five of the 30 largest urban areas in the world; Sao Paolo, Mexico City, Buenos Aires, Rio de Janeiro, Bogota and Lima are all considered to be urban agglomerations with populations of over 10 million people.Footnote 75 Strong urbanisation facilitated the task of newly elected democratic governments seeking to respond to socio-economic demands for change. Our finding that urban dynamics drove the overall reduction in income inequality provides empirical support to Cornia's argument that a new ‘fiscal pact’ is emerging. At the same time, however, there were limits to the reach of fiscal policy, even in the urban areas. For fiscal policy to reach all segments of society, it needs to be accompanied by policies that incorporate people into the formal sector.Footnote 76 However, over half of Latin America's urban population is employed in the informal sector.Footnote 77 Moreover, the region's urban population is deeply fragmented into urban centres and marginal settlements. Approximately 110 million people – or a quarter of the urban population – live in Latin American city slums.Footnote 78 The upshot of this is that a huge proportion of the urban population either benefits only weakly, or is actually excluded, from the benefits of redistributive fiscal policy.
Second, as regards timing, we found the redistributive effect of fiscal policy in Latin America was stronger during the second sub-period considered, that, is from 2003 to 2014. The change in the relationship between fiscal policy and income inequality in Latin America was produced during a period in which Latin American governments were determined to apply different kinds of policies, with a greater focus on redistribution. Rather than attributing this shift in the region to specific, ‘progressive’ or ‘populist’ governments, we found this trend was broad across the region. This new political cycle was accompanied by an intense economically expansive phase. Economic growth fuelled Latin American governments’ ability to apply new economic policies which were more sensitive as regards social demands, and included a more effective means of reducing income inequalities. Changes in fiscal policy were at the centre of the new economic policy in the region.
Third, as regards fiscal policy instruments, we found public spending on education, personal income taxation and social contributions were particularly effective instruments, having a progressive redistributive effect at the urban level across the whole period. Personal income taxes were also associated with income inequality reductions at the national and urban levels between 2003 and 2014. Social contributions were associated with a decline in income inequality at the urban level for the whole period and, particularly, in the sub-period 2003–14.
These findings are relevant when considering future policy reform in the region. Latin America saw a decade of modest redistributive fiscal policy, especially from 2003. However, the end of the commodity boom, fiscal consolidation, the slowdown in the reduction of inequality in the region from 2012, recent changes in national governments and, in particular, as seen in the findings of this paper, the change in policy priorities by fiscally-conservative governments such as the former Mauricio Macri government in Argentina and the Michel Temer and Jair Bolsonaro governments in Brazil, could put at risk the recent progress made as regards a more redistributive approach.
A major challenge for Latin America is to stabilise the modest achievements attained so far in terms of redistributive fiscal policies while ensuring the sustainability of progressive fiscal policy. Indeed, on seeing evidence on the positive consequences of recent fiscal policy, Latin American governments could opt to increase further the number of fiscal instruments with redistributive effects or increase the intensity of these effects in those fiscal instruments that have worked, to further reduce inequality. One particularly important challenge would be to achieve a progressive redistributive effect in other components on the side of public spending, beyond the instrument of education. An additional challenge would be to run prudent but effective fiscal policies, by eliminating tax avoidance instruments and fighting tax evasion whilst, simultaneously, introducing policies to incorporate more citizens into the formal sector.Footnote 79 This could be achieved by promoting inclusion and improving education for young people,Footnote 80 whilst constructing better public infrastructure to connect marginalised urban areas. It appears that the recently elected Mexican government, under Andrés López-Obrador, is pursuing this agenda, based on his experience as the Head of Government of Latin America's largest city.Footnote 81 In addition, an effort to extend the redistributive effect to the rural level, adapting fiscal policies to the specific characteristics of these socio-economic structures, is required.
Today, Latin America is at a turning point in terms of the direction of its economic policy, including fiscal policy and income distribution. From the 2000s, the region started on a new path towards income inequality reduction through fiscal policy, after decades of high and persistent inequality. But this path is fragile, and could easily be reversed. The fiscal policies that governments in the region choose to adopt over the next decade will be decisive.
Acknowledgements
Judith Clifton's work was supported by the Ministry of Education of the Republic of Korea and the National Research Foundation of Korea (NRF-2016S1A3A2924563).
Appendix
Descriptive Statistics
Correlation Matrix

Gini Index for Market (Black) and Disposable (Grey) Income (Grey) for 2011 in Latin America and the OECD