Implications
This study assessed the effect of dietary spineless cactus on performance, and developed and evaluated equations to predict dry matter intake (DMI) and average daily gain (ADG) in meat lambs. Lambs fed cactus at levels higher than 50% of the diet had lower DMI, CP intake (CPI) and NDF intake, but similar metabolizable energy (ME) intake and ADG, thus resulting in higher feed efficiency, than control animals. Equations to predict DMI and ADG developed in this study had high accuracy and should be preferred to those present in literature, which does not consider the particularities of cactus.
Introduction
The DMI of small ruminants, such as lambs, is usually predicted with the most widely used feeding systems, which are the British (Agricultural and Food Research Council (AFRC), 1998), the North American (National Research Council (NRC), 2007; Small Ruminant Nutritional System (SRNS); Cannas et al., Reference Cannas, Tedeschi, Fox, Pell and Van Soest2004), the French (Institut National de la Recherche Agronomique (INRA), 2007) and the Australian (Commonwealth Scientific and Industrial Research Organization, 2007). In some countries like Brazil, several authors (Cabral et al., Reference Cabral, Neves, Zervoudakis, Abreu, Rodrigues, Souza and Oliveira2008; Vieira et al., Reference Vieira, Pereira, Azevêdo, Neves, Chizzotti, Santos, Araújo, Mistura and Chaves2013; Pereira et al., Reference Pereira, Lima, Marcondes, Rodrigues, Campos, Silva, Bezerra, Pereira and Oliveira2017) reported that the equations proposed in these systems are not adequate to predict the DMI for sheep. This could be due to the influence of factors such as climate, genetics, neuroendocrine system, hormones, feeding management, diet composition and welfare (Pulina et al., Reference Pulina, Avondo, Molle, Francesconi, Atzori and Cannas2013), which are usually not accounted in predicting models.
In the semiarid areas of the Northeast of Brazil, where about 57% of the national sheep flock is raised (ANUALPEC, 2016), there are native plants used as feed like cacti (Santos et al., Reference Santos, Batista, Mustafa, Amorim, Guim, Moraes, Lucena and Andrade2010), which are not widely used in ruminant nutrition in other regions such as North America (except for Mexico), Europe and Oceania. Nevertheless, spineless cactus such as Opuntia ficus-indica and Nopalea cochenillifera are considered one of the most important feeds for sheep in arid and semiarid regions (Ben Salem et al., Reference Ben Salem, Nefzaoui, Abdouli and Ørskov1996). As a result of its palatability, water content and adaptability to harsh soil and climatic conditions (Costa et al., Reference Costa, Treviño, Medeiros, Medeiros, Pinto and Oliveira2012), it has become a useful feed for ruminants in arid regions (Gebremariam et al., Reference Gebremariam, Melaku and Yami2006; Tegegne et al., Reference Tegegne, Kijora and Peters2007; Costa et al., Reference Costa, Filho, Queiroga, Madruga, Medeiros and Oliveira2010), especially during the dry season, to compensate the lack of other forages and even water (Santos et al., Reference Santos, Batista, Mustafa, Amorim, Guim, Moraes, Lucena and Andrade2010).
Cactus has a particular chemical composition, characterized by a low concentration of dry matter (DM) about 70 g/kg as fed, CP and fiber (Santos et al., Reference Santos, Santos, Farias, Dias and Lira2001), but a high proportion of non-fibrous carbohydrates about 500 g/kg DM and high DM digestibility (Ben Salem et al., Reference Ben Salem, Nefzaoui, Abdouli and Ørskov1996). Consequently, sheep fed high levels of cactus may have decreased DMI, mainly due to its high moisture content and high rumen filling (Gebremariam et al., Reference Gebremariam, Melaku and Yami2006). For these reasons, many authors attempted to define the level of cactus that could be more suitable for ruminants (Bispo et al., Reference Bispo, Ferreira, Véras, Batista, Pessoa and Bleuel2007; Costa et al., Reference Costa, Filho, Medeiros, Givisiez, Queiroga and Melo2009; Vieira et al., Reference Vieira, Pereira, Azevêdo, Neves, Chizzotti, Santos, Araújo, Mistura and Chaves2013). However, there are many differences among studies that should be taken into account to avoid a bias in the estimation of parameters (slopes and intercept) of regression models (Azevêdo et al., Reference Azevêdo, Valadares Filho, Pina, Chizzotti and Valadares2010). The use of meta-analysis, which incorporates the study effect and its interaction as random components of a mixed model, should result in better prediction equations of biological systems and a more accurate description of prediction errors (St-Pierre, Reference St-Pierre2001). Thus, the aim of this study was to assess the effect of the inclusion of spineless cactus on the performance of meat lambs and to develop mathematical models to predict the DMI and ADG of meat lambs fed various amounts of spineless cactus.
Material and methods
Data used in the statistical analyses were obtained from eight different experiments that reported DMI and weight gain of lambs fed various amounts of spineless cactus in a semiarid region of Brazil. The main characteristics of each study are briefly described below.
Brief description of experiments used in the database
Experiment 1 – Cordova-Torres et al. (Reference Cordova-Torres, Costa, Medeiros, Araújo Filho, Ramos and Alves2017). The experiment was conducted using 42 non-castrated Santa Inês lambs at 100 days of age, averaging 18.8±0.46 kg of BW at the beginning of the trial. The animals were kept in individual pens and were fed ad libitum. Diets with forage to concentrate ratio of 70/30 were composed of spineless cactus (N. cochenillifera), Tifton (Cynodon dactylon) hay, soybean meal, corn meal, soybean oil and mineral salt. The trial was carried out in a completely randomized design in a 3×2+1 factorial arrangement. Treatments were three levels of substitution of low quality Tifton hay with spineless cactus (30%, 50% and 70% of diet DM), with or without access to water, and a control treatment with access to water and without cactus in the diet.
Experiment 2 – Cordeiro (Reference Cordeiro2012). This experiment was conducted using 40 non-castrated Santa Inês lambs averaging 22.1±0.25 kg of BW at the beginning of the trial. The animals kept in individual pens, and had ad libitum access to diets and water. The trial was carried out according to a completely randomized block design. Diets had forage to concentrate ratio of 70/30 and were composed by concentrate, and Buffel grass (Cenchrus ciliaris) hay replaced by spineless cactus (O. ficus-indica Mill) at 0%, 12.3%, 24.6%, 36.6% and 49.2% of diet DM.
Experiment 3 – Costa et al. (Reference Costa, Treviño, Medeiros, Medeiros, Pinto and Oliveira2012). The experiment was conducted using 45 non-castrated Santa Inês lambs, averaging 27.5±0.48 kg of BW at the beginning of the trial. The animals were kept in individual pens and ad libitum access to diets and water. The trial was carried out according to a completely randomized block design. Diets were composed by Tifton-85 (C. dactylon) hay and corn meal was replaced by spineless cactus (O. ficus-indica Mill), at 0%, 7%, 14%, 21% and 28% of diet DM.
Experiment 4 – Porto Filho et al. (Reference Porto Filho, Costa, Cruz, Almeida, Queiroga, Batista, Freire and Sousa2015). The experiment was conducted using 42 non-castrated Santa Inês lambs at 180 days of age, averaging 21.6±0.48 kg of BW at the beginning of the trial. The trial was carried out as a completely randomized design with a 3×2+1 factorial arrangement. Diets with forage to concentrate artio of 70/30 were fed ad libitum and composed by spineless cactus (O. ficus-indica Mill), Tifton (C. dactylon) hay, soybean meal, corn meal, soybean oil and mineral salt. The trial was carried out in a completely randomized design in a 3×2+1 factorial arrangement. Treatments were three levels of substitution of high quality Tifton hay with spineless cactus (30%, 50% and 70% of diet DM), with or without access to water, and a control treatment with access to water and without cactus in the diet.
Experiment 5 – Lima (Reference Lima2011). The experiment was conducted using 24 non-castrated Santa Inês lambs at 119 days of age, averaging 14.6±2.28 kg of BW at the beginning of the trial, which lasted for 89 days. The trial was carried out according to a completely randomized block design. The animals kept in individual pens, and had ad libitum access to diets and water. Diets had forage to concentrate ratio of 70/30 and treatments were substitution of Tifton (C. dactylon) hay with cactus (N. cochenillifera Salm Dyck) at 0%, 6.5%, 16.6% and 35.1% of diet DM.
Experiment 6 – Bezerra (Reference Bezerra2015). The experiment was conducted using 32 non-castrated Santa Inês crossbred lambs averaging 20.4±0.35 kg of BW at the beginning of the trial, which lasted for 70 days. The animals kept in individual pens, and had ad libitum access to diets and water. The trial was carried out according to a completely randomized block design. Diets had forage to concentrate ratio of 75/25 and treatments were replacement of Tifton (C. dactylon) hay by spineless cactus (N. cochenillifera Salm Dyck), at 0%, 25%, 50% and 75% of diet DM.
Experiment 7 – Moura (Reference Moura2013). This experiment was conducted using 32 non-castrated Santa Inês crossbred lambs averaging 20.8±2.90 kg of BW at the beginning of the trial. The animals kept in individual pens, and had ad libitum access to diets and water. The trial was carried out according to a completely randomized block design. Diets had forage to concentrate ratio of 60/40 and treatments were replacement of maniçoba (Manihot pseudoglaziovii Muel Arg.) hay by spineless cactus (N. cochenillifera Salm Dyck) at 0%, 20%, 40% and 60% of diet DM.
Experiment 8 – Oliveira (Reference Oliveira2013). This experiment was conducted using 32 non-castrated Santa Inês lambs averaging 19.3±1.65 kg of BW at the beginning of the trial, which lasted for 42 days. The animals kept in individual pens, and had ad libitum access to diets and water. The trial was carried out according to a completely randomized design. Diets had forage to concentrate ratio of 50/50 and treatments were replacement of Tifton-85 (C. dactylon) hay by spineless cactus (O. ficus-indica, Mill) at 0%, 16.7%, 33.3% and 50.0% of diet DM.
The data of animals with 30% of spineless cactus inclusion and without ad libitum access to water, from experiments 1 and 4, was not included in the database. Such decision was based in the information that there is a decrease in the DMI in this treatment, pattern that is not observed when the inclusion of spineless cactus was 50% or 70% (Cordova-Torres et al., Reference Cordova-Torres, Costa, Medeiros, Araújo Filho, Ramos and Alves2017).
Data set
A data set (Supplementary Material S1) was composed using the eight publications cited above, which reported data on diet composition, intake and ADG. All data selected were from experiments that had at least 42 days of duration and an adaptation period to minimize the impact of compensatory growth on DMI and ADG. Overall, the data set was composed by 289 individual observations. Five of the experiments (experiments 2, 3, 4, 5 and 6) were carried out at the Universidade Federal da Paraíba (Bananeiras, Paraíba, Brazil), two (experiments 7 and 8) at the Universidade Federal Rural de Pernambuco (Recife, Pernambuco, Brazil) and one (experiment 1) at the Universidade Federal de Alagoas (Rio Largo, Alagoas, Brazil). Effects of breed were taken into the effect of study and were not evaluated as a fixed effect in the models. The mean, maximum, minimum, median and SEM of the variables included in the data set are shown in Table 1.
Descriptive statistics of animal and diet composition variables of the database used to develop dry matter intake (DMI) and average daily gain (ADG) prediction equations in meat lambs fed spineless cactus

DM=dry matter; ME=metabolizable energy; iBW = initial BW; fBW = final BW; mBW = mean BW.
Statistical analysis
Pearson’s coefficient of correlation between DMI or ADG with quantitative variables (i.e. initial BW, mean BW, level of cactus in the diet, square level of cactus in the diet, NDF concentration, ME of the diet and concentrate level in the diet). The ME was calculated by multiplying the digestible (0.82) energy to the factor of 0.82 and the digestible energy was calculated was calculated for each experiment using the values found in the digestibility trials.
Models for predicting DMI and ADG were developed according to the recommendations of St-Pierre (Reference St-Pierre2001). A check for existing studies effect on the database was performed, being each experiment considered as a random sample of a large population. Subsequently, the inclusion of experimental effects in the model required the estimation of fixed effects, as well as random effects associated with the experiments. The equations were estimated using the MIXED procedure of SAS. Three variance–covariance matrix structures were tested: variance components (VC), composed symmetry (CS) and unstructured (UN). Initially, independent variables were adjusted to a model that included fixed effects for intercept and slope, and random effects of study on the intercept and slope through a covariance matrix with UN variation (option UN). When random covariance for intercept and slope was not significant (P>0.05) or when models that included intercept or slope covariance did not converge, the option CS and VC from the PROC MIXED were used. The likelihood was evaluated using the criteria of Akaike’s (AICcr; Akaike, Reference Akaike1974) to define the best matrix covariance.
The dependent variables tested to develop the DMI equations were the following: level of cactus in the diet (CACT, in %), CACT square (CACT2, in %), diet concentrate percentage (CON, in %), CONC square (CONC2, in %), ADG (g/day), ADG square (ADG2, g/day), NDF (% DM), NDF square (NDF2, in % DM), initial BW (iBW, in kg), iBW square (iBW2, in kg), mean BW (mBW, in kg) and mBW square (mBW2, in kg). To develop the ADG equations, the variables tested were the same cited above, except for ADG and ADG2, and including DMI (g/day). In order to identify the variables to be used in the regression equations, a REG procedure with the backward method of SAS was done.
A two-step analysis of outliers was performed in the database. First, the parameter of Cook’s Distance >1 was used to determine studies that should removed from the database. Using this criterion, all studies were kept in the database. Subsequently, an analysis of outliers was performed to the individual observations using the studentized residuals as parameter and observations with values >|2.5| were excluded from the database (Pell, Reference Pell2000).
To evaluate the adequacy of the final model, a cross-validation technique (Efron and Tibshirani, Reference Efron and Tibshirani1998) was performed with 2000 simulations using the non-linear least squares function of R (R Development Core Team, 2015) and the packages ‘boot’ and ‘mass’. Briefly, the original database was randomly divided into two new subsets of approximately the same size. The first subset (training subset) was used to obtain the equations, and the second subset (testing subset) was used to test the equations to obtain the adequacy statistics.
The cross-validation results were used to estimate the accuracy and precision of the developed empirical equations through the mean square error of prediction (MSEP) that was decomposed into: mean bias (MB), systematic bias (SB) and random error (RE), where RE represents the variation which is not explained by the regression (Tedeschi, Reference Tedeschi2006). The concordance correlation coefficient (CCC), which was decomposed into correlation coefficient estimate (ρ), which estimates model precision, and bias correction factor (C b ), which indicates model accuracy, and the R 2.
In addition, equations from the AFRC (1998), NRC (2007), INRA (2007), Cabral et al. (Reference Cabral, Neves, Zervoudakis, Abreu, Rodrigues, Souza and Oliveira2008) and Vieira et al. (Reference Vieira, Pereira, Azevêdo, Neves, Chizzotti, Santos, Araújo, Mistura and Chaves2013) were used for comparisons with the equation obtained in the present work to predict the DMI as follows:
(i) AFRC (1998):
DMI (g/day)=(74.9 × BW75) × [(–0.66+1.333 × ME) – (0.266 × ME2)] equation (1)
(ii) SRNS (Cannas et al., Reference Cannas, Tedeschi, Fox, Pell and Van Soest2004):
DMI (g/day)=–0.124+0.0711 × BW75+0.0015 × ADG equation (2)
(iii) NRC (2007):
DMI (g/day)=[0.04 × ABW × (BW/RSW) × (1.7 – (BW/RSW))] × 1000 equation (3)
(iv) INRA, (2007):
DMI (g/day)=(BCSadj × BW75) × 1000 equation (4)
(v) Cabral et al. (Reference Cabral, Neves, Zervoudakis, Abreu, Rodrigues, Souza and Oliveira2008):
DMI (g/day)=[0.311+((0.0197 × BW)+(0.682 × ADG))] × 1000 equation (5)
(vi) Vieira et al. (Reference Vieira, Pereira, Azevêdo, Neves, Chizzotti, Santos, Araújo, Mistura and Chaves2013):
DMI (g/day)=238.74+31.36 × ALW + 1.26 × ADG – 5.18 × CON equation (6)where BW75=metabolic BW (kg); ME = metabolizable energy of diet (Mcal); ME2=metabolizable energy quadratic (Mcal2); ADG = average daily gain (g/day); ABW = adult BW (assumed as 50 kg in this case); BW (kg); RSW = reference standard weight (assumed to be 45 kg), BCSadj = adjustment for body condition score (0.081 for BCS 3 to 3.5); ALW = average live weight (kg); CON = concentrate percentage in the diet (%).
Aiming to evaluate the prediction bias of the six equations listed above, the observed DMI (dependent variable) values were regressed as a function its correspondent predicted DMI (independent variable). Linear regression parameters were tested for the independent null hypothesis according to Neter et al. (Reference Neter, Kutner, Nachtsheim and Wasserman1996), using simultaneous F-test of the intercept and slope (H0: intercept = 0 and slope = 1; α=0.05). When the null hypothesis was not rejected, the observed and predicted values were considered as similar. Evaluation of precision and accuracy of the described equations were performed according to Tedeschi (Reference Tedeschi2006), using the Model Evaluation System software (available at http://nutritionmodels.com/mes.html, verified 26 April 2017).
Results
Effects of type of spineless cactus were also not observed in the models developed (P>0.05). Thus, the term spineless cactus involves both, O. ficus-indica and Nopalea cochenilifera.
Correlations and equations to predict dry matter intake and average daily gain
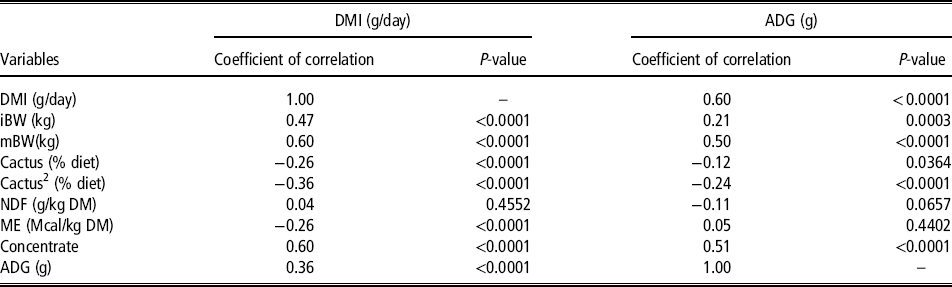
In Table 2 it can be seen that initial (r=0.47) and mean BW (r=0.60) presented a positive correlation with DMI (P<0.001). In contrast, the level of cactus, cactus quadratic and ME showed a negative correlation with DMI (r=–0.26, –0.36 and –0.26, respectively, P<0.001). Diet concentrate level and ADG presented a positive correlation with DMI (r=0.60 and 0.36, respectively), whereas there was no correlation between NDF of the diet and DMI (P=0.46). Average daily gain was positively correlated with DMI, mean BW and concentrate level (r=0.60, 0.50 and 0.51, P<0.0001). However, a negative correlation between ADG and cactus or cactus quadratic was observed (r=–0.12 and –0.24, respectively). Finally, NDF and ME of the diet were not correlated with ADG (P>0.05).
Pearson’s coefficient of correlation and likelihood values of dependent variables of the dry matter intake (DMI) in lambs

ADG =average daily gain; iBW =initial BW; mBW =mean BW; Cactus2=cactus square; DM=dry matter; ME =metabolizable energy.
The meta-analysis approach fitted two equations, one to predict the DMI and another to predict ADG in meat lambs fed spineless cactus, as follows:
(1)DMI = 53.453+3.3907 × CACT – 0.09116 × CACT2+30.8033 × mBW + 1.0797 × ADG
(2) ADG = –58.0268 +1.6404 × CACT – 0.02655 × CACT2+0.1013 × DMI + 3.4012 × CONC where DMI = dry matter intake (g); CACT = cactus (% of diet DM); CACT2=cactus quadratic (% of diet DM); mBW = mean BW (kg); ADG = average daily gain (g); CONC = concentrate in the diet (% of DM).
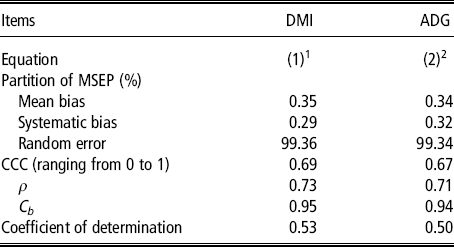
The cross-validation indicated a high accuracy (Table 3) for both equations as demonstrated by the C b values of 0.95 and 0.94 for DMI and ADG equations, respectively. In addition, the MSEP partition indicated a low prediction error directly associated with the fixed variables, because the majority of MSEP was associated with random error (99% for both equations) (Silva et al., Reference Silva, DeVries, Tedeschi and Marcondes2018). The equations presented a moderate coefficient of determination for DMI and ADG prediction equations (R 2=0.53 and 0.50, respectively).
Adequacy measures estimated by the cross-validation technique of the predicted equations for dry matter intake (DMI) and average daily gain (ADG) in lambs

MSEP =mean square error of prediction; CCC =concordance correlation coefficient; ρ=correlation coefficient estimate; C b =bias correction factor.
1 (1) DMI = 53.453+3.3907×CACT−0.09116×CACT2+30.8033×mBW + 1.0797×ADG.
2 (2)ADG =−58.0268 +1.6404×CACT−0.02655×CACT2+0.1013×DMI + 3.4012×CONC, where CACT = cactus (% of diet); CACT2=cactus quadratic (% of diet); mBW = mean BW (kg); CONC = concentrate (%).
Comparisons with literature
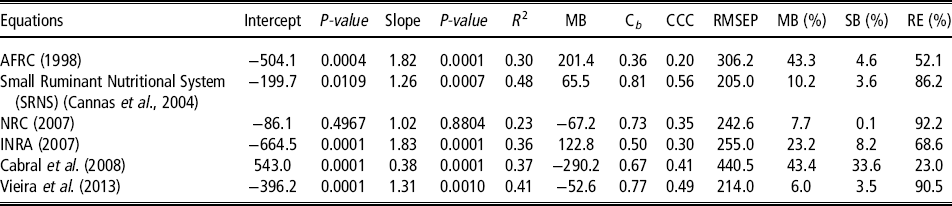
Models suggested by the AFRC (1998), SRNS (Cannas et al., Reference Cannas, Tedeschi, Fox, Pell and Van Soest2004), INRA (2007), Cabral et al. (Reference Cabral, Neves, Zervoudakis, Abreu, Rodrigues, Souza and Oliveira2008) and Vieira et al. (Reference Vieira, Pereira, Azevêdo, Neves, Chizzotti, Santos, Araújo, Mistura and Chaves2013) presented different predicted DMI from those observed in this database (Table 4), when tested using regression statistics, with intercept different to 0 and slope different to 1. However, the equation proposed by the NRC (2007) presented an intercept equal to 0 (P=0.4967) and a slope equal to 1 (P=0.8804) and, for these reasons, equivalent to the observed DMI in practical feeding conditions. On other hand, the equation developed by Cannas et al. (SRNS, Reference Cannas, Tedeschi, Fox, Pell and Van Soest2004)presented the highest coefficient of determination (R 2=0.48), accuracy (C b = 0.81), CCC =0.56 and the lowest root mean square error of prediction of 205.
Statistics for regression between observed and predicted dry matter intake (DMI) in lambs

R 2=coefficient of determination; MB = mean bias; C b = bias correction factor; CCC = concordance correlation coefficient; RMSEP = root mean square error of prediction and its decomposition into MB; SB = systematic bias; RE = random error.
Discussion
Santos et al. (Reference Santos, Santos, Farias, Dias and Lira2001) and Torres et al. (Reference Torres, Ferreira, Guim, Vilela, Guimarães and Silva2009), studying dairy cows and steers, respectively, reported only few variations in the chemical composition between cactus cultivars O. ficus-indica and N. cochenilifera. These authors also not observed effects on DMI and animal’s performance, what is in accordance with the present study. However, it is important to highlight that the use of equations presented in this study has to be done with care in case of differences in the chemical composition of these cultivars or even using of another cultivars.
The DMI was positively correlated with BW (initial and mean), level of concentrate and ADG and negatively with ME of the diet. Vieira et al. (Reference Vieira, Pereira, Azevêdo, Neves, Chizzotti, Santos, Araújo, Mistura and Chaves2013), working with Santa Inês rams, found a very similar and positive correlation between DMI and BW (r=0.52) and ADG (r=0.38). However, the authors observed a negative correlation between DMI and concentrate (r=–0.29), implying that the highest diet concentrate proportions decrease DMI. The authors mentioned that negative correlations between DMI and diet concentrate percentage can be explained by the concentrate increment effect on ME input. In our study negative correlations were observed between DMI and proportions of cactus in the diet (linear and quadratic), and properly with the ME of the diet. Such pattern could be due to the fact that cactus is an excellent source of energy in the form rapidly fermentable nonstructural carbohydrates (Santos et al., Reference Santos, Batista, Mustafa, Amorim, Guim, Moraes, Lucena and Andrade2010).
In addition, DMI was negatively correlated with the level of cactus in the diet (linear and quadratic). Costa et al. (Reference Costa, Treviño, Medeiros, Medeiros, Pinto and Oliveira2012), Porto Filho et al. (Reference Porto Filho, Costa, Cruz, Almeida, Queiroga, Batista, Freire and Sousa2015) and Cordova-Torres et al. (Reference Cordova-Torres, Costa, Medeiros, Araújo Filho, Ramos and Alves2017) also observed a quadratic effect of cactus on DMI. These results suggest that the inclusion of cactus is beneficial for DMI up to a certain level, probably because of the low fiber content and high palatability and passage rate of this feed (Batista et al., Reference Batista, Mustafa, McAllister, Wang, Soita and McKinnon2003). However, the decrease in total DMI as the proportion of cactus further increased may be explained by the high moisture content of cactus (approximately 880 g/kg fresh weight), which thus occupies a considerable volume in the rumen, leading subsequently to limited DMI.
The observed positive correlation between ADG and DMI is in agreement with the literature (AFRC, 1998; Cannas et al., Reference Cannas, Tedeschi, Fox, Pell and Van Soest2004; INRA, 2007; NRC, 2007; Vieira et al., Reference Vieira, Pereira, Azevêdo, Neves, Chizzotti, Santos, Araújo, Mistura and Chaves2013) and allowed us to use DMI in the ADG predictive equation. Negative values of correlation between ADG and square of cactus in the diet indicate that there is an inflection point for ADG prediction models, which is affected directly by this variable. When this situation occurs, animals fed the highest cactus level would need higher levels of DMI to satisfy nutritional requirements, but it seems physiological effects on DMI regulation are observed when a high amount of spineless cactus is offered.
The cross-validation indicated that the estimated equations can perform accurate DMI and ADG prediction in lambs fed spineless cactus, through the C b values of 0.95 and 0.94, respectively. In addition, the partition of MSEP indicated similar patterns in the errors of prediction between DMI and ADG predictive equations. In both cases, the lack of correlation of random error accounted for ~99% of the error and the coefficient of determination were 0.53 and 0.50, respectively. Azevêdo et al. (Reference Azevêdo, Valadares Filho, Pina, Chizzotti and Valadares2010) reported lower precision to estimate DMI to zebu-crosses and Nellore cattle (R 2=0.50 and 0.35, respectively), similar partition of MSEP and bias correction for zebu-crosses (Random error = 99% and C b = 0.96), but lower accuracy for Nellore cattle (Random error = 88% and C b = 0.72). In both equations proposed in the present work to predict DMI and ADG, the intercept did not differ from 0 and the slope did not differ from 1, as recommended by Neter et al. (Reference Neter, Kutner, Nachtsheim and Wasserman1996), indicating that models were reliable to predict DMI and ADG in diets using spineless cactus to meat lambs.
Models proposed by the AFRC (1998), SRNS (Cannas et al., Reference Cannas, Tedeschi, Fox, Pell and Van Soest2004), INRA (2007), Cabral et al. (Reference Cabral, Neves, Zervoudakis, Abreu, Rodrigues, Souza and Oliveira2008) and Vieira et al. (Reference Vieira, Pereira, Azevêdo, Neves, Chizzotti, Santos, Araújo, Mistura and Chaves2013) presented significant P-value for intercept and slope between the observed and predicted DMI. Thus, they were not able to predict the DMI of meat lambs fed spineless cactus efficiently. On other hand, the NRC (2007) was able, but had the smallest precision among tested models (R 2=0.23), moderate accuracy (C b = 0.73) and the majority of the error of prediction was associated with random error (92%). The SRNS (Cannas et al., Reference Cannas, Tedeschi, Fox, Pell and Van Soest2004) model presented the most accurate equation to predict DMI, with the highest values of bias correction (0.81) and CCC (0.56), but the intercept was not different from 0 and the slope was not different from unity. In other words, this system presented predicted DMI different from those observed in the present dataset and, therefore, failed to predict DMI. Even equations developed under Brazilian conditions, such as those proposed by Cabral et al. (Reference Cabral, Neves, Zervoudakis, Abreu, Rodrigues, Souza and Oliveira2008) and Vieira et al. (Reference Vieira, Pereira, Azevêdo, Neves, Chizzotti, Santos, Araújo, Mistura and Chaves2013), were not able to predict the DMI in diets using spineless cactus. These findings suggest that cactus promotes a particular pattern of intake due to its palatability, chemical composition and digestibility (Bispo et al., Reference Bispo, Ferreira, Véras, Batista, Pessoa and Bleuel2007; Costa et al., Reference Costa, Filho, Medeiros, Givisiez, Queiroga and Melo2009 and Reference Costa, Filho, Queiroga, Madruga, Medeiros and Oliveira2010) that should be considered when this feed is included in diets to meat lambs.
Conclusions
The meta-analysis revealed that spineless cactus has a significant effect on DMI and ADG in meat lambs. Although DMI, CPI and NDF intake decreased when feeding a high amount of cactus (>500 g/kg DM), ADG remained unaffected and feed efficiency even increased compared to animals without cactus in the diet. Nevertheless, DMI and ADG improved in animals fed low and medium amounts of cactus, meaning that spineless cactus could be offered to lambs up to 50% of the diet. Overall, the equation suggested in the present work was suitable and more efficient to predict DMI for meat lambs fed spineless cactus than those observed in the literature. Because of its moderate precision and very high accuracy, this equation is more efficient to be used for formulating diets. The developed equation took into account the level of cactus in the diet (linear and quadratic effect), mean BW and ADG.
Acknowledgements
The authors would like to thank Alma Violeta Córdova-Torres, Ana Gabriela Pombo Celles Cordeiro, Israel Hernández Treviño, José Matias Porto Filho, Hugo Batista Lima, Sharleny Braz Lobato Bezerra and Marismênia de Siqueira Campos Moura for giving data from their studies to compose our database.
Declaration of interest
None.
Ethics statement
As this study was done using data of previous studies, no animal care and use protocol was needed. Therefore, the individual studies that composed the database were carried out following local guidelines for animal care and use.
Software and data repository resources
None of the data were deposited in an official repository.
Supplementary material
To view supplementary material for this article, please visit https://doi.org/10.1017/S1751731119000326