


Introduction
Stroke is the second-leading cause of death and a primary driver of disability globally, with its burden shifting from high-income to resource-constrained low- and middle-income countries, thereby exacerbating global health inequalities.1–Reference Krishnamurthi, Ikeda and Feigin3 Major depressive disorder (MDD), a leading contributor to disability, is associated with increased stroke risk (34%–63%) and worse outcomes through mechanisms involving inflammation, endothelial dysfunction, and autonomic dysregulation.4–Reference Ayerbe, Ayis, Wolfe and Rudd7 Traditional Chinese Medicine (TCM) offers a complementary perspective via the “Qi Stagnation leading to Blood Stasis” paradigm: prolonged emotional disturbance (“Qi Stagnation”) may impede Qi and blood flow, contribute to microcirculatory impairment and vascular obstruction (“Blood Stasis”), and thereby form one potential pathway linking emotional distress with stroke.Reference Wang, Wang, Lv and Li8–Reference Li, Zhou, Trevillyan, Hearps, Zhang and Jaworowski10
However, existing research predominantly focuses on individual-level associations, with less attention to ecological relationships at the national level. Ecological analyses can uncover systemic factors, such as healthcare infrastructure, cultural stigma, survey availability, and diagnostic capacity, that are often overlooked in individual studies.Reference Morgenstern11, Reference Li, Xu and Zheng12 A paradoxical country-level observation persists: countries and territories with the highest stroke burden often report the lowest MDD prevalence.Reference Kessler and Bromet13 This may reflect a pattern of “Hidden Stagnation,” in which resource constraints, cultural differences, somatic symptom presentation, and limited mental health data lead to under-recognition or underestimation of emotional distress.Reference Fullagar14 The present analysis, therefore, treats the observed mismatch as a hypothesis-generating ecological signal rather than evidence of individual-level causality.
Using Global Burden of Disease Study 2023 (GBD 2023) data, this study analyzes the ecological association between stroke and MDD across 204 countries and territories from 1990 to 2023. Our objectives are to characterize their global ecological relationship, evaluate temporal trends over 33 years and develop an exploratory Diagnostic Gap Score to identify countries and territories with disproportionate stroke burden relative to reported MDD prevalence. We propose an Integrated Medicine framework positing that the observed negative correlation may reflect not biological protection, but a combination of systematic under-detection, data limitations, diagnostic practice differences, and culturally shaped expression of emotional distress in high-stroke settings.Reference Murray15 This study aims to provide empirical evidence for integrating culturally adapted mental health screening into global stroke prevention strategies.
Methods
Data source and study population
Data for this ecological analysis were derived from the GBD 2023, coordinated by the Institute for Health Metrics and Evaluation (IHME) at the University of Washington, covering 204 countries and territories from 1990 to 2023. The exposure variable was the age-standardized prevalence rate per 100 000 population for the GBD cause category of MDD, within depressive disorders. MDD prevalence was selected rather than MDD DALYs, years lived with disability, or incidence because prevalence most directly reflects the estimated number of existing cases and is particularly sensitive to case recognition, survey availability, and diagnostic ascertainment; burden metrics such as DALYs or years lived with disability incorporate disability weights and would address a related but different question about nonfatal disease burden. The outcome variable was the age-standardized DALY rate per 100 000 population for the GBD cause category of stroke, including ischemic stroke, intracerebral hemorrhage, and subarachnoid hemorrhage. Age standardization was performed using the GBD world standard population to reduce confounding from differences in population age structures on ecological associations.
Study design and analytical framework
A longitudinal ecological design was employed, with each country or territory serving as the unit of analysis. The 204 countries and territories were stratified into quartiles (Q1–Q4) based on their 2023 stroke DALY rates, using cutoff values of 1086.8, 1502.4, and 2077.6 DALYs per 100 000 population. Accordingly, Q1 represented the lowest burden (≤1086.8), Q2 represented moderate burden (>1086.8 to ≤1502.4), Q3 represented high burden (>1502.4 to ≤2077.6), and Q4 represented the highest burden (>2077.6). Further stratification by World Bank income levels and geographic regions was conducted to evaluate pattern variations across different developmental contexts.
Statistical analysis
All statistical analyses were performed using Python (version 3.9). Comprehensive descriptive statistics were calculated for stroke DALYs and MDD prevalence. Normality of distributions was formally assessed using the Shapiro–Wilk test prior to parametric analyses. Pearson product–moment correlation coefficients (r) with 95% confidence intervals estimated by Fisher z transformation were computed for five strategic time points (1990, 2000, 2010, 2020, and 2023) to evaluate temporal trends.
Statistical significance was assessed at α = 0.05, with exact p-values reported. For stratified analysis, countries and territories were categorized into four mutually exclusive quartiles (Q1–Q4) based on 2023 stroke DALY rates, where Q1 represented the lowest burden and Q4 the highest burden. Welch corrected t-tests were employed to compare MDD prevalence between Q4 and Q1 groups, with mean differences, 95% confidence intervals, and Cohen’s d calculated to quantify effect sizes. Linear regression and residual analysis were conducted to identify outliers deviating from global trends, and hierarchical cluster analysis was performed using Ward’s method.
Definition of the “Diagnostic Gap Score” (novel metric)
To construct the exploratory Diagnostic Gap Score, standardized Z-scores were calculated for both stroke DALYs (ZStroke) and MDD prevalence (ZMDD) for each country or territory i in year t using the standard formula: Zi,t = (Xi,t − μt)/σt, where X represents the raw value, μt represents the global mean for that year, and σt represents the global standard deviation. This standardization procedure places both variables on a common scale with mean zero and unit variance, enabling direct comparison and combination. The Diagnostic Gap Score was operationally defined as the arithmetic difference: Gap Scorei = ZStroke,i − ZMDD,i. This difference was chosen because it quantifies standardized excess stroke burden relative to reported MDD prevalence in the same country or territory. A positive value indicates that stroke burden is higher than expected relative to reported MDD prevalence and flags a potential diagnostic, reporting, or data-quality mismatch. The score is an exploratory ecological index and should not be interpreted as a validated measure of individual-level underdiagnosis or causal effect.
Integrated medicine framework for interpretation
Statistical findings were interpreted through the TCM paradigm of “Qi Stagnation leading to Blood Stasis” as a hypothesis-generating explanatory lens. In this framework, “Qi Stagnation” corresponds to under-recognized emotional distress or subclinical affective symptoms, while “Blood Stasis” represents vascular pathology and stroke burden. The observed paradox of high stroke burden co-occurring with low reported MDD prevalence is interpreted not as a biological protective effect of low MDD prevalence, but as a possible signal of “Hidden Stagnation” shaped by diagnostic capacity, cultural expression, data availability, and health-system priorities.
Results
Global distribution and stratified epidemiological characteristics
In 2023, age-standardized stroke DALY rates across 204 countries and territories varied nearly 19-fold (from 298.4 per 100 000 in Australia to 5653.5 in Bulgaria), with substantial heterogeneity also observed in MDD prevalence. Stratified analysis revealed a significant inverse gradient: the highest stroke burden quartile (Q4) reported significantly lower MDD prevalence (2639.93 ± 815.41 per 100 000) compared to the lowest burden quartile (Q1) (3066.98 ± 737.95 per 100 000; Welch t = 2.77, P = 0.007, mean difference = 427.05 per 100 000, 95% CI: 121.52 to 732.58, Cohen’s d = 0.55) (Table 1). This counter-intuitive high-stroke, low-MDD pattern suggests a potential diagnostic or reporting mismatch in high-risk settings.
Stratified Epidemiological Characteristics by Stroke Burden Quartiles Among 204 Countries and Territories (2023)

Table 1. Long description
The table consists of five columns: Quartile, N (sample size), Stroke D A L Y s (mean plus or minus S D), M D D prevalence (mean plus or minus S D), and Exploratory Gap Score. Each quartile contains 51 countries.
* Q 1 (low; less than or equal to 1086.8): Stroke D A L Y s 796.77 plus or minus 165.71; M D D prevalence 3066.98 plus or minus 737.95; Gap Score minus 1.07.
* Q 2 (moderate; greater than 1086.8 to less than or equal to 1502.4): Stroke D A L Y s 1278.40 plus or minus 121.16; M D D prevalence 3155.67 plus or minus 1168.76; Gap Score minus 0.71.
* Q 3 (high; greater than 1502.4 to less than or equal to 2077.6): Stroke D A L Y s 1754.98 plus or minus 171.28; M D D prevalence 2884.29 plus or minus 621.60; Gap Score plus 0.05.
* Q 4 (critical; greater than 2077.6): Stroke D A L Y s 3229.64 plus or minus 1004.09; M D D prevalence 2639.93 plus or minus 815.41; Gap Score plus 1.74.
Data are age-standardized rates per 100,000 population. A positive Gap Score indicates disproportionate stroke burden relative to reported M D D prevalence.
Data are age-standardized rates per 100 000 population. Quartile cutoffs for 2023 stroke DALY rates were 1086.8, 1502.4, and 2077.6 per 100 000 population. Gap Score = Z-score (Stroke) − Z-score (MDD prevalence). A positive Gap Score indicates disproportionate stroke burden relative to reported MDD prevalence and should be interpreted as an exploratory mismatch signal. Abbreviations: DALYs, Disability-Adjusted Life Years; MDD, major depressive disorder.
The ecological paradox and longitudinal correlation trends
A persistently strengthening negative ecological correlation was observed between stroke burden and MDD prevalence. The 2023 scatter plot displayed a negative slope (R 2 = 0.048), with high-stroke countries and territories clustering in the low-MDD quadrant (Figure 1a,b). Residual analysis confirmed that Q4 countries and territories deviated positively from the regression line, indicating that their stroke burden exceeded expectations based on reported MDD prevalence (Figure 1c). The correlation evolved from weak and nonsignificant in 1990 (r = −0.059, 95% CI: −0.195 to 0.079, P = 0.403) to significant in 2023 (r = −0.218, 95% CI: −0.345 to −0.083, P = 0.002), indicating a progressively stronger ecological mismatch over time (Table 2).
The Ecological Paradox of Stroke and MDD Prevalence (2023). (a) Scatter plot demonstrating the inverse ecological correlation between age-standardized MDD prevalence (x-axis) and stroke DALYs (y-axis) across 204 countries and territories; the regression line indicates the negative slope (R2 = 0.048). (b) Kernel density estimation plot illustrating the bivariate distribution and concentration of countries and territories. (c) Residual analysis plot showing deviation from the global regression trend, colored by stroke burden quartile (Q1 = lowest to Q4 = highest), with Q4 countries and territories showing positive residuals indicating excess stroke burden relative to reported MDD prevalence.

Figure 1. Long description
Panel A, titled Inverse Correlation 2023, is a scatter plot with M D D prevalence on the x-axis from 1000 to 7000 and stroke D A L Y s on the y-axis from 0 to 5000. A red linear regression line shows a negative slope, indicating that as M D D prevalence increases, stroke D A L Y s decrease. A light red shaded area represents the confidence interval.
Panel B, titled Density of Global Burden, is a kernel density estimation plot using the same axes. It shows a high concentration of data points, indicated by dark blue shading, centered around an M D D prevalence of 2500 and stroke D A L Y s of 1500. The density contours expand outward in lighter shades of blue.
Panel C, titled Residual Analysis Deviation from Global Trend, is a scatter plot with M D D prevalence on the x-axis and Residuals on the y-axis ranging from minus 1000 to 4000. A dashed horizontal line at zero represents the regression baseline. Data points are color-coded by stroke quartile. Q 1 Low in dark purple and Q 2 in dark teal are mostly below the zero line. Q 3 in medium teal and Q 4 High in bright green are mostly above the zero line, with Q 4 showing the highest positive residuals, indicating a higher stroke burden than predicted by the model.
Longitudinal Pearson Correlation Analysis: Evolution of the Stroke–MDD Ecological Mismatch (1990–2023)

Table 2. Long description
The table consists of four columns: Year, Pearson r (95% C I), P-value, and Interpretation.
* 1990: Pearson r is minus 0.059 (minus 0.195 to 0.079); P-value is 0.403; Interpretation is Weak negative (not significant).
* 2000: Pearson r is minus 0.107 (minus 0.241 to 0.031); P-value is 0.128; Interpretation is Emerging trend.
* 2010: Pearson r is minus 0.178 (minus 0.308 to minus 0.042); P-value is 0.011*; Interpretation is Significant inverse correlation.
* 2020: Pearson r is minus 0.223 (minus 0.350 to minus 0.088); P-value is 0.001**; Interpretation is Highly significant.
* 2023: Pearson r is minus 0.218 (minus 0.345 to minus 0.083); P-value is 0.002**; Interpretation is Significant inverse ecological correlation.
Footnotes indicate C I equals Confidence Interval estimated using Fisher z transformation. The strengthening negative correlation over time indicates a widening ecological mismatch between stroke burden and reported M D D prevalence. One asterisk denotes P is less than 0.05; two asterisks denote P is less than 0.01.
Note: CI = Confidence Interval estimated using Fisher z transformation. The strengthening negative correlation over time indicates a widening ecological mismatch between stroke burden and reported MDD prevalence. *P < 0.05; **P < 0.01.
Divergent trajectories and widening global health inequality
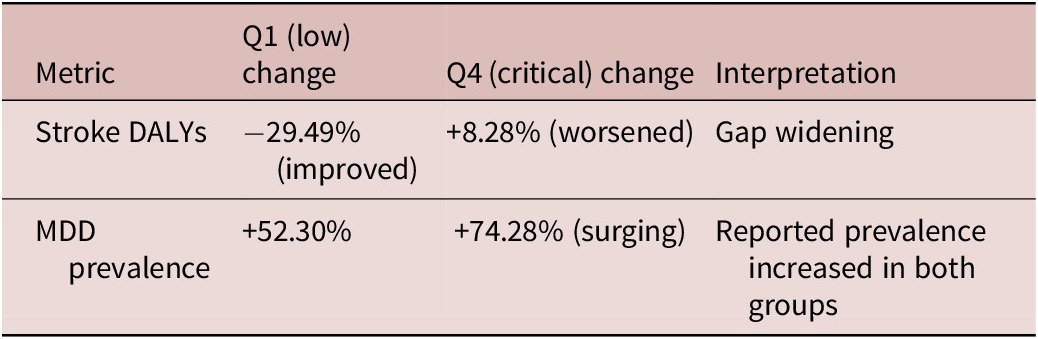
Between 1990 and 2023, stroke burden decreased by 29.5% in Q1 countries and territories but increased by 8.3% in Q4 countries and territories, creating a 38-percentage-point divergence that underscores escalating global health inequality (Table 3). Although global MDD reporting rose overall, the increase in Q4 countries and territories (+74.28%) was higher than in Q1 (+52.30%); however, this rise remained disproportionate relative to their worsening vascular disease trajectories, suggesting persistent mismatch rather than proving under-identification in high-stroke settings. Figure 2 provides a visual representation of these temporal dynamics; Panel A shows global normalized trends using 1990 as the baseline, revealing that while global stroke burden declined modestly overall, MDD prevalence increased by approximately 60%. Panel B stratifies stroke trajectories by 2023 quartile classification, demonstrating the widening gap between Q1–Q2 countries and territories and the relatively flat or increasing trajectories of Q3–Q4 countries and territories over the 33-year observation period.
Divergent Trajectories: Percentage Change in Disease Burden and MDD Prevalence (1990–2023)

Table 3. Long description
The table consists of four columns: Metric, Q 1 low change, Q 4 critical change, and Interpretation.
* The first row for Stroke D A L Y s shows a decrease of 29.49 percent (improved) for Q 1 and an increase of 8.28 percent (worsened) for Q 4, interpreted as a widening gap.
* The second row for M D D (Major Depressive Disorder) prevalence shows an increase of 52.30 percent for Q 1 and an increase of 74.28 percent (surging) for Q 4, interpreted as reported prevalence increasing in both groups.
A footnote explains that percentage change is calculated as 2023 value minus 1990 value, all over 1990 value, times 100. It notes that divergent stroke trajectories indicate widening global health inequality.
Note: Percentage change calculated as ((2023 value-1990 value)/1990 value) × 100. MDD = major depressive disorder. The divergent stroke trajectories indicate widening global health inequality and an ecological mismatch between vascular burden and reported MDD prevalence.
Temporal Dynamics and Divergent Disease Trajectories (1990–2023). (a) Global normalized trends with 1990 as baseline (100%); the blue line shows declining global stroke DALYs while the orange line shows increasing MDD prevalence. (b) Stratified stroke burden trajectories by 2023 quartile status, demonstrating the widening gap between Q1 countries and territories and Q4 countries and territories.

Figure 2. Long description
The image consists of two panels labeled A and B.
Panel A, titled Global Normalized Trends (1990 Baseline), features a horizontal X axis for Year (1990 to 2023) and a vertical Y axis for percent of 1990 Value (80 to 160).
* A blue line representing Stroke D A L Y s starts at 100 percent in 1990 and shows a steady, near-linear decline, reaching approximately 82 percent by 2023.
* An orange line representing M D D prevalence starts at 100 percent and shows a gradual increase to 120 percent by 2019, followed by a sharp vertical spike to nearly 160 percent between 2019 and 2021, before stabilizing.
Panel B, titled Stroke Burden Trajectories by 2023 Status, features a horizontal X axis for Year (1990 to 2023) and a vertical Y axis for Stroke D A L Y s (1000 to 4000). The data is stratified into four quartiles, each shown with a central line and a shaded confidence interval.
* Q 4 (High), the top-most light orange band, starts around 3250 and remains high with a slight peak around 2005 before ending near 3250.
* Q 3, the second band from the top, shows a gradual decline from 2250 to approximately 1750.
* Q 2, the third band, shows a decline from 1800 to approximately 1250.
* Q 1 (Low), the bottom-most dark red band, shows a decline from 1250 to approximately 800.
The vertical gap between the Q 4 band and the Q 1 band widens over the time period.
Identification of “hidden stagnation” through diagnostic gap score analysis
To systematically quantify and geographically localize the phenomenon of potential “Hidden Stagnation,” we calculated exploratory Diagnostic Gap Scores for all 204 countries and territories. Panel B in Supplementary Figure S1 presents violin plots of the Diagnostic Gap Score distribution by quartile, revealing that while Q1 and Q2 gap scores were centered around zero or negative values, Q3 and especially Q4 scores were skewed positive. This pattern indicates disproportionate stroke burden relative to reported MDD prevalence, but it should be interpreted as an exploratory mismatch signal rather than a direct measure of diagnostic failure.
Country- and territory-level analysis (Supplementary Figure S2) identified Bulgaria (4.34), Myanmar (4.30), and North Macedonia (4.28) as having the highest scores. The Z-score scatter plot defined a “Hidden Stagnation Zone” (upper-left quadrant), characterizing settings with the coexistence of high stroke burden and low reported MDD prevalence. Table 4 provides detailed metrics for the top 10 countries and territories with the highest Gap Scores, including their absolute stroke DALY rates, MDD prevalence, and calculated gap values.
Top 10 Countries and Territories Exhibiting the Highest Exploratory Diagnostic Gap Scores

Table 4. Long description
The table contains five columns: Rank, Country or territory, Stroke D A L Y s, M D D prevalence, and Exploratory Gap Score.
* Rank 1: Bulgaria; Stroke D A L Y s 5653.54; M D D prevalence 2383.65; Exploratory Gap Score 4.34.
* Rank 2: Myanmar; Stroke D A L Y s 5421.12; M D D prevalence 2221.52; Exploratory Gap Score 4.30.
* Rank 3: North Macedonia; Stroke D A L Y s 5003.06; M D D prevalence 1893.42; Exploratory Gap Score 4.28.
* Rank 4: Tuvalu; Stroke D A L Y s 5190.52; M D D prevalence 2360.23; Exploratory Gap Score 3.92.
* Rank 5: Romania; Stroke D A L Y s 3916.36; M D D prevalence 1530.56; Exploratory Gap Score 3.66.
* Rank 6: Serbia; Stroke D A L Y s 4244.99; M D D prevalence 2093.79; Exploratory Gap Score 3.33.
* Rank 7: Nauru; Stroke D A L Y s 4387.54; M D D prevalence 2272.34; Exploratory Gap Score 3.26.
* Rank 8: North Korea; Stroke D A L Y s 4923.70; M D D prevalence 2769.12; Exploratory Gap Score 3.20.
* Rank 9: Montenegro; Stroke D A L Y s 3865.57; M D D prevalence 1903.88; Exploratory Gap Score 3.18.
* Rank 10: Indonesia; Stroke D A L Y s 3537.88; M D D prevalence 1671.81; Exploratory Gap Score 3.13.
A note explains that the Gap Score equals the Z-score of Stroke minus the Z-score of M D D prevalence. Higher scores indicate a greater standardized excess of stroke burden relative to reported M D D prevalence.
Note: Gap Score = Z-score (Stroke) − Z-score (MDD prevalence). A higher positive Gap Score indicates greater standardized excess of stroke burden relative to reported MDD prevalence, flagging a potential diagnostic, reporting, or data-quality mismatch. The score is exploratory and is not a validated measure of individual-level underdiagnosis.
Hierarchical cluster analysis of high-burden nations
Cluster analysis of the top 30 high-burden countries and territories confirmed the systematic nature of this pattern: high stroke burden co-occurred with low MDD prevalence and high gap scores. The dendrogram identified a distinct Eastern European cluster, including Bulgaria and Romania, with consistent profiles, suggesting shared structural, cultural, health-system, or data-related influences (Supplementary Figure S3).
Discussion
This ecological analysis reveals a paradoxical and progressively strengthening inverse relationship between national stroke burden and MDD prevalence across 204 countries and territories worldwide. Countries and territories bearing the highest age-standardized stroke burden consistently reported lower modeled MDD prevalence than low-stroke-burden settings, a pattern that became more apparent over three decades of global health development. The exploratory Diagnostic Gap Score identified clusters, predominantly located in Eastern Europe, Southeast Asia, and the Pacific Islands, where disproportionate stroke burden co-occurred with relatively low reported MDD prevalence. These findings should be separated from the proposed explanatory framework: the epidemiological pattern is an observed country-level association, whereas “Hidden Stagnation” is a hypothesis-generating Integrated Medicine interpretation that may help frame future research and culturally adapted interventions.
At the country or territory level, this inverse association does not negate individual-level evidence that MDD is associated with increased stroke risk.Reference Wang, Zhao, Wang, Zhao, Zhu and Tian16, Reference Dong, Zhang, Tong and Qin17 Instead, it may reflect a broader mismatch between vascular burden and recognized psychological distress. Several explanations are plausible and not mutually exclusive, including differences in mental health survey availability, diagnostic instruments, coding practices, health-service capacity, stigma, help-seeking behavior, and cultural expression of depressive symptoms. In countries and territories with sparse mental health data inputs, low modeled MDD prevalence may partly reflect limited primary data or modeling uncertainty rather than truly low burden.Reference Thornicroft, Chatterji and Evans-Lacko18–Reference Shaligram, Sarvet and Straus20 Conversely, high-income settings may report higher MDD prevalence because of greater diagnostic capacity, wider screening, and lower barriers to care. The observed pattern therefore supports the possibility of a diagnostic and data-quality gap, but it does not establish that underdiagnosed MDD is the sole or direct driver of stroke burden.
The TCM theory of “Qi Stagnation leading to Blood Stasis” (qi zhi xue yu) offers one interpretive perspective for this mismatch. In the present ecological framework, under-recognized emotional distress is conceptualized as “Hidden Qi Stagnation,” whereas stroke burden is conceptualized as a manifestation of vascular “Blood Stasis.” This interpretation is consistent with, but does not prove, biological pathways linking psychological distress with inflammation, endothelial dysfunction, autonomic imbalance, and adverse health behaviors.Reference Matos, Machado, Monteiro and Greten21–Reference Xin, Chen and Yuan23 Regional patterns further suggest that the high gap in Eastern Europe may be related to historical and structural deficiencies in mental health systems,Reference Winkler, Krupchanka and Roberts24 whereas in parts of Asia it may be influenced by resource scarcity and culturally patterned somatic presentation of depressive symptoms that can reduce the sensitivity of standard screening tools.Reference Ryder, Yang and Zhu25
Several public health implications follow from these findings. Stroke-prevention strategies in high-gap countries and territories should incorporate culturally adapted mental health screening in feasible clinical and community settings, including primary care, hypertension and diabetes clinics, stroke-prevention clinics, rehabilitation services, and community health programs. Screening should be linked to referral pathways for people who screen positive, with stepped-care options, non-specialist provider training, collaborative care, and integration with existing cardiovascular risk management. TCM-informed assessment may be useful where it improves cultural acceptability and captures somatic or functional presentations of emotional distress, but it should complement rather than replace validated mental health instruments and referral systems.Reference Yu, Wu and Zhang26, Reference Whiteford, Ferrari, Degenhardt, Feigin and Vos27
From a broader Integrated Medicine perspective, these ecological findings support a more holistic model of stroke prevention in which emotional wellbeing is treated as one component of cardiovascular health. The TCM clinical tradition emphasizes the interdependence of emotional and physical states, while contemporary public health increasingly recognizes the value of integrated care models for complex chronic disease prevention.Reference Luo, Liu and Hong28 Future work should validate screening tools that bridge Western diagnostic criteria for MDD with culturally meaningful descriptions of emotional and somatic distress, evaluate their acceptability in diverse settings, and test whether integrated screening and referral pathways improve both mental health and vascular outcomes.Reference Qiu, Zhong and Wan29
Several methodological limitations warrant careful acknowledgment. First, as with all ecological studies, country-level associations cannot establish individual-level causal relationships and may be affected by ecological fallacy. Second, MDD prevalence estimates in the GBD study are modeled from heterogeneous data sources and may be strongly influenced by survey availability, diagnostic instruments, case definitions, and modeling assumptions; in settings with sparse mental health survey data, low estimated prevalence may partly reflect limited data inputs. Third, cross-national variation in symptom expression, help-seeking behavior, stigma, and clinical practice may influence documented prevalence independently of true underlying disease frequency. Fourth, the Diagnostic Gap Score is a novel exploratory index that identifies disproportionate stroke burden relative to reported MDD prevalence; it requires validation before being used for clinical or policy decision-making and should not be interpreted as a validated measure of underdiagnosis. Fifth, the analysis used MDD prevalence rather than MDD DALYs, years lived with disability, or incidence. This choice was aligned with the study question about reported prevalence and potential recognition gaps, but alternative depression metrics could yield different patterns and should be examined in sensitivity analyses. Sixth, residual confounding by socioeconomic factors, vascular risk factors, health-system performance, and data quality may contribute to the observed association.
In conclusion, this ecological analysis reveals an inverse and progressively strengthening association between national stroke burden and reported MDD prevalence across 204 countries and territories over a 33-year observation period. The findings support the possibility of a diagnostic, reporting, or data-quality mismatch in high-stroke settings rather than any biologically protective effect of low MDD prevalence, but they do not prove that undiagnosed MDD causes stroke burden. From an Integrated Medicine perspective, the pattern can be interpreted as potential “Hidden Qi Stagnation,” a hypothesis that under-recognized emotional distress may coexist with and contribute to vascular vulnerability in some populations. The exploratory Diagnostic Gap Score identifies settings where culturally adapted mental health screening, referral pathways, and integrated cardiovascular prevention programs may be prioritized. Addressing this mismatch represents a feasible opportunity to align mental health services with stroke prevention while respecting the limits of ecological inference.
Supplementary material
The supplementary material for this article can be found at http://doi.org/10.1017/S1092852926101266.
Data availability statement
All data analyzed in this study are publicly available from the GBD results and the IHME Global Health Data Exchange. No new individual-level data were generated or accessed in this study.
Author contribution
Study design: K.J., L.-L.Q., F.-C.Z., Q.S., M.-M.Z., and Y.-F.L.; Data acquisition: K.J., L.-L.Q., F.-C.Z., Q.S., M.-M.Z., and Y.-F.L.; Data analysis and interpretation: K.J., L.-L.Q., F.-C.Z., Q.S., M.-M.Z., and Y.-F.L.; Manuscript preparation: K.J., L.-L.Q., F.-C.Z., Q.S., M.-M.Z., and Y.-F.L.; Critical revision of the manuscript for intellectual content: K.J.; Manuscript review: K.J., L.-L.Q., F.-C.Z., Q.S., M.-M.Z., and Y.-F.L.; Obtaining financing: None. Authors K.J. and L.-L.Q. contribute equally.
Financial support
The key discipline construction project of Traditional Chinese Medicine in Henan Province—Clinical discipline of integrated Chinese and Western medicine.
Disclosures
The authors have no conflicts of interest to declare.
Competing interests
The authors have no conflicts of interest to declare.
Ethical standard
This study utilized exclusively publicly available, de-identified aggregate data from the GBD study. No individual-level privacy information was accessed. Consequently, the study was exempt from institutional review board (IRB) approval and was conducted in accordance with the principles of the Declaration of Helsinki.
Ethics approval and consent to participate
Not applicable.
Consent for publication
Not applicable.




 Open access

