Introduction
Gallium nitride is an attractive base material for novel applications in optoelectronics as UV-laser diodes, LED‘s and UV detectors and for high power, high frequency and high temperature electronics /Reference Pearton, Zolper, Shul and Ren1/. However, this high potential for new devices can only be used if the properties of ohmic and Schottky contacts are well controlled. On the other hand, there are some indications for the influence of deep defects located at the surface of the GaN layer on the contact properties. In GaN pn-junctions for example the dominant current mechanisms are the thermionic emission over a barrier and a tunnelling process via deep levels in the interface regions /Reference Kozodoy, Ibbetson, Marchand, Fini, Keller, Speck, DenBaars and Mishra2,Reference Kuksenkov, Temkin, Osinsky, Gaska and Khan3/.
In this work, we investigated deep defects in the space charge region of a Schottky contact on intentionally undoped, n-type GaN layers using thermal admittance spectroscopy (TAS) and deep level transient spectroscopy (DLTS).
Experimental
The samples were grown both on (0001) oriented sapphire substrates using metal organic vapor phase epitaxy (MOVPE) and by plasma induced molecular beam epitaxy (MBE). The growth conditions are described in detail in /Reference Witte, Krtschil, Lisker, Christen and Scholz4/ and /Reference Ambacher, Smart, Shealy, Weimann, Chu, Murphy, Schaff, Eastman, Dimitrov, Wittmer, Stutzmann, Rieger and Hilsenbeck5/. All samples are nominally undoped or Si-doped and show n-type conductivity with carrier concentrations in the range between 5×10¹⁶ and 1017 cm−3 determined by Hall effect measurements. Before metallization, the GaN surfaces were cleaned with organic solvents in an ultrasonic bath and etched with HF and HCL. The ohmic contacts were formed by evaporating a 100nm thick Al layer followed by an annealing step at 500°C in nitrogen athmosphere. A 100nm thick Pt layer deposited by magnetron sputtering was commonly used as Schottky contact. Both contacts were arranged on the GaN layer and have a diameter of 750µm. The distance between the metal layers was 1mm.
We carried out C-V measurements, admittance spectroscopy (AS) and thermal admittance spectroscopy in the frequency range between 20Hz and 1MHz and at temperatures between 80K and 400K using a high precision LCR meter HP4284A and a liquid-nitrogen flow cryostat. For both, AS and TAS measurements the capacitance and the conductance were measured as a function of frequency and temperature (fore more details see /Reference Barbolla, Duenas and Bailon7/). If the resistance of the neutral bulk region of the samples is not negligible a serial circuit model of the complex impedance was used for analysis (see /Reference Krtschil, Witte, Lisker, Christen, Birkle, Einfeldt and Hommel6/).
In addition, we performed DLTS measurements at a frequency of 1MHz using the capacitance meter Boonton 7200 and a pulse generator HP8110A. The capacitance transients were recorded via a fast A/D converter with a time resolution of 1µs and analyzed by the boxcar method. DLTS measurements at lower frequencies were made at Schottky contacts which break down at frequencies below 1MHz. In this case, the transients were measured using the LCR meter HP4284A with a minimal time step of 300ms in the boxcare method.
Results and Discussion
The Pt Schottky contacts on GaN layers show barrier heights up to 0.95eV determined by C-V-spectroscopy at frequencies between 50kHz and 1MHz. This barrier is slightly lower than the 1.04eV found in /Reference Guo, Feng, Guo, Pan and Chang8/. The net donor concentrations were in the range of 5×10¹⁶ to 5×1017 cm−3 determined by C-V-characteristics and by Hall effect measurements at room temperature.
In generally, we can distinguish two different categories of Schottky contacts as represented by the samples #1 and #2 in Fig. 1. Sample #1 shows only a little variation in the conductance spectrum for different bias voltages which is caused by a small Schottky barrier. Furthermore, the contact breaks down at relatively low frequencies of about 5×10⁴ s−1 resulting in a completely bias independent conductivity and capacitance above this frequency. The other group shows larger barrier heights resulting in a stronger influence of the bias on the conductance (sample #2 in Fig.1). The rectifying behavior of this contact vanished at higher frequencies of about 106 s−1.
(Left) Admittance spectra of two MOVPE-grown GaN samples at different bias voltages. (Right) Histogram of the GaN surface morphology measured by atomic force microscopy for both samples #1 and #2.

These different properties of the contacts were correlated with the surface roughness measured by atomic force microscopy (AFM),which is shown on the right side of Fig.1. The significant difference between both samples becomes visible. Sample #2 exhibits a sharp distribution of low height spikes equivalent to a nearly perfect flat surface. In contrast, the AFM measurements of sample #1 revealed a rough surface with a broad distribution of heights. Obviously Schottky contacts on a smooth surface exhibit better rectifying properties and break down at higher frequencies.
This effect can be explained by a lowering of the Schottky barrier caused by fluctuations in the spatial distribution of the barrier heights as discussed in /Reference Chand and Kumar9/. Additionally, the frequency dependence of the breakdown behavior and the structure of the admittance spectra suggest that there is a recharging process of deep defects at the interface involved. Both samples in Fig. 1 show shoulders and peaks in the breakdown region. These peaks are caused by deep defects and were already described in /Reference Krtschil, Witte, Lisker, Christen, Birkle, Einfeldt and Hommel6/.
Independent of the surface morphology and the growth technique deep defects appear in the TAS spectra at activation energies of (130-140) meV (T1) and (150-170) meV (T2). The TAS-data on the left side of Fig. 2 shows typical TAS spectra of two MBE and two MOVPE grown GaN layers, respectively. These emissions dominate the whole TAS spectrum evidencing the high concentrations of the corresponding defects. They are probably located in the vicinity of the surface because all TAS measurements were made at zero voltage causing the lowest expansion of the space charge region.
(Left) TAS spectra of different GaN samples grown by MOVPE (#1 and #2) and by MBE (#3 and #4), respectively, at a modulation frequency of 10kHz and under zero bias condition. The resulting activation energies are 130-140meV for T1 and 150-170meV for T2, respectively. (Right) DLTS-spectra of the MBE samples #3 and #4 at 100kHz (LF-DLTS) and at 1MHz (HF-DLTS). The corresponding emission rates are en = 36.1 s−1 for the HF-DLTS spectrum and en = 0.4 s−1 for the LF-DLTS, respectively.

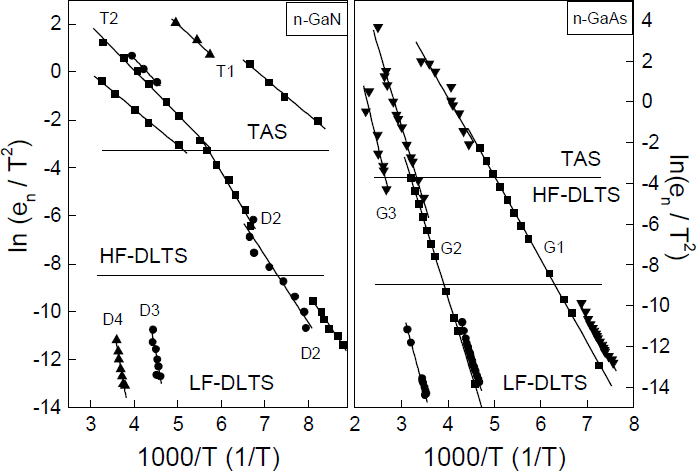
While the TAS measurements exclusively detect these defects T1 and T2, further deep traps exist in the investigated samples verified by DLTS measurements at 1MHz (HF-DLTS) and at lower frequencies (LF-DLTS). These DLTS spectra are shown in Fig. 2 on the right side. The thermal activation energies of the defects are 240±30meV for D2, 630meV for D3, and 860meV for D4, respectively. The observed traps are already known from the literature (see for example /Reference Auret, Goodman, Koschnick, Spaeth, Beaumont and Gibart10/) and were discussed as intrinsic defects.
It is important to point out, that in the TAS spectra of these GaN layers only one single trap emission appears, while DLTS measurements performed at the same samples reveals the whole deep level spectrum with several trap emissions. The presented discrepancies between the both spectroscopic methods result from the recharging processes of the defects during the distinct measurements.
In TAS the deep defects were recharged around the Fermi level near the thermodynamical equilibrium. Commonly, the Fermi level shifts with increasing temperature to the mid gap region and ionizes the various defect states with respect to their thermal activation energy. Therefore, the whole deep level spectrum should be obtained. However, if the Fermi level is pinned at the activation energy of a dominant level with high concentration, the Fermi level cannot shift and ionize of further defects becomes inhibited. As a result, the TAS spectrum only shows the recharging process of this one defect state, responsible for the pinning effect. Because the signals under zero bias conditions originate from a region near the interface the TAS spectra show the emissions from traps near the interface Fermi level. Therefore we conclude that the Fermi level is pinned in the near of the interface due to high concentrations of the specific deep defects T1 and T2.
In contrast, the DLTS measurements are only possible for Schottky diodes with high barriers and at frequencies below the breakdown frequency. In our DLTS investigations a voltage pulse between 3 V in reverse direction and 0V was used. Thus, the expansion of the space charge region causes a recharging of other traps far from the Fermi level in the equilibrium.
One additional specific feature is the high temperature of the TAS peaks for the defects T1 and T2 compared with the corresponding peak temperatures detected by DLTS (see the left side of Fig. 4). The high temperature of the TAS peaks may be caused by the location of these defects in the interface. The emission behavior of the interface traps should be changed under these conditions.
(Left) Arrhenius plots of deep defects in n-type GaN layers obtained by HF-DLTS, LF-DLTS and TAS. (Right) Arrhenius plots of three deep defect levels obtained by the spectroscopical methods DLTS, TAS and low frequency DLTS in a GaAs:Te sample with an electron concentration of 2×1015 cm−3. The activation energies of the deep traps are: G1: 350±30 meV; G2: 670±40 meV and G3: 740±50 meV, respectively.

To evidence that all three spectroscopical methods, i.e. DLTS, LF-DLTS, and TAS yield identical results under the same conditions for the same defect performed at the same samples, we used a GaAs:Te Schottky diode as an example for an interface without Fermi level pinning. This sample has a similar conductivity and the same contact arrangement as the GaN layers. The resulting Arrhenius plots are shown in the right side of Fig. 4. For the presented deep defects the plots of the different methods agree perfectly. So we conclude, that the differences of the peak temperatures in the GaN layers are caused by the nature of the defects and not by the measurement methods.
These investigations show that the deep defects found cause a pinning of the Fermi level in the interface between the metal and the GaN surface. This induces a breakdown of the Schottky barrier which is assumed as a tunneling process through these deep defect states as described in detail in /Reference Guo, Feng, Guo, Pan and Chang8/ and /Reference Yu, Liu, Xing, Qiao, Lau and Redwing11/ for Schottky contacts. Furthermore, the influence of interface defects with activation energies of 160meV and 230meV on Schottky contacts was demonstrated in /Reference Duboz, Binet, Laurent, Rosencher, Scholz, Harle, Briot, Gill and Aulombard12/ which are very similar with our results. Traps in the range of 0.1 to 0.2eV are also discussed as origin of the pinning of the Fermi level in /Reference Polyakov, Smirnov, Govorkov, Shin, Skowronski and Greve13/. For p-n-junctions interface defects influence the low frequency noise /Reference Kuksenkov, Temkin, Osinsky, Gaska and Khan3/ and the reverse-bias current /Reference Kozodoy, Ibbetson, Marchand, Fini, Keller, Speck, DenBaars and Mishra2/. Here, the threading dislocations are discussed as the source of these interface defects.
TAS measurements of MBE GaN using an ECR plasma source /Reference Krtschil, Witte, Lisker, Christen, Birkle, Einfeldt and Hommel6/ and of LPCVD GaN /Reference Witte, Krtschil, Lisker, Christen, Topf, Meister and Meyer14/ show that the pinning effect occurs in GaN grown by other techniques and in Schottky contacts prepared by other methods, too. Furthermore, the results in /Reference Krtschil, Witte, Lisker, Christen, Birkle, Einfeldt and Hommel6/ indicate that other traps for example at 260meV cause a Fermi level pinning in the metal / GaN interface.
In conclusion, the TAS measurements show that a high concentration of interfacial defects detected by TAS causes a breakdown of the Schottky barrier at defined modulation frequencies. This suggest a pinning of the Fermi level at the interface due to deep defect emission.
Acknowledgements
This work was financially supported by the Deutsche Forschungsgemeinschaft under Contract number WI 1619/1-1 and by the Kultusministerium Sachsen-Anhalt, contract number 002KD1997.