


Introduction
Although there has been significant progress in the understanding of summer ablation processes on glaciers and their incorporation into distributed models, winter accumulation processes are less well understood (Reference MunroMunro, 2000). In particular, the end-of-winter distribution of snow cover affects the position of the transient snow-line (TSL) during the subsequent melt season and yet the controls on snow-cover distribution on glaciers are not well known. The TSL separates high-albedo, aerodynamically smooth, slow-draining snow surfaces from low-albedo, aerodynamically rough, fast-draining ice surfaces. Consequently, both glacier mass balance and the pattern of summer runoff are strongly influenced by the spatial distribution of winter accumulation.
Research into the spatial distribution of snowpacks and their topographic controls is further advanced in hydrology than in glaciology. For instance, Reference Anderton, White and AlveraAnderton and others (2004) used a multivariate statistical analysis to explore relationships between topography and spatial variability in snow accumulation and melt in a small catchment in the Spanish Pyrenees. This suggested that topographic controls on the redistribution of snow by wind were the most important influence on snow distribution at the start of the melt season, and that spatial patterns of snow removal were determined more by the distribution of snow at the start of the melt season than by spatial variability in melt rates during it. Reference Winstral, Elder and DavisWinstral and others (2002) improved the explained variance of a regression tree model of snow distribution using elevation, solar radiation and slope by up to 23% through incorporating variables representing the pixel-level wind scalar and a drift delineator parameter, based on the wind scalar and break-of-slope locations.
Reports of the spatial distribution of winter accumulation in the Arctic are still exceptional. Glacier mass balance, for example, is typically published as a spatially lumped value or as a function of altitude alone, such as is the case for the important, mass-balance time series from austre Brøggerbreen and midre Lovénbreen in northwest Svalbard (e.g. Reference Hagen, Liestöl, Roland and JorgensenHagen and others, 1993; Reference Hagen, Jania and HagenHagen, 1996). Given the burgeoning application of spatially distributed models in glaciology and hydrology (e.g. Reference Arnold, Richards, Willis and SharpArnold and others, 1998; Reference Klok and OerlemansKlok and Oerlemans, 2002; Reference Flowers, Björnsson and PálssonFlowers and others, 2003), a need has arisen for corresponding, spatially distributed driving and validating data.
The aims of this paper are to: (1) quantify the spatial variation in winter accumulation from two successive end-of-winter snow-cover surveys at an Arctic glacier, drawing particular attention to interannual variability; and (2) assess quantitatively, by principal components (PC) and clustering analyses, the influence of a range of glacier surface topographic variables (elevation, slope, aspect) on this spatial distribution, again drawing particular attention to interannual variability.
Data Collection
The work was based on Finsterwalderbreen, located at 77˚31’ N, 15˚19’ E in southern Spitsbergen, the largest island of the Norwegian Arctic archipelago of Svalbard (Fig. 1). The Finsterwalderbreen catchment is situated on the southern side of Van Keulenfjorden and flows to the coast from a maximum elevation of 1065 m. Finsterwalderbreen is a 12 km long, north-facing glacier fed by three small tributary glaciers, of which only one, Revtannbreen, is currently believed to be active (Reference Nuttall, Hagen and DowdeswellNuttall and others, 1997). Excluding these tributaries, the glacier has a total area of 29.6 km2. The glacier has a polythermal temperature regime (Reference Ødegård, Hagen and HamranØdegård and others, 1997) and a history of regular surge activity (Reference Hart and WattsHart and Watts, 1997; Reference Nuttall, Hagen and DowdeswellNuttall and others, 1997), with the most recent surge occurring between 1898 and 1918. Since then, the glacier terminus has thinned and retreated at a rate of 10–45 ma–1 (Reference Nuttall, Hagen and DowdeswellNuttall and others, 1997). The geometry and flow, mass balance and hydrology of Finsterwalderbreen have been described previously (e.g. Reference LiestølLiestøl, 1969; Reference Hagen, Etzelmüller and NuttallHagen and others, 2000; Reference Wadham, Hodgkins, Cooper and TranterWadham and others, 2001; Reference Hodgkins, Cooper, Wadham and TranterHodgkins and others, 2003).
(a) Surface topography (m a.s.l.) of Finsterwalderbreen. Image is subset of aerial photographs S90 3741–3744 © Norwegian Polar Institute. Inset shows location within Svalbard. (b) Distribution of aspect over the Finsterwalderbreen surface. Lighter shading denotes a westerly aspect. (c) Distribution of slope over the Finsterwalderbreen surface. Lighter shading denotes steeper surfaces. Scale and north direction are given by an underlying 1 km Universal Transverse Mercator (UTM) grid.
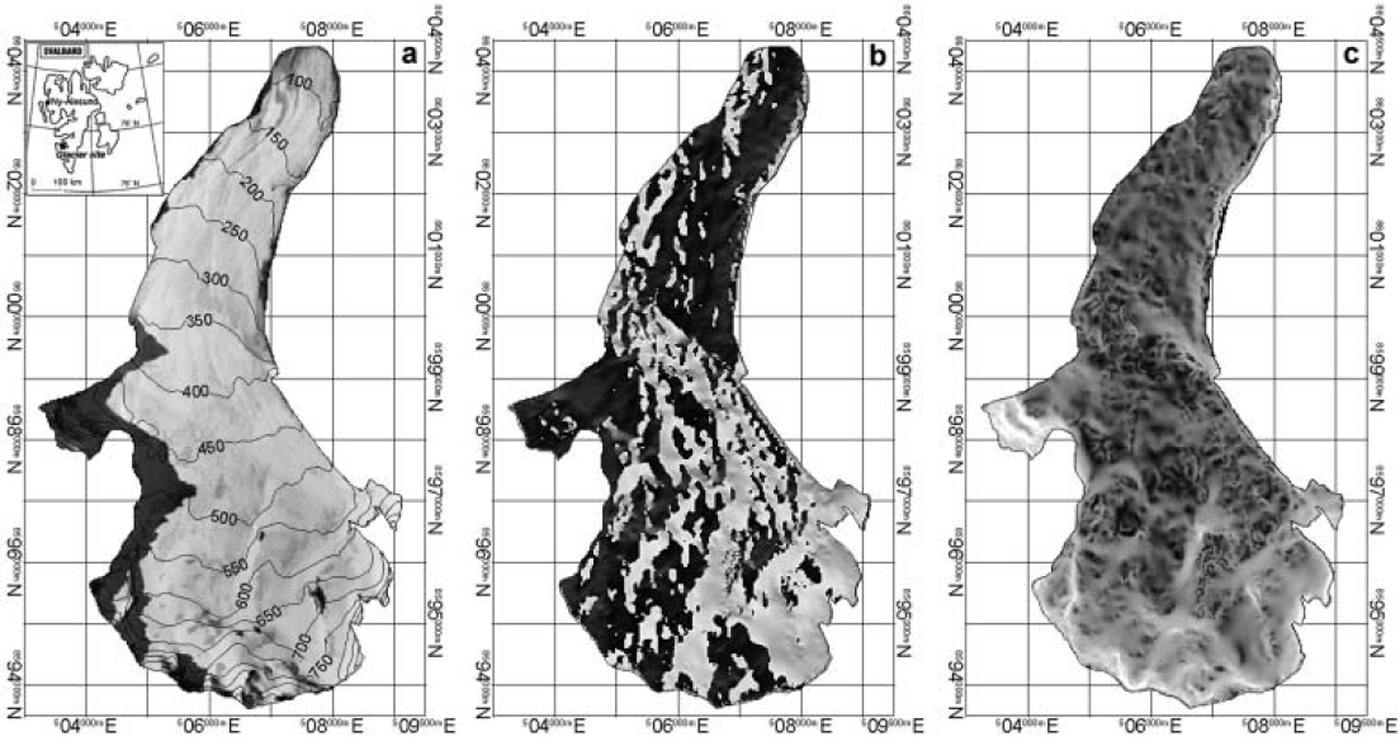
Finsterwalderbreen has a typical glacier morphology, curving in planform, with a cross-profile changing from broadly concave in the upper glacier to convex in the lower glacier (Fig. 1). The topography of the upper glacier is complicated by the presence of nunataks, which cause inflections in the elevation contours. The change from concave to convex cross-profiles means that the surface aspect also changes down-glacier, with mainly easterly-facing surfaces on the western half of the upper glacier, but mainly western-facing surfaces on the western half of the lower glacier, and vice versa. Exposure to prevailing winds and therefore snow redistribution by drifting might therefore be expected to vary systematically with location on the glacier surface. This is an example of a potential topographic control on winter accumulation other than elevation, which affects snowfall through environmental lapse rates and orography.
Glacier-wide snow-cover surveys were conducted during both April 1999 and April 2000. Snow depth was determined by simple probing at 106 (1999) and 75 (2000) locations. Because of the frequent presence of snowpack internal ice layers and because of significant glacier surface roughness, repeated probing was used at each measurement location, and the depth value recorded was the mean of three to five individual measurements over a circular area with approximate diameter 5 m. Approximately 16% of depths in the upper glacier in 2000 (only) exceeded the 2.65 m length of the snow probe; in these cases, a depth of 3.0 m was recorded. Measurement locations were recorded by hand-held global positioning system (GPS). Multiple measurements over 11–14day periods indicate location repeatability better than 20 m in 1999 and 5 m in 2000; the improvement is largely a result of the removal of Selective Availability. The repeatability of locations compares favourably with the 25 m gridcell size of the digital elevation model (DEM) used to extract topographic variables (see below). Altitude was determined from the DEM rather than the GPS, as this is expected to be more reliable.
Snow density was determined each year in snow pits at a range of altitudes on the glacier surface. In 1999, 32 snow-density samples were obtained from four pits, yielding a mean value of 380 ± 6 6 kg m–3; in 2000, 22 samples were obtained from two pits, giving a mean value of 360 ± 6 3 kg m–3. Consistent with typical observations of snow depth and density (e.g. Reference Elder, Dozier and MichaelsenElder and others, 1991), variability in the latter was small compared to variability in the former, so the single, mean density values were used to convert accumulation in metres to accumulation in metres water equivalent (w.e.) for each year. The maximum difference in mean density between different pits was 26kgm–3 (1999) and 18kgm–3 (2000), which is smaller than the standard deviation of all sample densities in each year (as noted above); the assumption of constant density therefore appears valid.
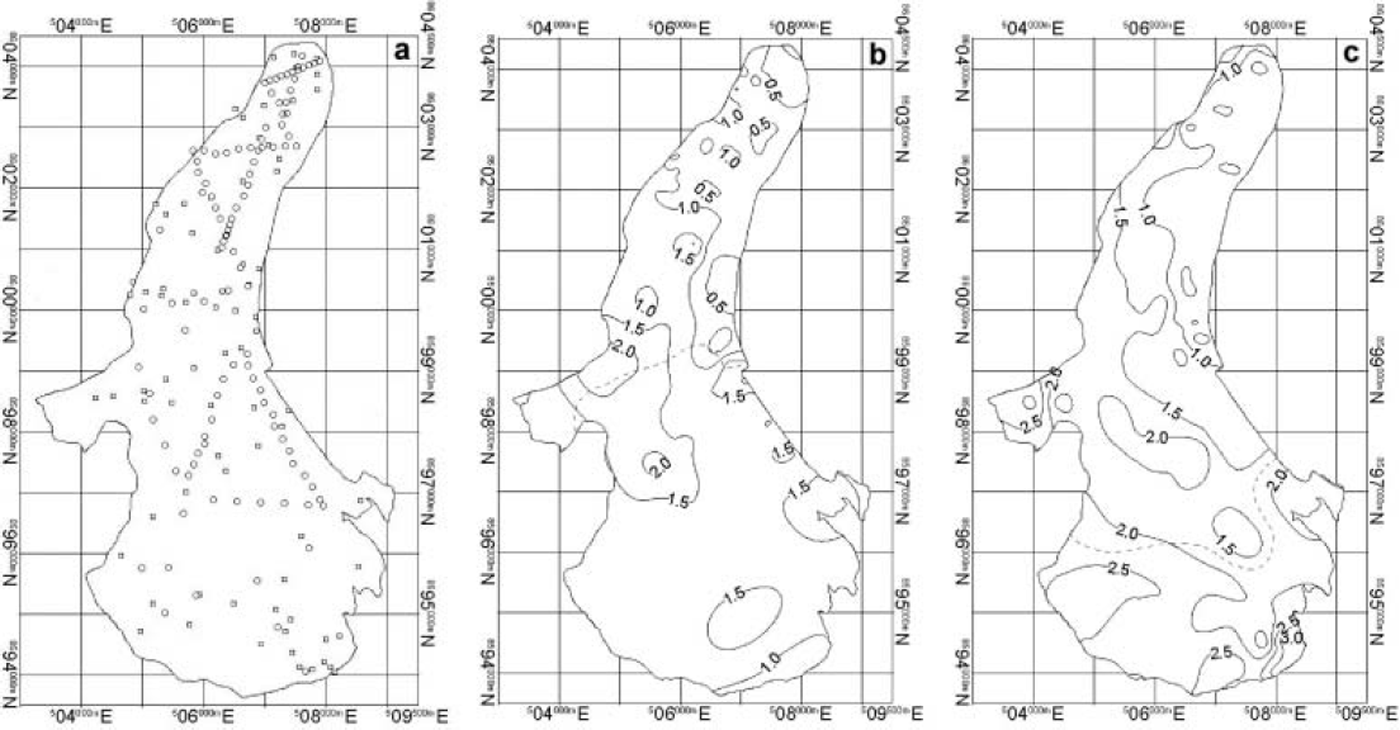
The distribution of accumulation in both years is presented in Figure 2, with descriptive statistics in Table 1. The magnitude and the spatial distribution of accumulation varied significantly between the two years. In the higher-accumulation year (2000; mean snow depth 1.61 ± 0.72 m (0.58 ± 0.26 m w.e.)), only 60% of the snow-depth variation was explained by elevation, as assessed by linear regression of snow depth on glacier surface elevation (Table 1). In the lower-accumulation year (1999; mean snow depth 1.0 × 0.49 m (0.4 × 0.19 m w.e.)), the equivalent figure was only 38%. Thus, contrary to the typical assumption, elevation is not necessarily a dominating control on the distribution of accumulation at Finsterwalderbreen, and should only be used with caution as a sole predictor of the spatial distribution of winter accumulation. These results concur with those of Reference Copland, Lane, Richards and ChandlerCopland (1998), who found that elevation failed to account for 42-69% of the variance in accumulation at Haut Glacier d’Arolla, Switzerland, in 1993.
(a) Snow-depth measuring locations, 1999 (circles) and 2000 (squares). (b, c) Distribution of accumulation/snow depth (m) over Finsterwalderbreen in 1999 (b) and 2000 (c). Point snow-depth measurements have been interpolated to a continuous surface using an iterative minimum curvature method, then contours have been located by linear interpolation of the resulting raster values (Reference SmithSmith, 2001). The dashed line is the boundary between terrain clusters (see text for further explanation). Scale and north direction are given by an underlying 1 km UTM grid.
Descriptive statistics for Finsterwalderbreen snow cover/winter accumulation

Statistical Analysis
Reference Copland, Lane, Richards and ChandlerCopland (1998) outlined a useful method for the application of terrain analysis to the spatial distribution of snow cover at an alpine glacier, involving PC and clustering analyses, which this paper adapts. Because the aims of this paper are concerned with investigating interannual differences in winter snow cover, separate analyses are conducted for 1999 and 2000. The topographic variables altitude, slope and aspect (Fig. 1) were extracted from the Finsterwalderbreen DEM for each snow-depth measurement location; restricting variable extraction to these locations is efficient in terms of the analysis, and generates a compact matrix of matched topographic and snow-depth observations. Because measurements of aspect can be misleading (e.g. aspects of 1˚ and 359˚ are very close in reality, despite their numerical values), this variable was converted into north– south aspect and east–west aspect by taking the cosine and the sine of the 0–360˚ aspect value, respectively. The four topographic variables – altitude, slope, north–south aspect and east–west aspect, for each year – were then entered into an R-mode PC analysis, and the results are summarized in Table 2. The main reason for using PC analysis here is to rewrite the dataset, replacing the original variables, which are expected to have significant colinearity (e.g. aspect is not independent of altitude, as discussed above), with fewer variables, which are weighted combinations of the originals and independent of each other. PC analysis is therefore a form of data preparation, and this is a more important function of the analysis here than simply reducing the number of variables.
PC analysis: results (see text for further explanation)
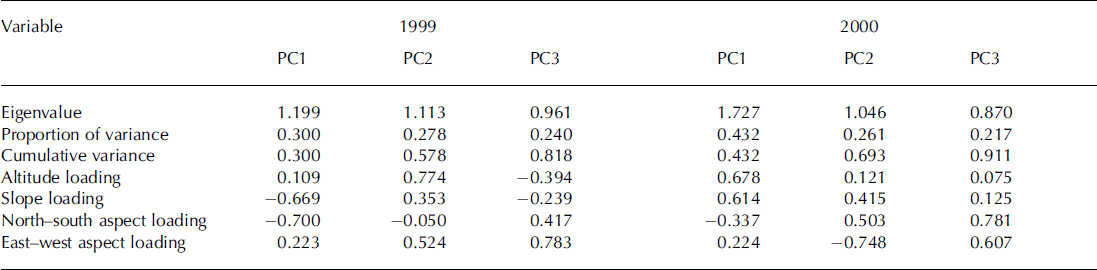
Strictly, only the first two components were significant in each case (Table 2; a component is usually considered to be significant if its eigenvalue is >1, as this represents the variance of the original variables), but, because the third component in both years explains a moderate proportion of the total variance (0.22–0.24), it was retained for the purposes of this analysis. In 1999, the maximum loading at PC1 was on north–south aspect, with slope almost as important; the maximum loading at PC2 was on altitude, and at PC3 was on east–west aspect. In 2000, the maximum loading at PC1 was on altitude, with slope almost as important; the maximum loading at PC2 was on east–west aspect and at PC3 was on north–south aspect. Only two of the six PCs over 2 years therefore exhibit maximum PC loadings on altitude; aspect was more important, with maximum loadings in the other four PCs.
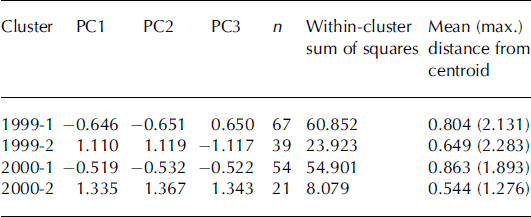
The PCs were then entered into a hierarchical cluster analysis, in order to partition the glacier surface into statistically homogeneous terrain clusters. The analysis used standardized variables, Euclidean distance and centroid linkage, which relies on determining a mean cluster position by averaging the positions of all points within each cluster, then defines the distance between clusters as the distance between pairs of cluster centroids; this is a flexible method when dealing with irregularly located sample points, and different sample points from year to year, since cluster centroids are not fixed in space. The results are presented in Table 3. Clustering was not performed on the original variables because PC analysis yields variables which are independent, weighted, combinations of those originals, and should therefore generate more robust clustering results. Initially, five clusters were generated; this worked well for the 2000 data, with a reasonable distribution of observations in each cluster (n = 9–24, or 12–32%), but not for 1999, which yielded a very uneven distribution of observations by cluster (n = 1–65, or 0.9–61%). A more balanced distribution of observations was obtained for both years when the number of clusters was reduced to two (n = 39–67, or 37–63%, in 1999; n = 21–54, or 28–72%, in 2000). This also potentially offered a more consistent comparison between the two years’ data. In 1999, the boundary between clusters can be located on the glacier surface around an altitude of about 400m (Fig. 2: note that the position of this boundary is not defined by altitude; this is simply a convenient means of describing its location), with the mean snow depth below that being 0.88 m, above it being 1.46m. In 2000, the boundary between clusters can be located on the glacier surface around an altitude of about 570 m (Fig. 2), with the mean snow depth below that being 1.32 m, above it being 2.35 m. Mean cluster characteristics are presented in Table 4.
Terrain analysis results: cluster centroids for Finsterwalderbreen in 1999 and 2000
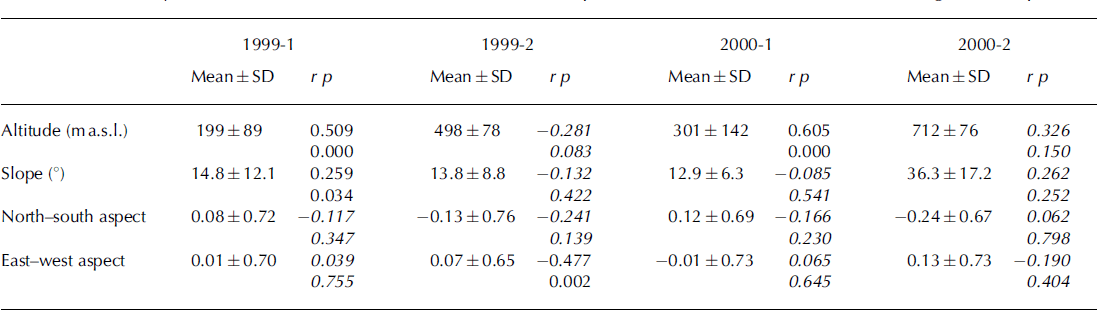
Terrain analysis results: mean cluster characteristics and snow-depth correlations (r; values in italics are not significant at p > 0.95)
Results
Table 4 presents correlations between each topographic variable and snow depth in each cluster in both years. In the first cluster (mostly the lower glacier) in 1999, altitude and slope yielded statistically significant correlations with snow depth, whereas in the second cluster (mostly the upper glacier), only east–west aspect was significant. Therefore, in the accumulation area of the glacier in this year, the amount of snow accumulation was not determined by the altitude of the surface, but essentially by whether it was facing west or east. The effect of aspect on the radiation balance is unlikely to be very important in this case, as there is 24 hour darkness for much of the accumulation period. The spatial pattern of accumulation is more likely to reflect the importance of exposure to or sheltering from prevailing (non-katabatic) westerly winds (Reference Hanssen-Bauer, Solås and SteffensenHanssen-Bauer and others, 1990) in the redistribution of snow in the upper glacier: accumulation is higher on the western side of the upper glacier, in the lee of the highest part of the adjacent watershed (Figs 1 and 2). A typical shortcoming of statistical approaches to environmental data analysis is that physical process linkages are not described, but the link between the variable aspect and the process of snowdrifting is nevertheless compellingly direct.
A contrasting pattern emerges the following year. In the first cluster (almost all of the glacier) in 2000, altitude strongly dominated, with no other significant variable. However, in the second cluster (the upper accumulation basins and close to the headwall), there was no significant relationship between snow depth and any of the topographic variables. This probably reflects the complexity of the topography in the higher parts of the upper glacier, which exhibits a wide range of slopes and aspects around the nunataks and steep catchment headwalls, confounding simple relationships between accumulation and terrain. It is notable that there was a much stronger and more consistent relationship between altitude and accumulation in a year of much higher total accumulation (the mean accumulation in 2000 is almost 48% higher than in 1999). It is tempting to speculate on a link between the magnitude of accumulation and the relative influence of different topographic variables, and the processes they imply, but a longer time series of observational data would be required to address this issue adequately. However, it does appear that the redistribution of snow is relatively less important in 2000 than in 1999.
Conclusions
Snow surveys around the end of the 1999 and 2000 winters at Finsterwalderbreen reveal significant interannual variability in both the magnitude of winter accumulation and its spatial distribution. In particular, the relationship between elevation and accumulation is much stronger in 2000 than in 1999. Statistical analysis, involving PC analysis of glacier surface topographic variables followed by clustering and subsequent correlation with measured accumulation, indicates that the relationship between a range of topographic variables and accumulation also varies from year to year: this confirms the importance, on the spatial distribution of accumulation, of elevation in 2000, although a more complex pattern of mixed elevation–slope influence in the lower glacier, and aspect influence in the upper glacier, emerges in 1999.
While elevation is often the most important topographic variable explaining the distribution of accumulation, either physically because of its control of environmental lapse rates and orography, or statistically because of colinearity between terrain variables (e.g. Reference Copland, Lane, Richards and ChandlerCopland, 1998), its explanatory power can nevertheless be quite low in a statistical sense, for instance explaining only 38% of the variance of accumulation at Finsterwalderbreen in 1999. There are also instances when the elevation–accumulation relationship is not valid at all: this study has demonstrated that east–west aspect was the sole significant predictor of winter accumulation for the accumulation area of Finsterwalderbreen in 1999. This has important implications for applications of accumulation distributions predicted from elevation alone (Reference Anderton, White and AlveraAnderton and others, 2004), and particularly for the level of confidence that can be attached to, for example, predicted mass balance or runoff if the spatial distribution of snow-covered and non-snow-covered areas is modelled inaccurately.
This study demonstrates the value of testing fundamental assumptions, such as the dominating control of elevation on accumulation. Such testing is increasingly important, given the burgeoning application of computationally sophisticated, spatially distributed mass-balance and glacier hydrological models, and their porting from location to location. In order to take full advantage of the potential these models offer, it is important that all the driving and validating data are distributed as accurately as possible.
Acknowledgements
Financial support was provided by the UK Natural Environment Research Council Thematic Grant GST/02/2204 and the University of London Central Research Fund. A. Fox (British Antarctic Survey) supplied the DEM of Finsterwalderbreen, which was photogrammetrically compiled from Norsk Polarinstitutt aerial photography (S90 3741-44, 30 July 1990). The comments of I. Willis, R. Purves and an anonymous reviewer helped improve the manuscript significantly.



