Type 2 diabetes affects an estimated 485 million adults worldwide (age-standardised prevalence of 6·5 %), yielding 37·8 million years of life lost, 41·4 million years lived with disability and greatly affecting the World’s economy, with more emphasis in low- and middle-income countries(Reference Ong, Stafford and McLaughlin1). Diet is the most important behavioural risk factor for type 2 diabetes onset, and still prevention is the best way to control diabetes burden worldwide(Reference Ong, Stafford and McLaughlin1–Reference ElSayed, Aleppo and Aroda3).
Insulin resistance, an intermediary outcome for type 2 diabetes(Reference ElSayed, Aleppo and Bannuru4,Reference González-González, Violante-Cumpa and Zambrano-Lucio5) , is also highly influenced by diet, with caloric restriction, red and processed meat, dietary fibre, food bioactive compounds and PUFA being shown to decrease homeostasis model assessment of insulin resistance (HOMA-IR) over time(Reference Weickert and Pfeiffer6–Reference Aprelini, Luft and Velasquez-Melendez9).
Monitoring diet quality across countries and over time is crucial for tracking vulnerable areas, delineating better strategies and assessing the effectiveness of government and civil society initiatives to promote healthy diets(Reference Verger, Savy and Martin-Prével10). The Healthy Diet Monitoring Initiative selected four promising healthy diet metrics: the Global Diet Quality Score (GDQS)(Reference Bromage, Batis and Bhupathiraju11), a simple food-based metric, which tracks, simultaneously, nutritional deficiency and non-communicable disease (NCD) risks from diet; the Minimum Dietary Diversity Score for Women (MDD-W), well-established as a good proxy for the probability of adequate micronutrient intake in women(12); the Global Dietary Recommendations (GDR) score, which tracks adherence to the WHO global dietary recommendations to lower NCD risk(Reference Herforth, Wiesmann and Martínez-Steele13) and the Nova ultra-processed foods (Nova-UPF) score, which tracks ultra-processed foods (UPF) intake(Reference Costa, Faria and Gabe14).
To date, only three longitudinal studies investigating type 2 diabetes risk have used these dietary metrics. In a large USA cohort(Reference Fung, Li and Bhupathiraju15), higher scores for the GDQS were associated with a lower risk of type 2 diabetes, whereas no associations were found for the MDD-W. In addition, the GDQS performance was compared with that of a well-established food and nutrient-based diet metric to track NCD-risk - the Alternative Healthy Eating Index (AHEI) – and exerted slightly weaker association with type 2 diabetes risk(Reference Fung, Li and Bhupathiraju15). Another study(Reference Damigou, Kouvari and Chrysohoou16) also reported an inverse association between the GDQS and type 2 diabetes risk in a Greek cohort study. Accordingly, a study conducted with an Iranian cohort found that the incidence of type 2 diabetes was conversely associated with GDQS quartiles(Reference Daei, Hosseini-Esfahani and Ildarabadi17). Given that most cohort studies rely on FFQ to assess usual dietary intake over extended periods, and that the GDR and Nova-UPF scores are based on sentinel foods consumed on the day before the interview, no previous cohort study has examined their performance in monitoring type 2 diabetes risk.
Therefore, considering the promising applicability of food-based healthy diet metrics to survey dietary risks, and the main role of diet in type 2 diabetes burden, the present study aimed to investigate the performance of the GDQS, the GDR score, MDD-W and Nova-UPF score in monitoring insulin resistance and type 2 diabetes risk, in comparison to AHEI – a well-known nutrient and food-based metric for diet-related chronic disease and cardiovascular risk(Reference McCullough and Willett18) – using a large contemporary Brazilian cohort longitudinal study of middle-aged and elderly adults, the Brazilian Longitudinal Study of Adult Health (ELSA-Brasil)(Reference Aquino, Barreto and Bensenor19,Reference Schmidt, Duncan and Mill20) . To conduct the analysis using the GDR score, the present study proposed a novel adaptation of its scoring process, making it available for secondary datasets in which dietary assessment was conducted using a FFQ.
Results will help guide the selection of the best dietary indicators to strategise resource allocations to control diabetes and other obesity-related NCD in Brazil and, potentially, in other countries, especially those in the Global South.
Materials and methods
Study population
The ELSA-Brasil is an ongoing prospective cohort study comprising 15 105 civil servants, aged between 35 and 74 years at baseline (2008–2010), living in six Brazilian cities located in six different states, scattered across three geographical regions: Salvador (BA), Belo Horizonte (MG), Vitoria (ES), Rio de Janeiro (RJ), Sao Paulo (SP) and Porto Alegre (RS).
Exclusion criteria and collection of socio-demographic and lifestyle characteristics, health status, food intake, blood samples and clinical and anthropometric evaluations were further detailed in the previously published ELSA-Brasil methodology(Reference Aquino, Barreto and Bensenor19). Every year, participants were contacted by phone to report on main health outcomes, and socio-demographic, lifestyle, health status and detailed clinical exams were reassessed every 4-year interval in the second wave (2012–2014) and third wave (2017–2019) of the study.
For the present study, participants were further excluded if they declined to provide information on food intake or had missing information on blood biomarkers (fasting plasma glucose, fasting plasma insulin or glycated Hb) at baseline. For diabetes incidence estimates, individuals with diabetes at baseline were excluded from the final sample.
Socio-demographic and lifestyle characteristics
Every 4 years, participants attended follow-up visits at their respective research centres for reassessment of socio-demographic characteristics, lifestyle factors, health status and detailed clinical examinations(Reference Aquino, Barreto and Bensenor19). At these visits, trained interviewers administered structured questionnaires(Reference Aquino, Barreto and Bensenor19). Participants self-reported race/skin colour as black, mixed-race, white, Asian, Indigenous or ‘do not know/do not wish to answer’ and self-classified biological sex as male or female(Reference Aquino, Barreto and Bensenor19). Household per capita income was estimated based on the previous month’s income using predefined minimum-wage categories(Reference Aquino, Barreto and Bensenor19).
Lifestyle information was also collected using structured questionnaires. Smoking status was self-reported and further classify as never, former or current smoker(Reference Aquino, Barreto and Bensenor19). Physical activity was assessed using the short form of the International Physical Activity Questionnaire(Reference Aquino, Barreto and Bensenor19). Family history of diabetes was defined as self-reported diabetes in parents or siblings(Reference Aquino, Barreto and Bensenor19).
Dietary assessment
At baseline (2008–2010), dietary intake over the past 12 months was assessed using a validated semiquantitative 114-item FFQ(Reference Molina, Benseñor and Cardoso21,Reference Mannato, Pereira and Velasquez-Melendez22) administered by trained interviewers. Before answering the FFQ, individuals were asked to report any significant changes to the usual diet in the previous 6 months and vitamins and minerals supplement use. Since no individual presented more than 10 % food items with missing values, all participants were included in the sample, and missing values were imputed with the frequency ‘never/rarely’. Individual energy intake was estimated using information from the USA Department of Agriculture FoodData Center (https://fdc.nal.usda.gov). There was no exclusion for extreme energy intake because no material difference was found in the estimated associations between healthy diet metrics and type 2 diabetes risk when analyses were conducted excluding individuals with energy intake below the 1st percentile (900 kcal) and above the 99th percentile (4790 kcal).
Scoring diet metrics
To conduct the analysis, five diet metrics were calculated using the FFQ data, following standard guidance published elsewhere: (1) GDQS, and its submetrics, GDQS+ and GDQS-(Reference Bromage, Batis and Bhupathiraju11); (2) AHEI(Reference McCullough and Willett18); (3) MDD-W(12); (4) the GDR score(Reference Herforth, Wiesmann and Martínez-Steele13) and (5) the Nova-UPF score(Reference Costa, Faria and Gabe14). Particularities of the scoring process used in the present study are briefly described below, and further details can be found in the online Supplementary Material.
To score all five dietary metrics, whenever necessary, FFQ mixed dishes were disaggregated into ingredients using standard recipes for the Brazilian cuisine, following instructions further explained elsewhere(Reference Giuntini, Coelho and Grande23). Each food or ingredient was classified into food groups according to each healthy diet metric instructions. Food classifications were double-checked by two researchers.
MDD-W was scored from 0 to 10, adding one point every time individual diets had one or more food items consumed in more than 15 g/d for each of the ten predefined food groups(12). Even though MDD-W has its main usage directed to women of reproductive age, as a proxy of micronutrient adequacy if the score reaches 5 or higher, it can be applied to other groups as a continuous score, in which case it can be called Food Groups Diversity Score (0–10). In the present study, the MDD-W continuous score was used, and it was also investigated among men(12).
The GDR score ranges from 0 to 18 and measures the adherence to eleven global dietary recommendations (mostly from WHO) protective against NCD risk(Reference Herforth, Wiesmann and Martínez-Steele13). The GDR score is based on the consumption of seventeen food-groups intake during the 24 hours before the interview, which collection is conducted using the Diet Quality Questionnaire, a structured interview containing a list of sentinel foods, adapted for a variety of countries and food settings(24). As the present study conducted dietary assessment through an FFQ, we adapted GDR scoring method by estimating the Brazilian Diet Quality Questionnaire sentinel foods probability of intake at the previous day, according to the FFQ referred frequency of intake as follows: for food items referred to be ‘never/rarely’ consumed, the estimated probability was 0; for those consumed ‘1 to 3 times-per-month’, the estimated probability was 0·07 (2 divided by 30 d); for those consumed ‘once a week’, the estimated probability was 0·14 (1 divided by 7 d); for those consumed ‘5 to 6 times-per-week’, the estimated probability was 0·79 (5·5 divided by 7 d); for those consumed ‘once a day’, ‘2 to 3 times a day’ or ‘more than 3 times a day’, the probability was 1. Each sentinel food estimated probability of intake was then used to score the GDR following instructions further detailed elsewhere(24). From twenty-one sentinel foods required to calculate the GDR score using the Brazilian Diet Quality Questionnaire, nineteen were covered by the FFQ dataset (‘Instant noodles’ and ‘packaged ultra-processed salty snacks’ were not covered). As the scoring allocates one point for consumption of ‘instant noodles’ or other foods included in the FFQ, the final score was unaffected by their absence. However, missing data for the ‘packaged ultra-processed salty snacks’ group altered the possible score range to 1–19.
The Nova UPF score is based on the consumption of twenty-three sentinel foods during the 24 hours before the interview (original score ranges from 0 to 23) to reflect the dietary share of UPF in daily intake in Brazil(Reference Costa, Faria and Gabe14). To adapt the Nova UPF score to dietary data assessed with FFQ, the twenty-three sentinel foods probability of intake were estimated according to its referred frequency of intake at the FFQ data, following the same criteria previously explained for the GDR score. From twenty-three sentinel foods, only twelve were covered using the FFQ data (modified score ranges from 0 to 12).
Given the low coverage of Nova UPF score, food items were manually classified into UPF following the Nova classification system(Reference Monteiro, Cannon and Levy25) to estimate the percentage of UPF caloric contribution to daily energy intake. The decision to exclude Nova UPF score from further analysis was made based in low concordance between the adapted Nova UPF score and the caloric contribution from UPF (linear weighted kappa = 0·37; Spearman’s correlation coefficient = 0·55, online Supplementary Table S1). This lack of alignment suggested that the adapted Nova UPF score may not be an accurate reflection of UPF consumption in the present study.
Health outcomes
Anthropometric parameters were measured by trained researchers following standard procedures(Reference Lohman, Roche and Martorell26). BMI was calculated as body weight, in kilograms, divided by the squared height, in metres. To determine nutritional status using BMI cut-off points, the WHO classification(27) was used for adults (20–59 years), and the Lipschitz(Reference Lipschitz28) classification was used for elderly individuals (≥ 60 years).
Blood samples were collected after 12 h of overnight fasting, and participants were asked to interrupt supplement use, physical exercise or drink alcoholic beverages 24 h before collection. Blood samples were used to determine the plasma glucose concentration (enzymatic method) and plasma insulin concentration (ELISA). All blood biomarker dosages were repeated for 10 % of the sample for quality assurance(Reference Schmidt, Duncan and Mill20).
Diabetes was defined according to the American Diabetes Association criteria(Reference ElSayed, Aleppo and Bannuru4), when individuals present fasting plasma glucose ≥ 126 mg/dl; or medical diabetes diagnostic (self-reported); or glycated hemoglobin ≥ 6·5 % or anti-diabetic drug use. To assess insulin resistance, the HOMA-IR was estimated by multiplying the fasting plasma glucose concentration (mmol/l) by the fasting plasma insulin concentration (mU/l), which was divided by 22·5(Reference Matthews, Hosker and Rudenski29). Given that some individuals developed diabetes during follow-up, for the HOMA-IR analysis, individuals who used insulin were further excluded (flowchart in online Supplementary Figure S1).
Statistical analysis
Continuous variables were tested for normal distribution using the Kolmogorov–Smirnov test. Categorical variables are presented as relative and absolute frequency, while continuous variables are presented as mean (sd). To compare diet metrics across baseline characteristics of the sample, Student’s t test was used whenever there were two groups, and one-way ANOVA with Bonferroni correction was used to compare multiple groups.
Diabetes relative risk was estimated using generalised linear models with Poisson distribution, log link function and robust variance, adjusted for self-declared race/skin colour (black, mixed-race, white, Asian descendants or indigenous), sex (male/female), household per capita income, age, smoking status (never smoker/ former smoker/current smoker), moderate-high level physical activity (min/d), excessive alcoholic drinking (≥ 2 servings/d), significant changes to the usual diet in the previous 6 months (yes/no), energy intake (kcal/d), vitamins and minerals supplement use (yes/no) and family history of diabetes (yes/no). Healthy diet metrics were included in the model after being transformed in Z-score to compare performances. Differences in performances between diet metrics were tested using Wald’s test. To estimate baseline BMI mediation effect on the association between healthy diet metrics and type 2 diabetes risk, the causal mediation analysis proposed by Imai and colleagues(Reference Imai, Keele and Tingley30) for binary outcomes was applied using the ‘medeff’ command, in Stata, adjusted for the same confounding factors as those used in the generalised linear models.
The sample was categorised into diet metrics quintiles to estimate relative risk, population attributable risk and prevented fraction of the population of healthy diet metrics along with other modifiable and non-modifiable protective factors to diabetes incidence, using generalised linear models with Poisson distribution, log link function and robust variance, including GDQS, GDR score or AHEI in quintiles, white self-declared race/skin color (yes/no), female sex (v. male), younger age range at baseline (35–44 years), smoking status (non-smokers) and moderate-high level physical activity. The model was adjusted for excessive alcoholic drinking (≥ 2 servings/d), modifications to the usual diet in the previous 6 months (yes/no), household per capita income, energy intake (kcal/d) and family history of diabetes. A post-estimation analysis for population attributable risk and prevented fraction of the population was conducted using Stata regpar and punaf commands, respectively.
HOMA-IR change rate over time (per year) was compared between diet metrics extreme quintiles (Q1 v. Q5) using mixed effect linear model including a diet × time interaction term in the model, adjusted for the same confounding factors used for type 2 diabetes risk assessment, with the addition of anti-diabetic medication use, and obesity treatment medication use, after excluding individuals in use of insulin therapy to eliminate extrinsic insulin uptake interference in HOMA-IR estimation. To estimate baseline BMI mediation effect on the association between healthy diet metrics and HOMA-IR change over time, the causal mediation analysis proposed by Imai and colleagues(Reference Imai, Keele and Tingley30) for continuous outcomes was applied using the ‘lmer’ function, from the ‘lme4’ package in R, adjusted for the same confounding factors as those used in the mixed effect linear model.
Except for the mixed effect linear mediation analysis, which was conducted using R, version 4.3.3 (The R Foundation for Statistical Computing), all the analyses were conducted using Stata SE®, version 17.0 (StataCorp LLC).
Results
After applying the exclusion criteria for the present study, the final sample comprised 12 254 individuals who were followed for a mean 8·2 years (6–12 years) with a total loss to follow-up of 17 % (online Supplementary Figure S1). During the follow-up period, 1515 cases of type 2 diabetes were ascertained.
The study sample was 44 % male and 56 % female and was mostly composed of individuals with self-declared white skin colour, a high level of education and nonsmokers (Table 1). According to the GDQS cut-off points, 58 % of the sample was classified as having a low-risk diet, followed by a moderate-risk diet (41 %) and a high-risk diet (1 %).
Baseline characteristics of the sample, Brazilian Longitudinal Study of Adult Health (ELSA-Brasil; n 12 254), 2008–2010

Table 1 Long description
A table summarizing baseline characteristics of a study sample. The table has 20 rows and 3 columns. The columns are labeled Characteristics, Total sample (n/mean), and %/sd. The rows are labeled with various characteristics and their corresponding values. Row 1: Sex, Male, 5372, 44. Row 2: Sex, Female, 6882, 56. Row 3: Race/skin color, Black, 1814, 15. Row 4: Race/skin color, Mixed-race, 3437, 28. Row 5: Race/skin color, White, 6594, 54. Row 6: Race/skin color, Asian descendants, 287, 2. Row 7: Race/skin color, Indigenous, 122, 1. Row 8: Age range (years), 35-44, 3035, 25. Row 9: Age range (years), 45-54, 5012, 41. Row 10: Age range (years), 55-64, 3135, 26. Row 11: Age range (years), 65-74, 1072, 9. Row 12: Nutritional status, Underweight, 130, 1. Row 13: Nutritional status, Normal weight, 5773, 47. Row 14: Nutritional status, Overweight, 3959, 32. Row 15: Nutritional status, Obesity, 2388, 20. Row 16: Educational status, Incomplete junior high, 590, 5. Row 17: Educational status, Complete junior high, 742, 6. Row 18: Educational status, Complete high school, 4168, 34. Row 19: Educational status, Complete undergraduate or above, 6754, 55. Row 20: Family income per capita, < 1 MW, 1301, 10. Row 21: Family income per capita, 1-2 MW, 2252, 18. Row 22: Family income per capita, 2-3 MW, 2446, 20. Row 23: Family income per capita, 3-5 MW, 3249, 27. Row 24: Family income per capita, 5-10 MW, 2550, 21. Row 25: Family income per capita, > 10 MW, 456, 4. Row 26: Smoking habits, Never smoked, 7178, 59. Row 27: Smoking habits, Former smoker, 3486, 29. Row 28: Smoking habits, Current smoker, 1590, 13. Row 29: Alcoholic use, Don't drink, 6264, 51. Row 30: Alcoholic use, Moderate amounts, 864, 7. Row 31: Alcoholic use, Excessive amounts, 5126, 42. Row 32: Leisure-time physical activity, Low, 9366, 76. Row 33: Leisure-time physical activity, Moderate, 1955, 16. Row 34: Leisure-time physical activity, High, 933, 8. Row 35: Supplement use, No, 9381, 77. Row 36: Supplement use, Yes, not often, 1253, 10. Row 37: Supplement use, Yes, regularly, 1609, 13. Row 38: Diet modifications in the last 6 months, Yes, 3632, 30.
BRL – Brazilian currency (Real); MW – minimum wage (equivalent to 415 BRL in 2008, 465 BRL in 2009, and 510 BRL in 2010). *Excessive amounts of alcohol was defined as ≥ 210 g/d for men and ≥ 140 g/d for women. Categorical variables are expressed as absolute (n) and relative frequencies (%), and continuous variables are expressed as the means (sd).
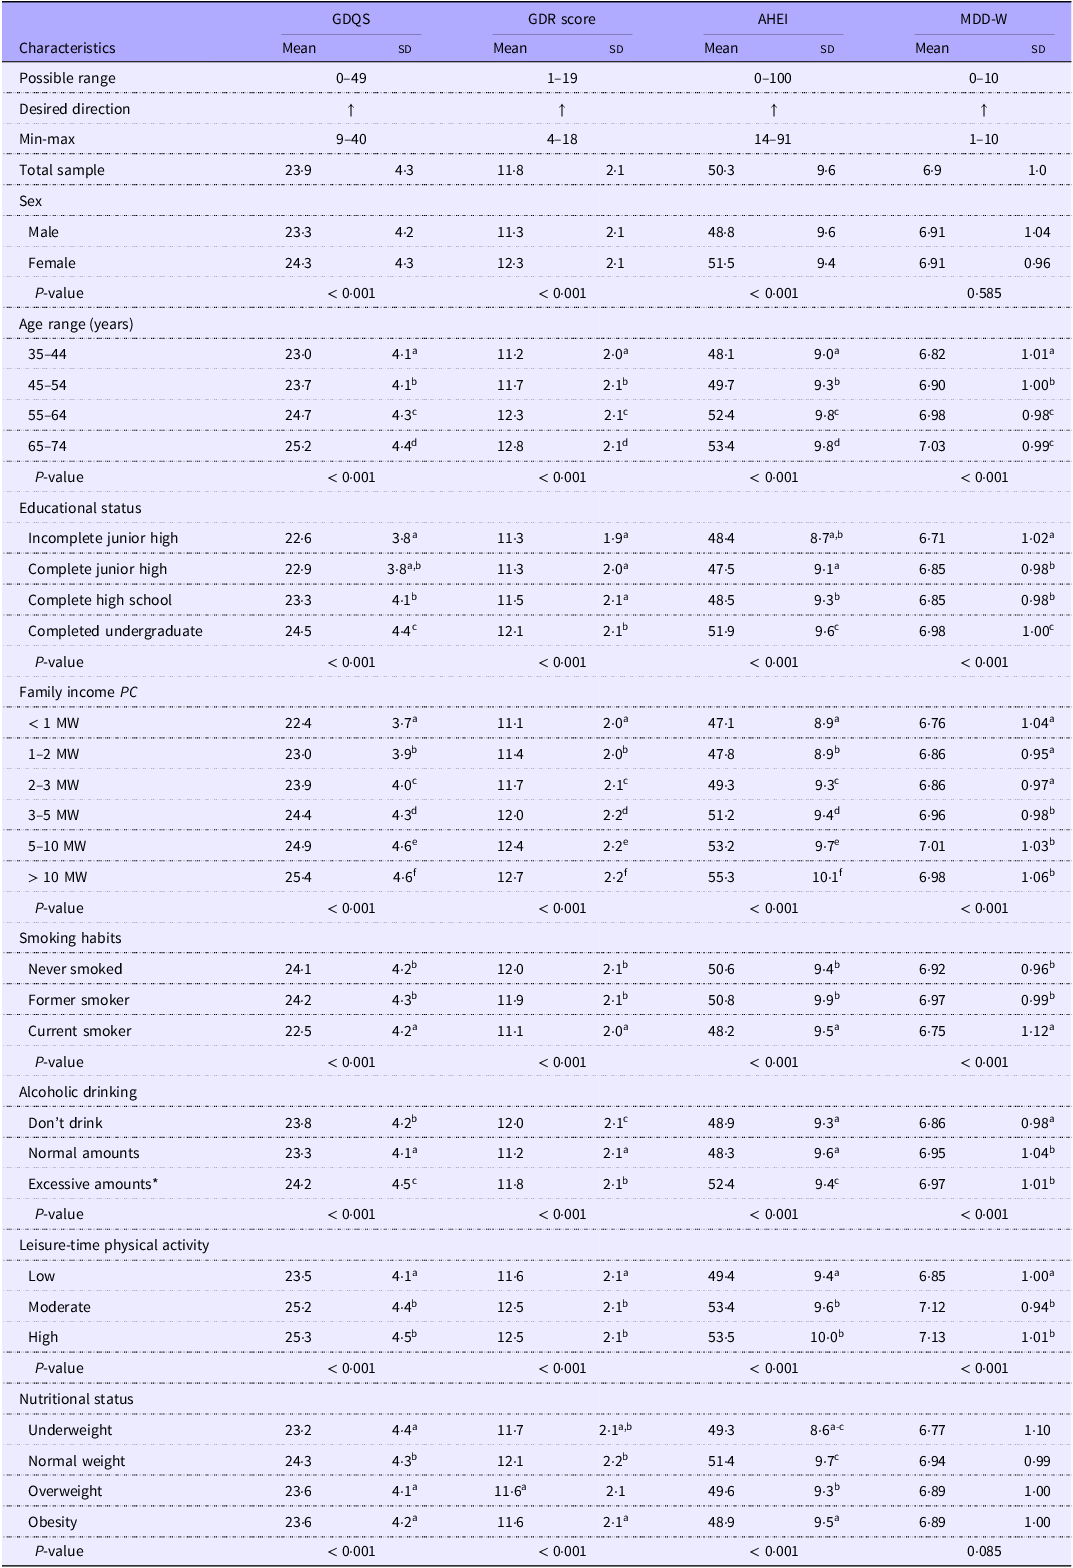
All healthy diet metrics had higher scores in individuals with higher educational statuses and in individuals in higher income categories (Table 2). Current smokers had worse scores than never smokers for all healthy diet metrics, and females had higher scores compared with males, except in MDD-W, for which no difference was found between sex. All healthy diet metrics had better scores in older age ranges and in individuals practicing moderate-to-high-level leisure-time physical activities, compared with those in low level physical activity category. The GDQS submetrics, GDQS+ and GDQS−, presented similar results to those observed for the GDQS (online Supplementary Table S2).
Healthy diet metrics across sociodemographic and lifestyle characteristics, Brazilian Longitudinal Study of Adult Health (ELSA-Brasil, 2008–2010; n 12 254)

Table 2 Long description
.
ELSA – Adults health longitudinal study; GDQS – Global Diet Quality Score; MDD-W – Minimum Diet Diversity for Women; MW – Minimum wage; PC – per capita, equivalent to 465 Brazilian currency. *Excessive amounts of alcohol was defined as ≥ 210 g/d for men and ≥ 140 g/d for women. GDQS and UPF are expressed in mean (sd). The one-way ANOVA test was used to compare means with Bonferroni post-test. Different superscript letters mean statistically significant difference.
The associations between healthy diet metrics and nutritional status (BMI age-specific cutoff points) were heterogeneous: while the GDQS, the GDR score and AHEI were greater in normal weight compared with overweight and obesity categories, no difference was observed between BMI categories for MDD-W (Table 2). Only the GDQS was higher in normal weight individuals, compared with underweight.
A lower risk for diabetes was observed in individuals with higher GDQS, GDQS−, GDR and AHEI scores, with no difference in the magnitude of the association between those diet metrics (Figure 1). With 1-sd increase in GDQS, GDQS−, GDR score and AHEI, a 5 %, 7 %, 6 % and 7 % decrease in diabetes risk was observed during follow-up period, respectively, after adjustment for potential confounders. These associations were no longer observed with further adjustment for BMI at baseline (online Supplementary Figure S2). The proportions of mediation attributed to BMI were 39·6 %, 64·8 %, 74·8 % and 59·4 % for the GDQS, GDQS−, GDR score and AHEI, respectively (causal mediation diagrams presented in online Supplementary Figure S3).
Diabetes relative risk for a 1-sd increase of Healthy Diet Metrics, Brazilian Longitudinal Study of Adult Health (ELSA-Brasil) follow-up, 2008–2019. Generalized linear models, with Poisson distribution, log link function and robust variance, adjusted for self-declared race/skin color, sex, income, age, smoking status, physical activity level, excessive alcohol intake, recent diet modification, energy intake, vitamins and minerals supplement use, and family history of diabetes. Vertical lines with caps represent 95 % CI. Wald’s test was used to test for difference in relative risk between GDQS, GDQS-, GDR score and AHEI (P-diff). AHEI – Alternative Healthy Eating Index; GDR score – Global Dietary Recommendations score; GDQS – Global Diet Quality Score; MDD-W – Minimum Diet Diversity for Women.

When exploring the prevented fraction of the population for each diet metric (comparing 5th v. 1st quintiles), along with statistically significant modifiable and non-modifiable risk factors (online Supplementary Table S3), none of the metrics had statistically significant prevented fraction of the population. Nonetheless, 3 % and 13 % new diabetes cases, respectively, could be avoided if individuals were non-smokers or practiced moderate-to-high level physical activity at baseline. In addition, 27 % of new cases of diabetes could be attributed to higher age ranges (55–74 years). Self-declared sex and skin colour were less relevant but statistically significant risk factors (online Supplementary Table S3).
HOMA-IR increase rate over time was higher in the lower quintile of GDQS, GDQS− and GDR score, compared with the upper quintile (Figure 2). Among healthy diet metrics that were associated with HOMA-IR change over time, BMI mediation effect was not statistically significant (causal mediation diagrams for all the health diet metrics presented in online Supplementary Figure S5). In a 10-year estimation period, individuals in the lower quintile for GDQS, GDQS-, and GDR at baseline, experienced an absolute mean increase in HOMA-IR that was 0·2 higher in comparison to those in the upper quintile, independently of BMI over time. Healthy diet metrics extreme quintiles (Q1 and Q5) cutoff points are presented in online Supplementary Table 43.
HOMA-IR increase rate over time in extreme quintiles – Q1 (red) and Q5 (blue) – of (a) GDQS, (b) GDQS+, (c) GDQS-, (d) GDR score, (e) AHEI, and (f) MDD-W, Brazilian Longitudinal Study of Adult Health (ELSA-Brasil) 2008–2019. Mixed effect linear models adjusted for self-declared race/skin color, sex, income, age, smoking status, physical activity level, excessive alcohol intake, anti-diabetic medication use, obesity treatment medication use, recent diet modification, energy intake, vitamins and minerals supplement use, and family history of diabetes, after excluding individuals in use of insulin therapy. Differences in HOMA-IR increasing rate per year between Q1 v. Q5 were tested including a healthy diet metric × time interaction term in the model. Vertical lines with caps represent 95 % CIs. (h) Comparison of HOMA-IR changes over time between healthy diet metrics was conducted using Wald’s test and different letters indicate statistically significant differences. AHEI – Alternative Healthy Eating Index; GDR score – Global Dietary Recommendations score; GDQS – Global Diet Quality Score; HOMA-IR – Homeostasis Model Assessment of Insulin Resistance; MDD-W – Minimum Diet Diversity for Women.

Discussion
The present study compared performances between the most promising food-based healthy diet metrics according to their ability to monitor diet-related type 2 diabetes risk. The present study revealed that some metrics, such as the GDQS (mainly through its GDQS- submetric), the GDR score, and AHEI are equally associated with type 2 diabetes risk, mediated by BMI. Moreover, we showed that the HOMA-IR increase rate over time is lower with higher scores for the GDQS, the GDQS-, and the GDR.
Given that diet quality is a complex concept, when comparing different healthy diet metrics, it is imperative to consider how each metric was developed and which healthy aspects of diet they were designed to capture(Reference Verger, Savy and Martin-Prével10). A low MDD-W (< 5) is linked to nutrient inadequacy but not to overnutrition outcomes like obesity(12). Accordingly, MDD-W was not a good indicator for diet-related type 2 diabetes risk or HOMA-IR progression over time.
The AHEI, on the other hand, is a good indicator of diet-related type 2 diabetes risk, as shown by the present study and by previous studies conducted with different populations, reviewed elsewhere(Reference Jannasch, Kröger and Schulze31). AHEI scoring system, however, needs information on nutrients (long-chain n-3 fatty acids, trans fatty acids, and sodium) daily intake, which is an important limitation for the use of this metric for global dietary monitoring, since many developing countries do not have their own food composition data(Reference Charrondiere, Haytowitz and Stadlmayr32). This raises interest in food-based metrics that exhibit comparable results to those observed for AHEI, such as the GDR score and the GDQS.
To our knowledge this is the first study to investigate the association of the GDR score with incident type 2 diabetes. In the present study, a 1-sd increase in the GDR score was associated with 6 % lower risk of type 2 diabetes, comparable to what was found for AHEI (P-diff = 0·984). Ideally, the GDR score can only be derived from primary dietary data collection or by 24-hour recall assessments. To overcome this limitation, we proposed a new approach to calculate the GDR score using the frequency of intake, from the FFQ data, to estimate the probability to answer ‘yes’ in the Brazilian version of the Diet Quality Questionnaire. Given that the GDR score is a promising tool for global dietary monitoring, this proposed adaptation may expand its applicability to retrospective analyses of existing dietary survey data.
In contrast to what was observed for the GDR score, the Nova-UPF score original sentinel food-items had a low coverage using ELSA-Brasil FFQ dataset (12 out of the 23 original sentinel food items were contemplated), which led to the decision not to apply the NOVA-UPF score, a proxy for UPF intake, in the present study. The limited coverage of sentinel items likely reflects methodological constraints of the FFQ, which was originally developed to capture the most frequently consumed foods within the ELSA-Brasil cohort, rather than to ensure the inclusion of specific NOVA sentinel food items(Reference Molina, Benseñor and Cardoso21). Nevertheless, evidence derived from studies that directly estimated UPF consumption using FFQ data indicates moderate-to-high quality evidence supporting a dose-response relationship between UPF consumption and type 2 diabetes incidence, as reviewed elsewhere(Reference Chen, Khandpur and Desjardins33,Reference Vitale, Costabile and Testa34) . In accordance with current evidence, one study conducted with ELSA-Brasil cohort found that every 150 g increment in daily UFP intake was associated with a 5 % increase in type 2 diabetes risk(Reference Canhada, Vigo and Levy35).
Two previous studies have investigated the association between the GDQS and its submetrics with type 2 diabetes risk. Similar to what was found in the present study, Fung et al. (Reference Fung, Li and Bhupathiraju15), conducted a secondary analyses with the Nurses’ Health Study II cohort and showed a 7 % reduction in type 2 diabetes incidence for each 1-sd increase in GDQS, mainly attributed to GDQS- submetric. In turn, Damigou et al. (Reference Damigou, Kouvari and Chrysohoou16), using the ATTICA epidemiological cohort, found that each 1 point increase in the GDQS was associated with a 2 % lower risk of type 2 diabetes, but this association was mainly attributed to variations in the GDQS+ submetric. The different influence of GDQS submetrics across studies may be due to differences in local dietary patterns, given that GDQS+ and GDQS- mean scores and variation are different across nations, meaning that different components of the diet may be the key drivers for increased NCD risk depending on population dietary habits. In the present study, the GDQS association with type 2 diabetes risk was similar to that observed for AHEI (P-diff = 0·630; Figure 2), which favors the GDQS usage as a good indicator to monitor type 2 diabetes risk from diet.
In addition to their association with type 2 diabetes risk, the GDQS and the GDR score were associated with HOMA-IR increase rate over time, given that individuals in the lowest quintiles for both metrics had a statistically higher HOMA-IR increase rate in comparison to those in the highest quintiles. HOMA-IR is a simple and good indicator of insulin resistance, an intermediary outcome for type 2 diabetes(Reference ElSayed, Aleppo and Bannuru4,Reference Matthews, Hosker and Rudenski29) . By reducing body weight and body fat mass - especially visceral fat-, caloric restriction, and low energy-dense diets can highly improve insulin sensitivity(Reference González-González, Violante-Cumpa and Zambrano-Lucio5). Moreover, there are other elements of diet quality that can influence insulin sensitivity independently of their effects on body weight. For instance, dietary fiber(Reference Weickert and Pfeiffer6) and food bioactive compounds(Reference Carnauba, Sarti and Coutinho7) are associated with improved insulin sensitivity, whereas an unfavorable fatty acid profile(Reference Wanders, Blom and Zock8) and processed meat consumption(Reference Aprelini, Luft and Velasquez-Melendez9) are associated with reduced insulin sensitivity. In fact, in the present study, metrics that included food sources of dietary fiber, food bioactive compounds, and polyunsaturated fatty acids in their scoring process, such as the GDQS (and its submetric GDQS+) and the GDR score, had no statistically significant BMI mediation effect on their association with HOMA-IR increase rate over time.
Unlike the GDR score, the GDQS was developed to monitor diet quality from the double burden of malnutrition perspective and was validated against undernutrition and diet-related NCD risk endpoints, such as micronutrient deficiency, inadequate nutrient intake, anthropometric indicators of undernutrition and obesity, and obesity-related metabolic disorders, in different populations(Reference Bromage, Batis and Bhupathiraju11). In a previous study with the Brazilian population(Reference Norde, Bromage and Marchioni36), using a nation-wide population-based dataset, the GDQS was associated with key-nutrient intake and overall nutrient adequacy, with a similar performance as that observed for the well-established MDD-W. Those findings reinforce the GDQS ability to monitor diet-related risk for both ends of malnutrition: nutrient deficiency and obesity-related metabolic disorders, such as insulin resistance and incident type 2 diabetes.
Combining data on diabetes prevalence, incidence and mortality, it is estimated that a 35-year-old Brazilian man has a 26·4 % risk, and a 35-year-old Brazilian woman has a 28·0 % risk of developing diabetes by the age of 80, with an estimated 32·9 and 38·7 years lived with the condition, respectively(Reference Bracco, Gregg and Rolka37). In addition, previous studies conducted with ELSA-Brasil cohort showed that only 21 % of participants with diabetes were able to achieve glycemic control, blood pressure and cholesterol targets to avoid complications and cardiovascular events, highlighting the difficulties with treatment adherence and efficacy(Reference Chwal, dos Reis and Schmidt38). In light of this, prevention strategies, such as improving dietary quality and practicing moderate-to-low level physical activity, could have a significant impact on reducing both the diabetes burden in Brazilian health system and healthcare costs.
The present work has some limitations. First, inherent to observational studies, there is a possibility of residual confounding despite adjustments for multiple covariates. Additionally, the ELSA-Brasil sample is predominantly composed of individuals with self-declared white skin color, higher education, and income, which were included as adjustments in the statistical models. ELSA-Brasil is currently the largest prospective cohort on adults’ health in Brazil and was designed to balance individuals from both sexes and comprise states from North to South of the Brazilian territory(Reference Aquino, Barreto and Bensenor19,Reference Schmidt, Duncan and Mill20) .
In conclusion, since the AHEI, GDR score, and GDQS demonstrate similar effectiveness in assessing diet-related type 2 diabetes risk, the choice of which to use ultimately depends on how diet quality monitoring is operationalised. Food-based metrics, such as the GDR score and GDQS, offer the advantage of not relying on detailed food composition data, making them particularly suited for monitoring diet-related type 2 diabetes risk in lower resources settings.
Supplementary material
For supplementary material/s referred to in this article, please visit https://doi.org/10.1017/S0007114526106886.
Acknowledgements
The ELSA-Brasil received funding from the National Council for Scientific and Technological Development (CNPq) (Wave 1: BA 01 06 0212-00; ES 01 06 0300-00; MG 01 06 0278-00; 01 06 0071-00; RS 01 06 0010-00; SP 01 06 0115-00 ; Wave 2: BA 01 10 0742-00; ES 01 12 0284-00; MG 01 10 0746-00; RJ 01 11 0093-01; RS 01 10 0643-03; SP 01 10 0773-00; Wave 3: BA 405551/2015-0; ES 405543/2015-8; MG 405552/2015-7; RJ 405544/2015-4: RS 405545/2015-0; SP 405547/2015-3). The Obesity and Comorbidities Research Center is one Research, Innovation and Dissemination Center (CEPID) supported by the Sao Paulo Research Foundation (FAPESP) (grant n. 2013/07607-8). M. M. N. post-doc fellowship was granted by FAPESP as part of the CEPID agreement (grant n.2022/08172-4). S. B. research is funded by National Institutes of Health (NIH, T32 DK 007703 and D43 TW010543). A. M. C. is funded by FAPESP (2022/03091-6). E. G. is funded as an American Cancer Society Clinical Research Professor (CRP-23-1014041). None founding agencies had any involvement or restrictions regarding the work presented here.
M. M. N., L. T. C., D. M. L. M., I. M. B., and P. A. L. contributed to the conception and design of the study. S. B., M. D., E. G., A. C. V., and B. G. contributed to improving the statistical analysis and interpretation of the results. M. M. N. and A. M. C. conducted food classification into healthy diet metric food groups. M. M. N. conducted diet metric scoring and statistical analysis and wrote the first draft of the manuscript. All the authors contributed to manuscript revision and approved the submitted version. All authors declare that the content has not been published elsewhere.
The authors declare that they have no competing interests.
The data that support the findings of this study are available from ELSA-Brasil research group but restrictions apply to the availability of these data, which were used under license for the current study and therefore are not publicly available. The dataset and statistical code are available from the authors upon reasonable request and with permission of ELSA-Brasil research group.
The ELSA-Brasil protocol was approved by each investigation center’s Ethics Committee and by the National Research Ethics Committee of Brazil (detailed information in the online Supplementary Material). Participation was voluntary, all participants signed an informed consent form, and the study protocol was in accordance with Brazilian norms in Research Ethics with Human Beings (resolution 466/2012) and the Declaration of Helsinki.