


Introduction
The physical properties of snow, which change with time and temperature cycling, are important from the viewpoint of materials science and engineering for avalanche research and forecasts, snow melt forecasts and water-resources management. In our research of snow properties at temperatures of –15 to 0°C (Reference Takei and MaenoTakei and Maeno, 2001), we reported a peak phenomenon: the low-frequency electric conductivity of snow samples showed a peak around –2°C. Since a snow sample is an aggregate of ice particles, the peak phenomenon of the conductivity strongly suggests the destruction and reconstruction of contacts between ice particles in a thermal environment near the melting temperature. However, the nature of the contact is still not clear.
The mechanical properties of snow have been investigated by many researchers and connected to the microstructure of snow, such as size, shape and arrangement of ice particles, and the number and state of bonds between ice particles (Reference MellorMellor, 1975; Reference SommerfeldSommerfeld, 1982; Reference Shapiro, Johnson, Sturm and BlaisdellShapiro and others, 1997; Reference Frolov and FedyukinFrolov and Fedyukin, 1998; Golubev and Reference Frolov and FedyukinFrolov, 1998; Reference Lehning, Bartelt, Brown, Fierz and SatyawaliLehning and others, 2002). We have tried to look at the problem of the bonds between ice particles in the measurement of the mechanical properties of snow by comparing elastic-wave velocity with dielectric response (Reference Takei and MaenoTakei and Maeno, 2003). In this paper, we show the elastic properties of snow samples which were sintered near the melting temperature, and discuss the significance of the bonds for the mechanical properties of snow.
Experimental Method
Samples measured were made of stored snow disintegrated by sieving. Ice particles released from stored snow were put through two sieves of different mesh (e.g. 1 and 2 mm diameter). Low-density samples (<400 kgm–3) were directly prepared by putting ice particles into a sample cell (No. 1 cell: a vessel of 90 mm diameter and 30 mm height with piezoelectric elements). High-density samples (>400 kgm–3) were prepared by first packing them into a metal cylinder of 30 mm diameter and 45 mm height and lightly compressing them with a metal piston (Fig.1a) and then setting them into a sample cell with piezoelectric elements (No. 2 cell: Fig. 1b). The compressed sample was 30 mm in diameter and about 30 mm in height. Good contact between the sample and the piezoelectric elements was achieved by coating the elements with lithium grease with a working temperature of –25 to 120°C (AZ Inc., #720).
Schematic representation of (a) the metal cylinder for the sample preparation, and (b) the sample cell for the mechanical measurement by the vibration response technique. The diameter of the cylindrical sample was 30 mm. The contact between the sample and the piezoelectric elements was produced with grease.

The measuring cell was constructed of double vessels, an outer vessel and an inner vessel surrounded with heater wire for temperature control. The measuring cell was set in a freezer maintained at –16 ± 1°C. The inner vessel containing the sample cell could be controlled with a temperature stability of ±0.01°C.
The measuring system consisted of a frequency-response analyzer (NF Electronic Instrument, FRA5090) for the mechanical measurements, a digital voltmeter (Hewlett-Packard, 3478A) for temperature measurements and a computer (NEC, PC9801) for controlling and recording through the general-purpose interface bus. Measurements were performed in a frequency range from 10Hz to 1MHz and in a temperature range from –15° to –0.1°C. The data for temperature dependence were obtained from samples kept for 2 hours at each temperature.
We carried out the mechanical measurements of snow samples by means of a vibration response technique. By using snow samples with piezoelectric elements fixed at both ends, we can excite the sample at one end and observe signals through the sample at the other end. The data obtained are the intensity ratio and the phase shift of the output signal (from the piezoelectric element as a sensor) compared with the input signal (to the element as a violator). The intensity ratio (dB) is given by a logarithmic relation between the output Vout and input Vinput voltage amplitudes (=20 log(Vout/Vinput)). The piezoelectric element used was a piezo-ceramic 14 mm in diameter and 0.22 mm thick (constructed on a brass plate 20 mm in diameter and 0.20 mm thick). The resonance frequencies of the sensor were 6 kHz for the brass plate and 126 kHz for the piezo-ceramic.
Results and Discussion
Figure 2a and b show the frequency response (intensity ratio and phase shift, respectively) of a snow sample (density 478 kgm–3, grain-size <1mm) in the frequency range 10Hz to 1MHz in the sintering process at –16.5°C. The noise around 60 Hz was produced from the power line of 60 Hz. The peak signals around 120 kHz correspond to the resonance frequency of the piezoelectric elements used, which show no change over time. The signals in the frequency range 10–40 kHz shift toward the high-frequency region with time. Therefore, we can consider the signals to be introduced from the mechanical vibration responses of the snow sample.
Frequency dependence of the mechanical response for a snow sample (density 478 kgm–3, grain-size <1mm) in the frequency range 10 Hz to 1MHz in the sintering process at –16.5°C. (a) The intensity ratio (dB) and (b) the phase shift (°) against the input vibration signal. The five lines in each graph show the results of measurements 1, 12, 24, 38 and 48 hours after sample preparation.
Figure 3a–c show the mechanical vibration responses of a snow sample (density 441kgm–3, grain-size1–2mm at –0.11°, –0.66° and –9.87°C, respectively. A broad peak of the intensity ratio at around 20–30 kHz with the first 180° phase shift indicates a fundamental vibration of the longitudinal wave through the snow sample. On the other hand, signals (each pair of sharp dip and peak) of the intensity ratio around 12 and 24 kHz with each peak of the phase shift suggest resonance of the transverse wave. Since these two signal patterns are mirror images of each other, we infer that the first signal around 12 kHz corresponds to a fundamental vibration of resonance with a half-wavelength of the transverse wave, and the second signal around 24 kHz to an overtone vibration with a full wavelength. The dip-and-peak signals decayed near the melting temperature, which suggests that the bond connections weakened and allowed ice particles to move and slip more easily.
Frequency dependence of the intensity ratio (dB) (solid lines) and the phase shift (lines marked with crosses) against the input vibration signal for a snow sample with 441kgm–3 density and 1–2 mm grain-size at (a) –0.11°C, (b) –0.66°C and (c) –9.87°C. The results are for the snow sample in the third heating and cooling process. f180 and fp with arrows are the frequency at the 180° phase shift of the longitudinal wave and at the peak of the phase shift around the first resonance of the transverse wave, respectively.
We can obtain a propagation velocity of the elastic wave through the sample by using the phase shift and the sample size. The propagation velocity VL of the longitudinal wave is

where L is the sample length between the piezoelectric elements and f180 is the frequency at the 180° phase shift of the input vibration. The propagation velocity VT of the transverse wave is
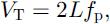
where fp is the frequency at the peak of the phase shift around the first transverse resonance.
Figure 4a–c show the elastic velocity of snow samples of different densities, with heating and cooling processes in the temperature range from –15° to –0.1°C. The elastic velocities of the longitudinal and transverse wave show a large decrease near the melting temperature. The elastic velocities of each snow sample increase with time and temperature cycling. Our measurements were performed after the sample had been kept at each temperature for 2 hours. This increase with temperature cycling is caused by an enhanced bond growth (namely growth of bond neck radius) near the melting temperature. On the other hand, we can see that the elastic velocity is larger at larger sample densities. Similar density dependence was reported by Reference Yamada, Hasemi, Izumi and SatoYamada and others (1974), Reference MellorMellor (1977), Reference SommerfeldSommerfeld (1982) and Reference Frolov and FedyukinFrolov and Fedyukin (1998). Since our results show that velocity increases with temperature cycling, a data spread of previous results is partially due to differences in the bond radius within snow.
Temperature dependence of the elastic-wave velocities for three snow samples with different densities and for several heating and cooling processes. (a) density 511kgm–3, grain-size1–2 mm; (b) density 441kgm–3, grain-size1–2 mm; (c) density 309 kgm–3, grain-size 2–4 mm. The velocities of the longitudinal wave are indicated by open symbols, and the velocities of the transverse wave by solid symbols.
The elastic-wave velocities VL and VT of a homogeneous elastic material are given as:

where E and ν are Young’s modulus and Poisson’s ratio respectively, and ρ is the density of the material (Reference MellorMellor, 1977). According to Equation (3), an increase in density introduces a decrease in velocity, but the results for snow show the opposite effect. In the case of snow, therefore, the change in elastic properties E and ν is of greater effect than the change in density.
The 511 and 441kgm–3 samples in Figure 4a and b, whose elastic velocities are larger at larger sample densities, have a similar grain-size. The main difference in microstructure is presumably the number of bonds (and the arrangement of particles or air space). We assume that the number increases with increasing density and that the number of bonds contributes mainly to the elastic properties. This assumption is supported by the fact that the low-density sample with a larger grain-size (Fig. 4c) shows smaller velocities than the high-density samples, since we can expect a small number of bonds. In the case of a low-density sample, however, the arrangement of particles (or air space) may also be important because of increasing porosity.
Since the sample density did not change much during our experiments with temperature cycling, the change in propagation velocities results from the change in elastic properties. We can calculate the elastic properties (Poisson’s ratio ν and Young’s modulus E) from the elastic-wave velocities VL and VT. From Equation (3),

Figure 5 shows Poisson’s ratio and Young’s modulus for a snow sample (density 511kgm–3, grain-size 1–2mm) with temperature cycling. Poisson’s ratio of the snow samples of densities 441 and 511kgm–3 was 0.35 ± 0.01 below –0.6°C (although the 441kgm–3 sample shows a larger value of 0.38, in the first heating), and drops to 0.29 or less at –0.1°C. The fall in Poisson’s ratio at –0.1°C suggests that ice particles in the snow sample can easily move near the melting temperature. Young’s modulus of snow samples at –0.1°C decreased by about 25–34% compared to the values at lower temperatures, below –0.6°C. Young’s modulus at –10°C is 2.8 × 10⁸ Pa in the first heating, 5.8 × 10⁸ Pa in the first cooling and 8.9 × 10⁸ Pa in the fifth cooling for the 441 kgm–3 sample, and 6.3 × 10⁸ Pa in the first heating, 1.0 × 10⁹ Pa in the first cooling and 1.6 × 10⁹ Pa in the sixth cooling for the 511 kgm–3 sample. These values of Young’s modulus are slightly larger than those obtained from natural-snow and core samples in previous researches using pulse or high-frequency measurements (Reference MellorMellor, 1975).
Temperature dependence of Poisson’s ratio (a)and Young’s modulus (b) of the snow sample (density 511kgm–3, grain-size 1–2 mm) with temperature cycling. The elastic properties were derived from longitudinal and transverse elastic wave-velocities in Figure 4a with Equation (4).
Figure 6 shows the temperature dependence of the propagation velocities of the elastic wave through the snow sample with 441 kgm–3 density in the third heating and cooling process, and also of a polycrystalline ice sample having only a few crystal boundaries. The propagation velocity of ice in Figure 6, which resulted from the longitudinal wave by the same measuring method, decreases slightly with increasing temperature. These values of ice are slightly larger than in previous data (Reference Gammon, Kiefte and ClouterGammon and others, 1983), but show similar temperature dependence. The velocity of the longitudinal wave through the snow sample also decreased with increasing temperature, and decreased significantly above –0.6°C. The velocity of the transverse wave through the snow sample did not change markedly (or increases slightly around –1°C) up to –0.6°C with increasing temperature, and decreases significantly above –0.6°C. The results in Figure 6 show that the propagation velocities of snow during the cooling process after the highest temperature is reached have a thermal hysteresis above –0.6°C and are larger than during the heating process below –0.6°C, but ice does not show such an increase or hysteresis.
Temperature dependence of the longitudinal and transverse elastic-wave velocities for the snow sample with 441kgm–3 density and 1–2 mm grain-size, and of the longitudinal elastic-wave velocity for a polycrystalline ice sample with few crystal boundaries. The results of the velocities are from samples in the third heating and cooling process.
The snow mechanical response has been discussed based on snow texture and ice mechanical properties (Reference C. and SchweizerCamponovo and Schweizer, 2001). A similar temperature dependence of the longitudinal-wave velocity of snow and ice below –0.6°C mainly reflects ice mechanical properties. Above –0.6°C the large decrease in velocity of the snow sample suggests a change in snow texture, since ice shows a smaller decrease. Snow texture is characterized by the number of bonds, arrangement of ice particles, grain-size, radius of bonds and state of the boundary between ice particles. The number of bonds, arrangement and size of ice particles in the snow sample would not change much in this case, but the radius of bonds and the state of the boundary between ice particles should be affected significantly in temperature cycling. The observations of a large decrease and a thermal hysteresis of the elastic velocities above –0.6°C suggest pre-melting or generation of weak layers in the bond connection and boundary in the snow sample. It is possible that pre-melting occurred in the boundary between ice particles near the melting temperature because of the high-energy state due to misfits of the crystal lattice, and even to impurities included in natural snow (Reference Dash, Fu and WettlauferDash and others, 1995; Reference WettlauferWettlaufer, 1999a, Reference Wettlauferb). Pre-melting of the grain boundary may contribute to the drop of Poisson’s ratio above –0.6°C. It is natural to consider that bonds between ice particles grow by evaporation, surface diffusion and condensation of water molecules in the sintering process. If pre-melting and refreezing of the grain boundary occur with temperature cycling, growth of the bond neck radius will be accelerated. This bond growth causes the increase in elastic strength and elastic velocities of the sample during cooling.
Concluding Remarks
The propagation velocity of the longitudinal wave through snow samples decreased with increasing temperature below –0.6°C, but the velocity of the transverse wave did not change markedly. The propagation velocities of the longitudinal and transverse waves decreased significantly with increasing temperatures above –0.6°C. Poisson’s ratio and Young’s modulus were derived from the velocities. Poisson’s ratio of snow samples showed a value of 0.35 ± 0.01 below –0.6°C, and droped to 0.29 or less at –0.1°C. Young’s modulus of snow samples at –0.1°C decreased by about 25–34% compared to the values below –0.6°C. Hysteresis of the elastic-wave velocities and decay of signals of the transverse wave above –0.6°C were observed. These phenomena near the melting temperature suggest pre-melting or weakening of the boundary between ice particles in the snow samples. The elastic-wave velocities and Young’s modulus of snow samples change with snow density and with time and temperature cycling. The velocities and Young’s modulus are suggested to be mainly affected by the number of bonds, by the radius of bonds and by the states of boundaries between ice particles.
Acknowledgements
The authors would like to express their sincere thanks to the reviewers and the scientific editor J. Schweizer for their valuable suggestions. This work was partly supported by the Grant-in-Aid (B(2)14390002) for Scientific Research of the Ministry of Education, Science and Culture, Japan, and the cooperative research fund of the Institute of Low Temperature Science, Hokkaido University.



