Introduction
Rapid genetic progress and better nutrition have led to significant improvements in dairy cow milk yield in recent decades; however, this has been accompanied by a dramatic decline in cow fertility. A decline in the first service conception rate of approximately 1% per annum has been reported worldwide (Butler et al., Reference Butler, Cherney and Elrod1995; Royal et al., Reference Royal, Mann and Flint2000; Evans et al., 2004). Reproductive inefficiency is a significant financial problem for the dairy industry and especially for seasonal pasture-based dairy production systems such as practised in Ireland (Horan et al., Reference Horan, Dillon, Faverdin, Delaby, Buckley and Rath2005).
Nutrition, particularly energy nutrition, fundamentally impacts reproduction. For example, in early post partum dairy cows because energy demand exceeds energy intake, cows typically enter a state of negative energy balance (NEB), which is associated with poor reproductive performance. Prolonged depletion of body reserves during early lactation (see review by Butler, Reference Butler2001) or even short-term fluctuations in energy intake (Dunne et al., Reference Dunne, Diskin, Boland, O’ Farrell and Sreenan1999) can impair both the resumption of ovarian activity post partum and/or conception rates.
Supplemental fats are often included in the diet of dairy cows to reduce the energy deficit experienced in early lactation. Aside from the beneficial effects on the FA composition of milk (see review by Bauman and Griinari, Reference Bauman and Griinari2003), fat supplementation, and in particular polyunsaturated fatty acid (PUFA) supplementation, has been reported to positively influence cow reproductive performance (see reviews, Wathes et al., Reference Wathes, Abayasekara and Aitken2007; Staples et al., Reference Staples, Burke and Thatcher1998); however, the specific mechanisms involved are ill defined (Wathes et al., Reference Wathes, Abayasekara and Aitken2007).
The inclusion of dietary fat has been reported to increase follicle number and diameter (Lucy et al., Reference Lucy, Gross and Thatcher1990; Lammoglia et al., Reference Lammoglia, Willard, Hallford and Randel1997). Furthermore, fat supplementation may increase systemic concentrations of progesterone through either increased de novo synthesis or reduced hepatic metabolism (Hawkins et al., Reference Hawkins, Niswender, Oss, Moeller, Odde, Sawyer and Niswender1995). Additionally, Mattos et al. (Reference Mattos, Staples and Thatcher2000) proposed that n-3 PUFA may reduce uterine PGF2α secretion and/or decrease the sensitivity of the corpus luteum (CL) to PGF2α. This may improve fertility by reducing the degree of embryonic loss associated with the inadequate suppression of PGF2α in early pregnancy.
In contrast to the effects of n-3 PUFA, the essential n-6 PUFA, linoleic acid, which is a precursor to arachidonic acid (AA) can increase dienoic PGs, including PGF2α (Petit et al., Reference Petit, Dewhurst, Scollan, Proulx, Khalid, Haresign, Twagiramungu and Mann2002). While a reduction in PGF2α would be beneficial in the context of inhibiting luteolysis during the breeding season, stimulation of early post partum PGF2α has been associated with improved uterine health (Abayasekara and Wathes, Reference Abayasekara and Wathes1999) and uterine involution (Guilbault et al., Reference Guilbault, Thatcher, Collier, Wilcox and Drost1985).
The objective of the current study was to examine the effects of feeding diets rich in either n-3 (eicosapentaenoic (EPA), and docosahexaenoic acids (DHA)) or n-6 (linoleic acid) PUFA on concentrations of reproductive and metabolic hormones, metabolites, ovarian follicle dynamics and CL diameter in cattle. A nulliparous heifer model was used to avoid possible confounding effects of lactation and associated NEB.
Materials and methods
Animals and oestrous cycle synchronisation
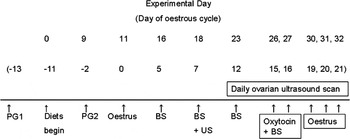
Reproductively normal nulliparous crossbred beef heifers (n = 24) with a mean ± s.e.m. age of 20 ± 2 months and liveweight of 442 ± 10 kg were oestrus synchronised using two injections (PG1 & PG2) of a 500μg of prostaglandin F2 (PG) analogue (Cloprostanol, Estrumate®; Schering-Plough Ltd, Shire Park, Welwyn Garden City, Hertfordshire, UK), administered intramuscularly 11 days apart (Figure 1). Observation for oestrous activity was carried out using an electronic heat mount detection system (Heatwatch®; DDx Inc., Denver, CO, USA) combined with visual observations at 0700, 1100, 1500, 1900 and 2300 h beginning 24 h after the second prostaglandin administration; this heat check was repeated towards the end of the subsequent oestrous cycle.
Sequence of injection and collection of samples. PG = prostaglandin (Estrumate®), BS = Blood sample, US = ovarian ultrasound scan.

Experimental diets and feeding regime
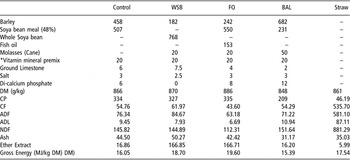
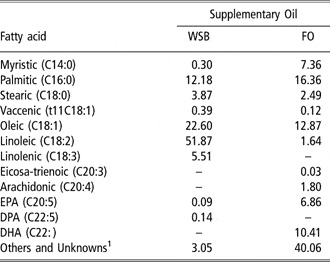
Animals were housed in slatted floor pens, blocked on liveweight and body condition score (BCS) and randomly assigned, within block, to one of three concentrate and straw-based diets (n = 8 per diet). The concentrates contained either (i) no added lipid (CON); (ii) 2% added fat as supplemental whole raw soya beans (WSB) or (iii) 2% added fat as supplemental fish oil (FO). The FO was derived from mixed fish species, predominantly herring and mackerel (United Fish Industries Grade 1 fish oil, United Fish Industries, Killybegs, Co. Donegal, Ireland). The ingredient composition and chemical analysis of the three concentrates as well as the chemical analysis of the straw is presented in Table 1. The FA composition of the WSB and fish oil is presented in Table 2. The WSB and FO diets were formulated to provide approximately 150 g/head per day of soya oil and fish oil, respectively. All diets were formulated to be isonitrogenous (14% crude protein (CP) in total diet dry matter (DM)). Animals were allocated to diets following response to PG1 and diets were offered for 32 days.
Ingredient composition (g/kg as fed) and the chemical analysis (expressed as g/kg of DM unless otherwise stated) of the concentrates and forage

Abbreviations are: DM = dry matter; CP = crude protein; CF = crude fibre; ADF = acid detergent fibre; ADL = acid detergent lignin; NDF = neutral detergent fibre.
*Vitamin mineral premix contained: vitamin A, 320 000 IU/kg; vitamin D3 80 000 IU/kg; vitamin E (α-tocopherol), 100 mg/kg; cobalt as cobalt carbonate, 200 mg/kg; zinc as zinc oxide, 4000 mg/kg; iodine as potassium iodate, 320 mg/kg; calcium, 120 g/kg; phosphorus, 50 g/kg; and magnesium, 100 mg/kg.
Fatty acid composition of WSB and FO used (g/100 g FAME)

Abbreviations are: EPA = eicosapentaenoic acid; DPA = docosapentaenoic acid; DHA = docosahexaenoic acid.
1Denotes fatty acids identified but not reported and quantified but unidentified peaks.
The animals were offered their respective daily lipid supplement in a 1 kg DM bolus feed at 0900 h each day. At 1200 h each day, animals were offered 4.5 kg DM of a balancer ration (Table 1) and 1.5 kg DM straw. All animals were individually fed using an electronic feeding system (Calan Inc., Northwood, NH, USA).
Liveweight and body condition scoring
Animals were weighed on days 0, 16, 27 and 32. At the start (days 0 and 1) and the end (days 31 and 32) of the experiment liveweight was taken as the mean of weights measured on each of two successive days. The weighing scales were calibrated at regular intervals using known weights.
Feed sampling and analysis
Weekly composite samples of straw and concentrates were stored at −20°C until analysed for DM, CP, crude fibre (CF), acid detergent fibre (ADF), acid detergent lignin (ADL), neutral detergent fibre (NDF), ether extract, ash and gross energy (GE). Samples were milled through a 1-mm screen using a Christy and Norris hammer mill (Christy and Norris Process Engineers Ltd, Chelmsford, England). DM was determined by oven drying at 104°C for a minimum of 16 h. Ash was determined on all materials after ignition of a known weight of ground material in a muffle furnace (Nabertherm, Bremen, Germany) at 550°C for 4 h. Crude fibre was determined on all samples using a Fibertec extraction unit (Tecator, Hoganas, Sweden) according to the method of Van Soest et al. (1991). CP (total nitrogen*6.25) was determined using the method of Sweeney (Reference Sweeney1989) using a Leco FP 528 nitrogen analyser (Leco Instruments, UK Ltd, Newby Road, Hazel Grove, Stockport, Cheshire, UK). Ether extract was determined using a Sortex instrument (Tecator, Hoganas, Sweden) while the gross energy of the samples was determined using a Parr 1201 oxygen bomb calorimeter (Parr, Moline IL, USA).
Blood sampling
Blood samples were collected for measurement of plasma concentrations of progesterone (P4), oestradiol (E2), 13,14 dihydro, 15-keto prostaglandin F2α (PGFM), FAs, cholesterol, glucose, triglycerides, urea, non-esterified fatty acids (NEFA) and β-hydroxybuterate (BHBA). Blood was collected by jugular venipuncture under license in accordance with the European Community Directive, 86-609-EC. Blood sampling for FAs and metabolites was carried out in the morning immediately prior to feeding. Samples for determination of P4 and E2 were also collected in the morning before feeding and again at 1500 h. Samples (10 ml) were collected into ethylene diamine tetraacetic acid (EDTA) heparinised vacutainers (Becton Dickinson Vacutainer Systems, Plymouth, UK) for the determination of plasma concentrations of P4 and into lithium heparinised vacutainers (Becton Dickinson Vacutainer Systems) for plasma concentrations of E2, FAs, metabolites and PGFM. On collection, samples were immediately stored in ice water and centrifuged at 1500 × g at 4°C for 15 min. Plasma was harvested, and stored at −20°C pending analysis. Samples for the measurement of progesterone in plasma were collected on the day of standing oestrus (day 0), and again on days 5, 6, 7, 10, 15, 16, 19 and 20. Blood samples for determination of plasma concentrations of oestradiol were collected on a daily basis from day 12 of the oestrus cycle through to day 17. Blood samples for FA and metabolite concentrations were collected on day 10 and day 27 of the experimental period.
Oxytocin challenge
To examine the effect of dietary treatment on plasma PGFM, the animals were administered an oxytocin challenge on days 15 and 16 of the oestrous cycle. Blood samples were taken at −60 and again at 0 min to measure basal PGFM concentrations. A 10 ml dose of oxytocin (50 IU; Oxytocin-TAD, AniMedica GmbH, Senden-Bosensell, Germany) was administered intravenously into a jugular vessel immediately after the 0 time point sample. Subsequent blood samples were collected again at 15, 30, 45, 60, 75 and 90 min after oxytocin administration.
Blood hormone and metabolite analysis
Progesterone was measured using the Coat-a-Count assay procedure (Coat-a-Count; Diagnostic Products Corporation, Los Angeles, CA, USA). The intra- and inter-assay coefficients of variation for samples containing low (0.26 ± 0.08 ng/ml), medium (2.43 ± 0.26 ng/ml) and high (6.59 ± 0.78 ng/ml) concentrations of P4 were 13.1% and 27.0% (low), 6.8 and 8.6% (medium) and 9.7% and 8.3% (high). The minimum detectable concentration of the assay was 0.10 ± 0.04 ng/ml (mean ± s.e.m.).
Oestradiol was determined as described by Prendiville et al. (Reference Prendiville, Enright, Crowe, Finnerty, Hynes and Roche1995) using an oestradiol MAIA assay kit (Biostat Ltd, Stockport, UK). The mean intra-assay and inter-assay coefficients of variation for samples containing low (0.53 ± 0.02 pg/ml), medium (2.13 ± 0.08 pg/ml) and high (4.43 ± 0.30 pg/ml) estradiol concentrations were 10.7% and 4.2% (low), 7.0% and 3.9% (medium) and 11.3% and 6.9% (high), respectively. The sensitivity of the assay was 0.3 pg/ml.
Blood plasma was analysed for glucose, triglyceride, NEFA, BHBA, urea and cholesterol concentrations using appropriate kits and an ABX Mira auto analyser (ABX Mira, Cedex, France).
Plasma concentrations of PGFM were measured in 100 μl samples of whole plasma as described previously (Robinson et al., Reference Robinson, Pushpakumara, Cheng, Peters, Abayasekara and Wathes2002). The tracer (13,14-dihydro-15-keto[5, 6, 8, 9, 11, 12, 14(n)- 3H]-prostaglandin F2α) was obtained from Amersham International PLC (Amersham, Bucks, UK), the standards were supplied by Sigma (Poole, UK) and the antiserum was a kind gift from Prof Rodney W Kelly (MRC Human Reproduction Sciences Unit, Centre for Reproductive Biology, University of Edinburgh, UK). The sensitivity of the assay was 14.0 pg/ml. Intra- and inter-assay coefficients of variation were 6.6% and 3.7%, respectively.
Fatty acid analysis of feed and plasma
Total lipids were extracted from 1 ml of plasma and from 6 g of feed sample using chloroform methanol (2 : 1 v/v) as described by Folch et al. (Reference Folch, Lees and Stanley1957). Methylation was carried out for both plasma and feed samples by in situ transesterification with 0.5N methanolic NaOH followed by 14% boron trifluoride in methanol as described by Park and Goins (Reference Park and Goins1994). The fatty acid methyl esters (FAME) were separated using a CP Sil 88 column (100 m × 0.25 mm i.d., 0.20 μm film thickness; Chrompack, Middleburg, The Netherlands) and quantified using a gas liquid chromatograph (3400; Varian, Harbor City, CA, USA). The internal standard used was heptadecanoic acid (C17:0; Sigma-Aldrich Ireland Ltd) and the GC was calibrated using a range of commercial FA standards (Sigma-Aldrich). The GC was fitted with a flame ionisation detector and helium (37 psi) was used as the carrier gas. The injector temperature was held isothermally at 225°C for 10 min and the detector temperature was 250°C. The column oven was held at an initial temperature of 140°C for 8 min and then programmed to increase at a rate of 8.5°C/min to a final temperature of 200°C, which was held for 41 min. Data were recorded and analysed on a Minichrom PC system (VG Data System, Manchester, UK).
Follicular dynamics and CL diameter
Follicular dynamics and the diameter of the pre-ovulatory follicle were determined for each heifer via transrectal ovarian ultrasonography (7.5-MHz transducer; Aloka SSD-500, Aloka Ltd, Tokyo, Japan) from day 7 of the oestrous cycle until ovulation. The diameter of the CL was measured on day 7 post oestrus.
Statistical analyses
Data were first checked for adherence to a normal distribution (PROC UNIVARIATE, SAS v. 9.1, 2002). Continuous data were analysed using two-way ANOVA with terms included for diet and block. Variables having more than one observation per subject such as DM intake (DMI), average daily gain (ADG), plasma analytes and follicular dynamics were analysed using repeated measures ANOVA (PROC MIXED, SAS v. 9.1, 2002) with terms for diet, time period and their interaction included in the model and animal within diet set as the error term. The type of variance–covariance structure used was chosen depending on the magnitude of the Akaike criterion (AIC) for models run under compound symmetry, unstructured, autoregressive or Toeplitz variance–covariance structures. The model with the lowest AIC was selected. The PDIFF (predicted difference) and CONTRAST (for orthogonal contrasts) statements of SAS (v. 9.1, 2002) were used, and the Tukey test was applied as appropriate to evaluate pairwise comparisons of treatment means. While individual concentrations of E2 and P4 did not effect PGFM concentrations, the E2 : P4 ratio was found to have an affect and therefore was used as a covariate in the analysis of treatment effects on PGFM.
Results
Dry matter intake and animal performance
There was no effect (P > 0.05) of diet on either daily DMI (7.19 ± 0.05 v. 7.17 ± 0.07 v. 7.07 ± 0.11 kg/day for CON, WSB and FO, respectively) or ADG (0.80 ± 0.17 v. 0.67 ± 0.07 v. 0.90 ± 0.11 kg/day for CON, WSB and FO, respectively).
Plasma concentration of fatty acids
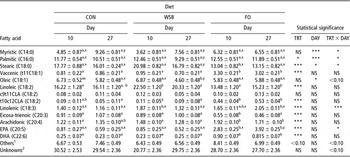
The effect of diet and day of sampling on the FA profile of plasma is shown in Table 3. Amongst the shorter chain FAs, vaccenic acid increased on the FO diet, while palmitic and stearic acid remained similar. Several FAs showed a statistically significant treatment × day of sampling interaction: myristic acid increased with time on CON and WSB but not on FO whereas palmitic, stearic and oleic all decreased with time on WSB but not on CON or FO. As expected, heifers fed the WSB diet had higher concentrations of the n-6 PUFA linoleic acid in comparison with the other two diets. Concentrations of the n-3 PUFA linolenic acid decreased with time on treatment in CON and WSB but increased in FO. Heifers fed the FO diet had higher (P < 0.0001) concentrations of the n-3 PUFAs linolenic acid (P < 0.001), EPA and DHA in comparison with the control diet, whereas eicosatrienoic acid was reduced in FO. The n-6 PUFAs AA and t10, c12 CLA were both higher (P < 0.0001) on the FO diet than on either control or WSB diets. There were diet × day of sampling interactions for linolenic acid and EPA where both FA increased with time on FO but did not change (P > 0.05) on either WSB or CON.
Effect of diet on fatty acid concentrations (g/100 g FAME) of plasma collected on day 10 and 27 of the 32-day trial period (mean ± s.e.m.)

a,bWithin diet, concentrations with different superscripts are different (P<0.05). x,yWithin day, concentrations with different superscripts are different (P < 0.05).
P < 0.10 is accepted as approaching statistical significance.
1Denotes fatty acids quantified but not reported.
2Denotes fatty acids quantified but not identified.
Plasma metabolites
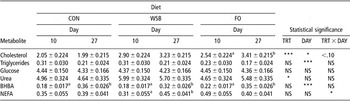
The effect of diet on plasma concentrations of metabolites is presented in Table 4. Plasma concentrations of triglycerides decreased with time on all diets whereas BHBA increased. Supplementation with PUFA increased cholesterol concentrations and also caused a time related change in NEFA: with increases with time on WSB (P < 0.05) but no change in NEFA with time in either CON or FO (P > 0.05). Heifers on WSB had the highest concentration of urea while plasma concentrations of glucose were not altered by diet (P > 0.05).
The effect of diet on plasma metabolite concentrations (mmol/l; mean ± s.e.m.)

Within diet, concentrations with different superscripts are different (P < 0.05).
P < 0.10 is accepted as approaching statistical significance.
Plasma progesterone and oestradiol and the effect of progesterone, oestradiol and the oestradiol : progesterone ratio on concentrations of 13,14-dihydro-15-keto-prostaglandin F2α
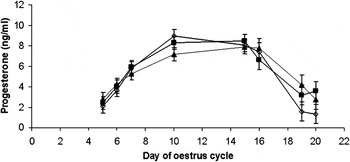
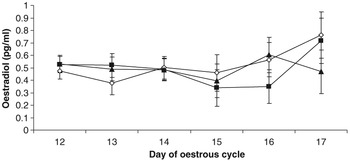
There was no diet × sample day interaction or effect of diet on plasma concentrations of either progesterone or oestradiol (P > 0.05) on any day of the oestrous cycle (Figures 2 and 3).
Plasma concentrations of progesterone (ng/ml) of heifers fed CON (▪, n = 8), WSB (◊, n = 8) or FO (▴, n = 8) diets.

Plasma concentrations of oestradiol (pg/ml) of heifers fed CON (▪, n = 8), WSB (◊, n = 8) or FO (▴, n = 8) diets.

There was no effect (P > 0.05) of concentrations of either progesterone or oestradiol on plasma PGFM on either day 15 or 16 of the oestrous cycle. However, there was an effect (P < 0.001) of the oestradiol : progesterone ratio on PGFM on both days. Consequently, the oestradiol : progesterone ratio was included as a covariate in the analysis of diet effects on PGFM concentrations outlined in the next section.
Plasma 13,14-dihydro-15-keto-prostaglandin F2α
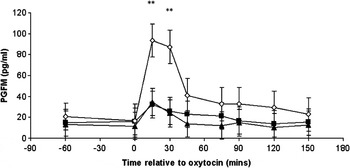
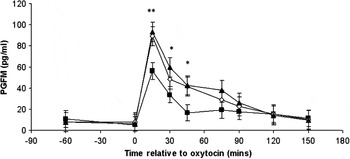
The effect of diet on plasma concentrations of 13, 14-dihydro-15-keto-prostaglandin F2α (PGFM) produced in response to an oxytocin challenge on days 15 and 16 of the oestrous cycle is shown in Figures 4 and 5. Although there were no (P > 0.05) diet × day × time or diet × time interactions for concentrations of PGFM, there was a diet × day of oestrous cycle interaction (P < 0.01). On day 15, PGFM concentrations were higher (P < 0.01) on WSB at 15 and 30 min post oxytocin compared with either CON or FO, which were similar (P > 0.05). On day 16, however, concentrations of PGFM at 15 min post oxytocin were similar (P > 0.05) for FO and WSB, which were both higher (P < 0.01) than CON while at 30 min post oxytocin concentrations for FO and WSB groups were again similar (P > 0.05) but only FO was higher than CON (P < 0.05). At 45 min post oxytocin on day 16, PGFM concentrations on FO and WSB were similar and both higher (P < 0.05) than CON.
Plasma concentrations of prostaglandin F2α metabolite (PGFM) on day 15 of the oestrus cycle of heifers fed CON (▪, n = 8), WSB (◊, n = 8) or FO (▴, n = 8) diets following correction for P4 : E2 (**P < 0.01).

Plasma concentrations of prostaglandin F2α metabolite (PGFM) on day 16 of the oestrus cycle of heifers fed CON (▪, n = 8), WSB (◊, n = 8) or FO (▴, n = 8) diets following correction for P4 : E2 ratio (**P < 0.01; *P < 0.05).

Oestrous cycle length, ovulatory follicle and corpus luteum diameter
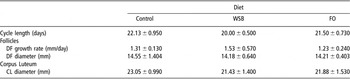
There was no effect of diet on the length of the oestrous cycle, or on the maximum diameter or growth rate of the pre-ovulatory follicle (P > 0.05; Table 5). The diameter of the CL (Table 5) measured on day 7 post oestrus was not affected by diet (P > 0.05). There was no relationship between CL diameter measured on day 7 of the oestrous cycle and P4 concentrations on any day of the oestrous cycle (P > 0.05).
The effect of treatment on cycle length, dominant follicle size and growth rate and corpus luteum diameter on day 7 post oestrous (mean ± s.e.m.)

Discussion
In this study there was no effect of diet on DMI. Whitlock et al. (Reference Whitlock, Schingoethe, AbuGhazaleh, Hippen and Kalscheur2006) reported no adverse effects on DMI when feeding fish oil up to 1% of dietary DM to lactating dairy cows; however, inclusion rates of 2% resulted in an 11% decrease in DMI (Whitlock et al., Reference Whitlock, Schingoethe, Hippen, Kalscheur, Baer, Ramaswamy and Kasperson2002). Jordan et al. (Reference Jordan, Kenny, Hawkins, Malone, Lovett and O’Mara2006), using the same WSB source as used in the current study, attributed the 20% depression in DMI recorded in young bulls fed a 30% WSB ration ad libitum to a reduction in the palatability of the diet. However, the relatively low level of WSB (12.5%) fed in the current study was unlikely to have had a negative impact on DMI. The similarity in daily DMI across diets was mirrored in animal performance with no effect on ADG, consistent with the report of Wistuba et al. (Reference Wistuba, Kegley and Apple2006).
Despite evidence of a diet × day interaction for plasma concentrations of some FA measured, concentrations of most FA were generally consistent with other published reports (Filley et al., Reference Filley, Turner and Stormshak2000; Burns et al., Reference Burns, Engle, Harris, Enns and Whittier2003) involving similar dietary approaches. Consequently, rather than discussing the effect of diet on each FA measured, we focus on a select number of FAs in the context of their potential biological roles in metabolism and reproduction. The addition of the whole soya beans increased the concentrations of linoleic acid in plasma consistent with other studies involving dietary supplementation of cattle with a source of linoleic acid (Filley et al., Reference Filley, Turner and Stormshak2000; Burns et al., Reference Burns, Engle, Harris, Enns and Whittier2003). The linoleic acid content of cattle follicular fluid and of oocytes is apparently important for oocyte developmental competence (Homa and Brown, Reference Homa and Brown1992) and has been shown to be important for blastulation in in vitro fertilisation studies (Zeron et al., Reference Zeron, Ocheretny, Kedar, Borochov, Sklan and Arav2001). A recent study by Scholljegerdes et al. (Reference Scholljegerdes, Lake, Weston, Rule, Moss, Nett and Hess2007) has shown the oviduct to be more sensitive in terms of reflecting the effects of additional dietary linoleic acid compared to either the uterus or hypothalamus, further suggesting a potential role for this PUFA in fertilisation and early embryo development.
Despite low available dietary concentrations, the relatively higher plasma concentrations of the essential n-3 PUFA linolenic acid in the FO-fed animals, compared with either WSB or CON, suggest that FO may have interrupted the ruminal biohydrogenation of the linolenic acid coming from the other ingredients in the ration. Linolenic acid is the parent n-3 PUFA, with some limited elongation to the longer chain n-3 PUFA, EPA and DHA occurring. An in vitro study by Mattos et al. (Reference Mattos, Guzeloglu, Badinga, Staples and Thatcher2003) showed linolenic acid to be effective in suppressing PGF2α from phorbol ester-stimulated bovine endometrial (BEND) cells. Furthermore, cows supplemented with linolenic acid were shown to have had higher concentrations of oestradiol during the follicular phase of the oestrous cycle than unsupplemented cows (Robinson et al., Reference Robinson, Pushpakumara, Cheng, Peters, Abayasekara and Wathes2002).
In the current study, FO supplementation increased plasma concentrations of EPA and DHA in agreement with previous studies involving dietary enrichment with either fish oil (Mattos et al., Reference Mattos, Staples, Arteche, Wiltbank, Diaz, Jenkins and Thatcher2004) or fish meal (Burns et al., Reference Burns, Engle, Harris, Enns and Whittier2003; Wamsley et al., Reference Wamsley, Burns, Engle and Enns2005). However, despite a greater dietary concentration, the transfer of DHA from diet to plasma was less than for EPA in the current study. This may have been a consequence of greater ruminal biohydrogenation and/or a poorer efficiency of absorption. While the majority of studies have shown a greater rate of transfer from diet to milk for DHA compared with EPA (Cant et al., Reference Cant, Fredeen, MacIntyre, Gunn and Crowe1997; Mattos et al., Reference Mattos, Staples, Arteche, Wiltbank, Diaz, Jenkins and Thatcher2004), a recent study from our laboratory has shown EPA to be transferred more efficiently to a number of key reproductive tissues including uterine endometrium and follicular fluid (Childs et al., Reference Childs, Sreenan, Hennessy, Stanton, Diskin and Kenny2007).
There was little effect of diet on the plasma metabolites measured in the current study. While glucose is the main energy source of the ovary (Rabiee et al., Reference Rabiee, Lean, Gooden, Miller and Scaramuzzi1997) and of the post-blastulation bovine embryo (see review, Boland et al., Reference Boland, Lonergan and O’Callaghan2001), there was no effect of dietary lipid on systemic glucose. The literature on the effects of fat supplementation on systemic glucose is inconsistent and this may be a consequence of variable dietary effects on DMI and milk production, neither of which were factors in the present study. Triglycerides, the storage form of excess fat, were unaffected by diet, consistent with previous studies (Hightshoe et al., Reference Hightshoe, Cochran, Corah, Kiracofe, Harmon and Perry1991; Lammoglia et al., Reference Lammoglia, Willard, Oldham and Randel1996), but in contrast to others that have shown increases in triglyceride concentrations in animals on a high lipid diet (Wehrman et al., Reference Wehrman, Welsh and Williams1991) or abomasally infused with fats (Oldick et al., Reference Oldick, Staples, Thatcher and Gyawu1997). These differences can be attributed to varying energy and physiological states of the animals employed across the different studies. Dietary lipid source did not affect plasma concentrations of either NEFA or BHBA in the present study. There is some disagreement in the literature regarding the effect of fat supplementation on systemic concentrations of both NEFA and BHBA and these differences may again be attributed to variance in the metabolic status of the animals employed in the different studies.
Circulating cholesterol is the primary precursor for mammalian synthesis of luteal progesterone (Staples et al., Reference Staples, Burke and Thatcher1998). In the present study, fat supplementation increased plasma cholesterol consistent with previous reports (Grummer and Carroll, Reference Grummer and Carroll1991; Hawkins et al., Reference Hawkins, Niswender, Oss, Moeller, Odde, Sawyer and Niswender1995). However, despite the increase, we failed to establish any effect of either fat source on systemic concentrations of progesterone, in agreement with the findings of some studies (Lammoglia et al., Reference Lammoglia, Willard, Hallford and Randel1997; Mattos et al., Reference Mattos, Staples, Williams, Amorocho and McGuire2002; Wamsley et al., Reference Wamsley, Burns, Engle and Enns2005) but in contrast to others who reported increases (Hawkins et al., Reference Hawkins, Niswender, Oss, Moeller, Odde, Sawyer and Niswender1995; Burke et al., Reference Burke, Carroll, Rowe, Thatcher and Stormshak1996) and decreases (Robinson et al., Reference Robinson, Pushpakumara, Cheng, Peters, Abayasekara and Wathes2002). The literature on the effect of fat supplementation on systemic oestradiol is similarly confused with studies reporting increases (Lammoglia et al., Reference Lammoglia, Willard, Hallford and Randel1997; Robinson et al., Reference Robinson, Pushpakumara, Cheng, Peters, Abayasekara and Wathes2002), decreases (Hightshoe et al., Reference Hightshoe, Cochran, Corah, Kiracofe, Harmon and Perry1991) or no change (Beam and Butler, Reference Beam and Butler1997; Sartori et al., 2004). As in these latter reports, the systemic concentrations of oestradiol were not affected by diet in the current study, despite the fact that variation due to stage of cycle was eliminated through the use of oestrous cycle synchronisation.
The size of the pre-ovulatory follicle has been positively related to improved pregnancy rate in cattle (Lopes et al., Reference Lopes, Butler, Gilbert and Butler2007). However, we found no effect of diet on follicle size or dynamics, in agreement with Petit et al. (Reference Petit, Dewhurst, Proulx, Khalid, Haresign and Twagiramungu2001). Other studies, however, have reported increases in the size of follicles in both dairy (Robinson et al., Reference Robinson, Pushpakumara, Cheng, Peters, Abayasekara and Wathes2002) and beef cows (Lammoglia et al., Reference Lammoglia, Willard, Oldham and Randel1996) supplemented with fat.
AA is an essential pre-cursor to the synthesis of PGF2α. In the current study, AA was highest in the plasma of animals supplemented with FO and this is consistent with other studies on plasma (Burns et al., Reference Burns, Engle, Harris, Enns and Whittier2003) and studies on milk (Mattos et al., Reference Mattos, Staples, Williams, Amorocho and McGuire2002). AA is converted to PGH2, the precursor of the other prostaglandins, through the actions of the enzyme PGH synthase (PGHS; Mattos et al., Reference Mattos, Guzeloglu, Badinga, Staples and Thatcher2003). Despite FO supplementation increasing systemic AA, there is evidence from this laboratory (Childs et al., Reference Childs, Sreenan, Hennessy, Stanton, Diskin and Kenny2007) and others (Burns et al., Reference Burns, Engle, Harris, Enns and Whittier2003) that a high n-3 PUFA diet can reduce uterine endometrial tissue concentrations of AA.
In vitro work by Mattos et al. (Reference Mattos, Guzeloglu, Badinga, Staples and Thatcher2003) demonstrated that the addition of AA increased, while n-3 PUFA decreased the PGF2α secretion of immortalised bovine endometrial cells. The ability to reduce the endometrial synthesis and secretion of the luteolysin, PGF2α, during early pregnancy would be beneficial in the context of the successful establishment of pregnancy (Mattos et al., Reference Mattos, Staples and Thatcher2000). Conversely, promotion of PGF2α secretion during the early post partum period is conducive to more rapid uterine involution (Garcia-Bojalil et al., Reference Garcia-Bojalil, Staples, Risco, Savio and Thatcher1998). We hypothesised that FO (n-3 PUFA) supplementation would reduce and WSB (n-6 PUFA) would increase PGFM concentrations in response to an oxytocin challenge administered on days 15 and 16 of the oestrous cycle. We found a diet × day of oestrous cycle interaction on PGFM, with concentrations in the animals on the FO diet similar to CON on day 15 but increasing similar to WSB, on day 16. On day 15, PGFM concentrations were higher on WSB than CON or FO; however, FO failed to attenuate PGFM relative to the control diet. Furthermore, there was no direct relationship between plasma P4, E2 and PGFM, but a higher E2 : P4 ratio was related to an increased concentration of PGFM on both sampling days. An increase in PGFM has been reported previously for dietary (Fahey et al., Reference Fahey, Mee, Murphy and O’Callaghan2002; Petit et al., Reference Petit, Germiquet and Lebel2004) and intravenously infused (Filley et al., Reference Filley, Turner and Stormshak1999) sources of linoleic acid. However, results from trials involving fish meal and fish oil supplementation have been inconsistent in their effects on PGFM, with some reporting reductions (Mattos et al., Reference Mattos, Staples, Williams, Amorocho and McGuire2002 and Reference Mattos, Staples, Arteche, Wiltbank, Diaz, Jenkins and Thatcher2004), and others, reporting no effect (Wamsley et al., Reference Wamsley, Burns, Engle and Enns2005; Heravi Moussavi et al., Reference Moussavi, Gilbert, Overton, Bauman and Butler2007). In the study of Heravi Moussavi et al. (Reference Moussavi, Gilbert, Overton, Bauman and Butler2007), it is suggested that the use of oestradiol priming prior to administration of an oxytocin challenge may be responsible for the inconsistency in the results reported, as studies reporting attenuation of PGFM concentrations following either fish meal or fish oil supplementation have used oestradiol prior to oxytocin (Mattos et al., Reference Mattos, Staples, Williams, Amorocho and McGuire2002 and Reference Mattos, Staples, Arteche, Wiltbank, Diaz, Jenkins and Thatcher2004) while studies yielding no response involved administration of oxytocin but without oestradiol (Wamsley et al., Reference Wamsley, Burns, Engle and Enns2005; Heravi Moussavi et al., Reference Moussavi, Gilbert, Overton, Bauman and Butler2007). The results of these latter studies and those of the current study, therefore, may represent a more physiologically normal response. While, as previously stated, there was no effect of diet on P4 or E2 in the current study, the inclusion of the E2 : P4 ratio in the statistical model was highly statistically significant in terms of explaining variation in PGFM concentrations. This may be related to the natural decline in P4 and rise in E2 prior to luteolysis. As E2 upregulates the uterine oxytocin receptor and consequently PGF2α synthesis (Goff, Reference Goff2004), heifers with greater E2 : P4 ratios would be more likely to produce more PGF2α in response to oxytocin.
In conclusion, this study showed little difference in the effect of dietary n-3 or n-6 PUFA supplementation on a range of reproductive variables. We found, however, that n-6 PUFA supplementation increased concentrations of circulating PGFM, the metabolite of PGF2α. As PGF2α plays an important role in early post partum uterine function, this information may be of benefit to the formulation of post-calving diets for dairy cows.
Acknowledgements
The authors gratefully acknowledge Dr Zhangrui Cheng of the Royal Veterinary College for his technical assistance with the PGFM assays, and also that of Messrs P. Joyce, W. Connolly, J. Nally, Mrs A. Glynn, Mr J. Larkin and Miss P. Furney. We also thank the farm staff at the Newford Research Farm, Athenry, for their care of the animals.