Introduction
Schizophrenia is a major mental disorder that affects about 1% of the population; it is the eighth leading cause of disability worldwide (Mathers et al. Reference Mathers, Lopez, Murray, Lopez, Mathers, Ezzati, Jamison and Murray2006). Onset is typically in the second to third decade of life. A critical recent focus, therefore, has been the early detection of individuals at clinical high risk (CHR) for schizophrenia, in order to permit early intervention and, hopefully, prevention. Over the past two decades, criteria have been developed that allow for the recruitment of CHR populations (Miller et al. Reference Miller, Zipursky, Perkins, Addington, Woods, Hawkins, Hoffman, Preda, Epstein, Addington, Lindborg, Marquez, Tohen, Breier and McGlashan2003). Nevertheless, only about 20–30% of individuals meeting present criteria will transition to psychosis within a near-term (<3-year) window, suggesting a need for improved prediction algorithms (Cannon et al. Reference Cannon, Cadenhead, Cornblatt, Woods, Addington, Walker, Seidman, Perkins, Tsuang, McGlashan and Heinssen2008; Ruhrmann et al. Reference Ruhrmann, Schultze-Lutter, Salokangas, Heinimaa, Linszen, Dingemans, Birchwood, Patterson, Juckel, Heinz, Morrison, Lewis, von Reventlow and Klosterkotter2010; Fusar-Poli et al. Reference Fusar-Poli, Bonoldi, Yung, Borgwardt, Kempton, Valmaggia, Barale, Caverzasi and McGuire2012a ; Nelson et al. Reference Nelson, Yuen, Wood, Lin, Spiliotacopoulos, Bruxner, Broussard, Simmons, Foley, Brewer, Francey, Amminger, Thompson, McGorry and Yung2013).
To date, the strongest and most reliable predictors of transition to psychosis among at-risk individuals are symptom severity (Cannon et al. Reference Cannon, Cadenhead, Cornblatt, Woods, Addington, Walker, Seidman, Perkins, Tsuang, McGlashan and Heinssen2008; Lemos-Giraldez et al. Reference Lemos-Giraldez, Vallina-Fernandez, Fernandez-Iglesias, Vallejo-Seco, Fonseca-Pedrero, Paino-Pineiro, Sierra-Baigrie, Garcia-Pelayo, Pedrejon-Molino, Alonso-Bada, Gutierrez-Perez and Ortega-Ferrandez2009; Ruhrmann et al. Reference Ruhrmann, Schultze-Lutter, Salokangas, Heinimaa, Linszen, Dingemans, Birchwood, Patterson, Juckel, Heinz, Morrison, Lewis, von Reventlow and Klosterkotter2010; Demjaha et al. Reference Demjaha, Valmaggia, Stahl, Byrne and McGuire2012; Nelson et al. Reference Nelson, Yuen, Wood, Lin, Spiliotacopoulos, Bruxner, Broussard, Simmons, Foley, Brewer, Francey, Amminger, Thompson, McGorry and Yung2013), particularly of negative symptoms (Velthorst et al. Reference Velthorst, Nieman, Becker, van de Fliert, Dingemans, Klaassen, de Haan, van Amelsvoort and Linszen2009; Demjaha et al. Reference Demjaha, Valmaggia, Stahl, Byrne and McGuire2012; Piskulic et al. Reference Piskulic, Addington, Cadenhead, Cannon, Cornblatt, Heinssen, Perkins, Seidman, Tsuang, Walker, Woods and McGlashan2012; Nelson et al. Reference Nelson, Yuen, Wood, Lin, Spiliotacopoulos, Bruxner, Broussard, Simmons, Foley, Brewer, Francey, Amminger, Thompson, McGorry and Yung2013; Valmaggia et al. Reference Valmaggia, Stahl, Yung, Nelson, Fusar-Poli, McGorry and McGuire2013) and subthreshold thought disorder (Klosterkotter et al. Reference Klosterkotter, Hellmich, Steinmeyer and Schultze-Lutter2001; Haroun et al. Reference Haroun, Dunn, Haroun and Cadenhead2006; Bearden et al. Reference Bearden, Wu, Caplan and Cannon2011; Demjaha et al. Reference Demjaha, Valmaggia, Stahl, Byrne and McGuire2012; Kantrowitz et al. Reference Kantrowitz, Hoptman, Leitman, Silipo and Javitt2014; Nelson et al. Reference Nelson, Yuen, Wood, Lin, Spiliotacopoulos, Bruxner, Broussard, Simmons, Foley, Brewer, Francey, Amminger, Thompson, McGorry and Yung2013; DeVylder et al. Reference DeVylder, Muchomba, Gill, Ben-David, Walder, Malaspina and Corcoran2014). While neuropsychological deficits exist in schizophrenia and in at-risk individuals, to date they have not been found to be of value in predicting transition over and above the contribution of symptoms (Seidman et al. Reference Seidman, Giuliano, Meyer, Addington, Cadenhead, Cannon, McGlashan, Perkins, Tsuang, Walker, Woods, Bearden, Christensen, Hawkins, Heaton, Keefe, Heinssen and Cornblatt2010; Fusar-Poli et al. Reference Fusar-Poli, Deste, Smieskova, Barlati, Yung, Howes, Stieglitz, Vita, McGuire and Borgwardt2012b ; Lin et al. Reference Lin, Yung, Nelson, Brewer, Riley, Simmons, Pantelis and Wood2013). Over recent years, there has been increasing focus on social cognition as a distinct dimension of neurocognitive impairment in schizophrenia that may be closely related to underlying deficits in sensory function (Butler et al. Reference Butler, Abeles, Weiskopf, Tambini, Jalbrzikowski, Legatt, Zemon, Loughead, Gur and Javitt2009; Gold et al. Reference Gold, Butler, Revheim, Leitman, Hansen, Gur, Kantrowitz, Laukka, Juslin, Silipo and Javitt2012; Green et al. Reference Green, Hellemann, Horan, Lee and Wynn2012; Kantrowitz et al. Reference Kantrowitz, Leitman, Lehrfeld, Laukka, Juslin, Butler, Silipo and Javitt2013, Reference Kantrowitz, Hoptman, Leitman, Silipo and Javitt2014). As with other aspects of neurocognition, schizophrenia patients show profound deficits in social cognitive abilities that correlate highly with impaired functional outcome (Green et al. Reference Green, Hellemann, Horan, Lee and Wynn2012). Moreover, these processes may mature earlier in the course of normal development than more traditional neuropsychological domains, suggesting that they may be especially effective as risk biomarkers (Vicari et al. Reference Vicari, Reilly, Pasqualetti, Vizzotto and Caltagirone2000; Gao & Maurer, Reference Gao and Maurer2010; Rosenqvist et al. Reference Rosenqvist, Lahti-Nuuttila, Laasonen and Korkman2013; Roalf et al. Reference Roalf, Gur, Ruparel, Calkins, Satterthwaite, Bilker, Hakonarson, Harris and Gur2014). The present study thus evaluates emotion recognition deficits in CHR individuals as a potential predictor for psychosis outcome over and above general neurocognitive deficit and known predictors such as negative symptoms and subthreshold thought disorder.
The construct of social cognition is operationalized, at least in part, as the ability to recognize emotion based upon facial expression and tone of voice, and is critical for adaptive behavior (Adolphs, Reference Adolphs2009; de Waal, Reference de Waal2011; Lemasson et al. Reference Lemasson, Remeuf, Rossard and Zimmermann2012). Individuals with schizophrenia show profound and disabling deficits (d = 0.9–1.1) on tests of both face (Kohler et al. Reference Kohler, Walker, Martin, Healey and Moberg2010) and auditory (Haskins et al. Reference Haskins, Shutty and Kellogg1995; Leitman et al. Reference Leitman, Foxe, Butler, Saperstein, Revheim and Javitt2005; Leitman et al. Reference Leitman, Hoptman, Foxe, Saccente, Wylie, Nierenberg, Jalbrzikowski, Lim and Javitt2007; Gold et al. Reference Gold, Butler, Revheim, Leitman, Hansen, Gur, Kantrowitz, Laukka, Juslin, Silipo and Javitt2012; Kantrowitz et al. Reference Kantrowitz, Hoptman, Leitman, Silipo and Javitt2014) emotion recognition. These deficits, moreover, exist early in the course of illness (Edwards et al. Reference Edwards, Pattison, Jackson and Wales2001; Kucharska-Pietura et al. Reference Kucharska-Pietura, David, Masiak and Phillips2005; Addington et al. Reference Addington, Saeedi and Addington2006, Reference Addington, Penn, Woods, Addington and Perkins2008, Reference Addington, Piskulic, Perkins, Woods, Liu and Penn2012; van Rijn et al. Reference van Rijn, Aleman, de Sonneville, Sprong, Ziermans, Schothorst, van Engeland and Swaab2011; Amminger et al. Reference Amminger, Schafer, Papageorgiou, Klier, Schlogelhofer, Mossaheb, Werneck-Rohrer, Nelson and McGorry2012; Thompson et al. Reference Thompson, Papas, Bartholomeusz, Allott, Amminger, Nelson, Wood and Yung2012; Wolwer et al. Reference Wolwer and Frommann2012; Comparelli et al. Reference Comparelli, Corigliano, De Carolis, Mancinelli, Trovini, Ottavi, Dehning, Tatarelli, Brugnoli and Girardi2013; Kohler et al. Reference Kohler, Richard, Brensinger, Borgmann-Winter, Conroy, Moberg, Gur, Gur and Calkins2014), suggesting that disturbances may predate psychosis onset. In schizophrenia, face emotion recognition has been assessed with a range of instruments (Edwards et al. Reference Edwards, Jackson and Pattison2002). However, over recent years, the Penn Emotion Recognition Test – 40 faces (ER40) has become increasingly adopted as a standard (Taylor & MacDonald, Reference Taylor and MacDonald2012), with consistent deficits of large effect (d = 0.8) across cohorts (Gur et al. Reference Gur, Sara, Hagendoorn, Marom, Hughett, Macy, Turner, Bajcsy, Posner and Gur2002; Kohler et al. Reference Kohler, Walker, Martin, Healey and Moberg2010; Gold et al. Reference Gold, Butler, Revheim, Leitman, Hansen, Gur, Kantrowitz, Laukka, Juslin, Silipo and Javitt2012; Taylor & MacDonald, Reference Taylor and MacDonald2012). Batteries for assessment of auditory emotion recognition (AER) deficits are less well established, but consistent deficits have been recently demonstrated using a battery initially developed by Juslin and Laukka (Juslin & Laukka, Reference Juslin and Laukka2001; Leitman et al. Reference Leitman, Foxe, Butler, Saperstein, Revheim and Javitt2005; Leitman et al. Reference Leitman, Hoptman, Foxe, Saccente, Wylie, Nierenberg, Jalbrzikowski, Lim and Javitt2007; Gold et al. Reference Gold, Butler, Revheim, Leitman, Hansen, Gur, Kantrowitz, Laukka, Juslin, Silipo and Javitt2012; Kantrowitz et al. Reference Kantrowitz, Hoptman, Leitman, Silipo and Javitt2014). To date, the ER40 has been evaluated in CHR individuals only in one cross-sectional study, finding a highly significant deficit comparable with that observed in schizophrenia (Kohler et al. Reference Kohler, Richard, Brensinger, Borgmann-Winter, Conroy, Moberg, Gur, Gur and Calkins2014).
This is the first study of which we are aware to apply the present emotion recognition batteries to a prospective CHR cohort. Two prior studies in CHR subjects used different emotion recognition tests, finding mixed results (Addington et al. Reference Addington, Piskulic, Perkins, Woods, Liu and Penn2012; Allott et al. Reference Allott, Schafer, Thompson, Nelson, Bendall, Bartholomeusz, Yuen, McGorry, Schlogelhofer, Bechdolf and Amminger2014). We hypothesized that deficits in emotion recognition would predict psychosis onset in CHR subjects. In addition to evaluating these measures in a CHR cohort relative to our prior studies in schizophrenia, we also estimated in cross-section their age-related trajectory of normal development in a community-based sample (Nooner et al. Reference Nooner, Colcombe, Tobe, Mennes, Benedict, Moreno, Panek, Brown, Zavitz, Li, Sikka, Gutman, Bangaru, Schlachter, Kamiel, Anwar, Hinz, Kaplan, Rachlin, Adelsberg, Cheung, Khanuja, Yan, Craddock, Calhoun, Courtney, King, Wood, Cox, Kelly, Di Martino, Petkova, Reiss, Duan, Thomsen, Biswal, Coffey, Hoptman, Javitt, Pomara, Sidtis, Koplewicz, Castellanos, Leventhal and Milham2012) to gain insight into the potential time course over which deficits might develop.
Method
Participants
Participants were 49 CHR subjects and 31 healthy controls (HCs) ascertained in metropolitan New York using fliers, mailings of brochures, and Internet advertising. CHR subjects were English speaking, help seeking, and aged 12–30 years, referred from schools and clinicians, or self-referred through the program website. They were ascertained as at CHR for schizophrenia using the traditional criteria of the Structured Interview for Prodromal Syndromes/Scale of Prodromal Symptoms (SIPS/SOPS) (Miller et al. Reference Miller, Zipursky, Perkins, Addington, Woods, Hawkins, Hoffman, Preda, Epstein, Addington, Lindborg, Marquez, Tohen, Breier and McGlashan2003). Exclusion criteria included history of threshold psychosis, risk of harm to self or others incommensurate with out-patient care, major medical or neurological disorder, and intelligence quotient (IQ) < 70. Attenuated positive symptoms could not occur solely in the context of substance use or withdrawal, or be better accounted for by another disorder. CHR subjects were followed for up to 2 years and ascertained quarterly in person to determine transition to psychosis. Individuals who did not complete quarterly assessments were contacted by telephone to determine outcome. Additional exclusion criteria for HCs included family history of psychosis, adoption, cluster A personality disorder, and Axis I disorder in the prior 2 years.
An existing cohort of schizophrenia patients (n = 93) (Gold et al. Reference Gold, Butler, Revheim, Leitman, Hansen, Gur, Kantrowitz, Laukka, Juslin, Silipo and Javitt2012; Kantrowitz et al. Reference Kantrowitz, Hoptman, Leitman, Silipo and Javitt2014) was used for comparison of level of deficit with CHR subjects. Of note, they were not matched for age or gender with the CHR cohort. They were ascertained from in-patient and out-patient facilities at the Nathan Kline Institute (NKI) for Psychiatric Research, with diagnoses established using the Structured Clinical Interview for DSM-IV (SCID) (First et al. Reference First, Opler, Hamilton, Linder, Linfield, Silver, Toshav, Kahn, Williams and Spitzer1993).
A parallel study investigated normative development of face and auditory emotion recognition ability in individuals aged 7–26 years (n = 43) drawn from the Nathan Kline Institute Rockland sample (NKI-RS) (Nooner et al. Reference Nooner, Colcombe, Tobe, Mennes, Benedict, Moreno, Panek, Brown, Zavitz, Li, Sikka, Gutman, Bangaru, Schlachter, Kamiel, Anwar, Hinz, Kaplan, Rachlin, Adelsberg, Cheung, Khanuja, Yan, Craddock, Calhoun, Courtney, King, Wood, Cox, Kelly, Di Martino, Petkova, Reiss, Duan, Thomsen, Biswal, Coffey, Hoptman, Javitt, Pomara, Sidtis, Koplewicz, Castellanos, Leventhal and Milham2012), a community-ascertained lifespan sample based on zip code recruitment. The sample was 51% male, 51% Caucasian, and had a mean age of 18.2 (s.d.=5.3) years. Mean IQ was 96 (s.d.=15). In this young middle-class sample, Axis I diagnoses [<1%; attention-deficit/hyperactivity disorder (ADHD)] and medication use (i.e. 5%; contraception) were rare and 10% had a family history of psychiatric disorder (5% major depression; 2.5% ADHD; 2.5% schizophrenia).
All adults provided informed consent; subjects under the age of 18 years provided assent, with informed consent provided by a parent. This study was approved by the Institutional Review Boards at the New York State Psychiatric Institute at Columbia University and the NKI for Psychiatric Research. Additionally, means and standard deviations for face emotion recognition (Gur et al. Reference Gur, Sara, Hagendoorn, Marom, Hughett, Macy, Turner, Bajcsy, Posner and Gur2002) across age groups from 8 to 21 years in the extended Philadelphia Neurodevelopment Cohort (Gur et al. Reference Gur, Calkins, Satterthwaite, Ruparel, Bilker, Moore, Savitt, Hakonarson and Gur2014) (n = 9492) were generously provided in de-identified form by R.C.G. for comparison.
Baseline measures
Prodromal symptoms
Prodromal symptoms were assessed in CHR subjects and HCs using the SIPS/SOPS (Miller et al. Reference Miller, Zipursky, Perkins, Addington, Woods, Hawkins, Hoffman, Preda, Epstein, Addington, Lindborg, Marquez, Tohen, Breier and McGlashan2003), which assesses positive (subthreshold delusions, paranoia, grandiosity, hallucinations and thought disorder), negative (social anhedonia, avolition, experience and expression of emotions, ideational richness and occupational functioning), disorganized and general symptoms. Specifically, subthreshold thought disorder (i.e. conceptual disorganization) was assessed using SIPS P5 and negative symptoms were assessed as the sum of scores for the six negative symptom items. The SIPS/SOPS was administered by trained masters-level clinicians, and ratings were achieved by consensus with the first author (C.M.C.), who was certified multiple times in its administration by investigators at Yale University, and who has maintained good inter-rater reliability with other CHR programs (intraclass correlation coefficients > 0.70 for individual scale items and 1.00 for syndrome ratings). The SIPS/SOPS was also used to determine psychosis outcome prospectively.
Face emotion recognition
Face emotion recognition was assessed using the ER40 (Gur et al. Reference Gur, Sara, Hagendoorn, Marom, Hughett, Macy, Turner, Bajcsy, Posner and Gur2002), a valid and reliable measure of face emotion recognition (Taylor & MacDonald, Reference Taylor and MacDonald2012). It uses 40 color photographs of faces expressing four basic emotions – happiness, sadness, anger or fear – plus neutral – with eight photographs for each category, presented in random order. Emotional intensity of facial expressions in the ER40 is categorized as mild or more extreme, each attributed to 20 images. Participants were instructed to choose the correct emotion from among the five listed choices (forced choice) by clicking a computer mouse as quickly as possible without sacrificing accuracy. Each image was displayed until a choice was made. For each photograph, both the expression and the choice were recorded, such that accuracy (percentage correct) and error patterns (misattribution of emotion, i.e. rates of ‘false positives’) were calculated. Data on the ER40 were available for the CHR cohort, the schizophrenia cohort, the NKI-RS and the Philadelphia Neurodevelopment Cohort (Gur et al. Reference Gur, Richard, Calkins, Chiavacci, Hansen, Bilker, Loughead, Connolly, Qiu, Mentch, Abou-Sleiman, Hakonarson and Gur2012, Reference Gur, Calkins, Satterthwaite, Ruparel, Bilker, Moore, Savitt, Hakonarson and Gur2014).
Intelligence
Intelligence was assessed in CHR subjects and HCs using the Wechsler Adult Intelligence Scale, third edn. (WAIS-III; Wechsler, Reference Wechsler1997) to determine if face emotion recognition deficits could be accounted for by lower full-scale IQ (FSIQ), or its index of processing speed.
Face emotion discrimination
Face emotion discrimination was evaluated using the Penn Emotion Discrimination Task (EMODIFF) (Silver et al. Reference Silver, Shlomo, Turner and Gur2002; Gur et al. Reference Gur, Kohler, Ragland, Siegel, Lesko, Bilker and Gur2006), which assesses the ability to differentiate the intensity of happiness or sadness in two adjacent images of the same person showing the same emotion. Participants chose one of two faces as more expressive, or decided they were equal. The EMODIFF has 20 trials each for happy and sad faces. Data on the EMODIFF were available for the CHR and schizophrenia cohorts.
Auditory emotion recognition
AER was assessed using 32 audio recordings of native English speakers conveying the same four emotions as the ER40 – anger, fear, happiness, sadness – plus a neutral or ‘no emotion’ stimulus (Juslin & Laukka, Reference Juslin and Laukka2001; Gold et al. Reference Gold, Butler, Revheim, Leitman, Hansen, Gur, Kantrowitz, Laukka, Juslin, Silipo and Javitt2012). Data on this task were available for the CHR, schizophrenia and NKI-RS cohorts.
Cognition
Cognition, specifically speed of processing and attention/vigilance, was assessed in the NKI-RS using the Measurement and Treatment Research to Improve Cognition in Schizophrenia (MATRICS) Consensus Cognitive Battery (MCCB; Nuechterlein & Green, Reference Nuechterlein and Green2006). The same measure of attention/vigilance (i.e. Continuous Performance Test-Identical Pairs; CPT-IP) was used with the CHR cohort, in whom processing speed was assessed using a computerized Stroop task, for which higher Z scores (adjusted for age and gender) reflect worse performance (Keilp et al. Reference Keilp, Gorlyn, Russell, Oquendo, Burke, Harkavy-Friedman and Mann2013).
Data analysis
Prospective CHR cohort
CHR subjects were stratified for analyses on the basis of eventual transition to psychosis (CHR+ and CHR−), and compared with HCs on demographics, cognition, symptoms, and measures of face and auditory emotion processing, using first parametric [analysis of variance (ANOVA), post hoc Bonferroni pairwise tests] and then non-parametric Kruskal–Wallis analyses, with Mann–Whitney pairwise tests as post hoc group comparisons (further subjected to Bonferroni correction). The ability of face emotion processing to discriminate among groups over and beyond that of attention/vigilance and processing speed was assessed using repeated-measures general linear models, with group as between-subjects and task as within-subjects factors, identifying any significant group × task interactions. Accuracy and misattribution by emotion type, and intensity of facial expression (mild v. extreme), were also explored using repeated-measures general linear models (which are robust to violations of assumptions of normality), with Bonferroni-corrected post hoc group comparisons. In these analyses, group was the between-subjects factor (CHR+, CHR−, HC) and task conditions (i.e. emotion type, intensity) were the within-subjects factors. Effect sizes were interpreted as per Cohen (Reference Cohen1992). We set α at 0.05 for all analyses.
Baseline measures that significantly discriminated between CHR+ and CHR− were entered into stepwise logistic regression analyses and assessed for correlation with one another. Receiver-operating characteristic (ROC) curves, with area under the curve (AUC), were established for each identified predictor, with its Youden index calculated as the ‘maximal value for sensitivity + specificity −1’ at the optimal cut-point (Ruopp et al. Reference Ruopp, Perkins, Whitcomb and Schisterman2008). The sensitivity, specificity, positive predictive value, negative predictive value and accuracy are reported for each predictor at the optimal cut-point. For comparison with intelligence, mental ages were calculated as the product of IQ/100 and chronological age; deviance from expected intelligence was calculated as the difference between chronological and mental age.
Developmental cohorts
In order to identify the age-equivalence of identified deficits in CHR subjects, we examined in cross-section normal growth curves from childhood to young adulthood in the community-based NKI-RS (Nooner et al. Reference Nooner, Colcombe, Tobe, Mennes, Benedict, Moreno, Panek, Brown, Zavitz, Li, Sikka, Gutman, Bangaru, Schlachter, Kamiel, Anwar, Hinz, Kaplan, Rachlin, Adelsberg, Cheung, Khanuja, Yan, Craddock, Calhoun, Courtney, King, Wood, Cox, Kelly, Di Martino, Petkova, Reiss, Duan, Thomsen, Biswal, Coffey, Hoptman, Javitt, Pomara, Sidtis, Koplewicz, Castellanos, Leventhal and Milham2012), and for face emotion recognition only, from the Philadelphia Neurodevelopment Cohort (Gur et al. Reference Gur, Calkins, Satterthwaite, Ruparel, Bilker, Moore, Savitt, Hakonarson and Gur2014). The NKI-RS was characterized for cross-sectional normal growth curves of face and auditory emotion recognition, and also for the MCCB (Nuechterlein & Green, Reference Nuechterlein and Green2006) speed of processing and attention/vigilance. We examined the cross-sectional developmental growth curve for each domain, using maximal R 2 to fit each model. To compare cross-sectional growth curves, repeated-measures ANOVA was completed with test (ER40, AER, processing speed, attention) as the within-subject factor and age as covariate; simple contrasts were used to compare across tests relative to emotion recognition measures. Accuracy of face emotion recognition in patients and HCs, as assessed with the ER40, was plotted against the neurodevelopmental growth curves obtained from the large (n = 9492) Philadelphia Neurodevelopment Cohort (Gur et al. Reference Gur, Richard, Calkins, Chiavacci, Hansen, Bilker, Loughead, Connolly, Qiu, Mentch, Abou-Sleiman, Hakonarson and Gur2012, Reference Gur, Calkins, Satterthwaite, Ruparel, Bilker, Moore, Savitt, Hakonarson and Gur2014), participants aged 8–21 years who were selected at random from the greater Philadelphia area and contacted by mail and then telephone.
Ethical standards
All procedures contributing to this work comply with the ethical standards of the relevant national and institutional committees on human experimentation and with the Helsinki Declaration of 1975, as revised in 2008.
Results
Between-group analyses
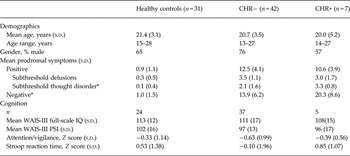
There were 31 HC and 49 CHR subjects, of whom seven (14.2%) later developed schizophrenia (CHR+) within 2.5 years and 42 did not (CHR−). All CHR subjects met the attenuated positive symptoms syndrome. Outcomes were established primarily by in-person interview, and by telephone if individuals were unable to come to the research program. HC, CHR+ and CHR− groups did not differ by age, gender, ethnicity or IQ (Table 1).
Demographics, symptoms and cognition in CHR patients and healthy controls

CHR, Clinical high-risk; CHR–, CHR participants who did not transition to psychosis; CHR+, CHR participants who transitioned to psychosis; s.d., standard deviation; WAIS-III, Wechsler Adult Intelligence Scale, third edn.; IQ, intelligence quotient; PSI, processing speed index.
* p < 0.05 for CHR+ v. CHR−.
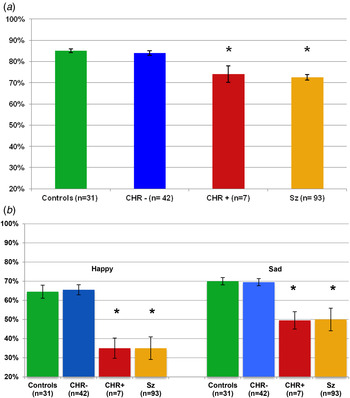
As predicted, baseline accuracy in face emotion processing (i.e. percentage correct) varied significantly across groups for both face emotion recognition (F 2,74 = 7.72, p = 0.001, Fig. 1a ) and discrimination (F 2,74 = 9.33, p < 0.001, Fig. 1b ). Bonferroni-corrected post hoc tests showed significant differences between CHR+ subjects and both HC and CHR− subjects for both the ER40 and EMODIFF (all p's ≤ 0.001). By contrast, HC and CHR− subjects were not significantly different (both post hoc p's = 1.0). No significant differences were observed between CHR+ and CHR− subjects on tests of either attention/vigilance, as measured by the CPT-IP (post hoc p = 1.0) or processing speed as measured by the Stroop task (post hoc p = 0.75) (Table 1). Furthermore, ER40 deficits in CHR− v. CHR+ subjects were differential relative to both attention/vigilance (group × task: F 1,40 = 10.2, p = 0.003) and processing speed (group × task: F 1,40 = 10.1, p = 0.003), suggesting relative specificity of effect; similar results were found for EMODIFF deficits (both p's < 0.001).
Face processing in healthy controls, CHR participants who transitioned to psychosis (CHR+), CHR participants who did not transition to psychosis (CHR−) and schizophrenia patients (Sz) (Gold et al. Reference Gold, Butler, Revheim, Leitman, Hansen, Gur, Kantrowitz, Laukka, Juslin, Silipo and Javitt2012): face emotion recognition and face emotion discrimination. Percentage accuracy at baseline for (a) the Penn Emotion Recognition Test and (b) the Penn Emotion Discrimination Test. Values are means, with standard deviations represented by vertical bars. * Mean value was significantly different from those for the controls and the CHR– group (p < 0.05).

Similar statistical results were obtained as well using non-parametric statistics to control for potential outliers. In these analyses as well, highly significant results were obtained for baseline face emotion recognition (χ2 2 = 9.5, p = 0.009, Fig. 1a ) and discrimination (χ2 2 = 13.5, p = 0.001, Fig. 1b ). Specifically, while the full cohort of 49 CHR subjects had no deficits in face emotion recognition (Mann–Whitney U = 596, p = 0.10) or discrimination (Mann–Whitney U = 673, p = 0.39) as compared with HCs, the CHR+ subjects differed significantly from both HC (ER40, Mann–Whitney U = 30, p = 0.002; EMODIFF, Mann–Whitney U = 16, p < 0.001) and CHR− individuals (ER40, Mann–Whitney U = 55, p = 0.006; EMODIFF Mann–Whitney U = 25, p < 0.001), who were themselves statistically indistinguishable in face emotion processing (both p's > 0.34) (Fig. 1). Between-group differences for CHR+ with both HC and CHR− subjects were of large statistical effect (d = 0.9), and comparable with that seen in schizophrenia (Fig. 1).
Group × emotion analyses
A secondary analysis evaluated the pattern of deficit across emotions in the ER40 and EMODIFF tasks. For ER40, repeated-measures analyses showed a significant group × emotion interaction for both accuracy (p = 0.04) and mislabeling (p = 0.003). The interaction was driven by significant reductions in baseline accuracy for detection of anger and fear in CHR+ patients relative to both HC and CHR− subjects (both p's < 0.05) (online Supplementary Fig. S1). The mislabeling of emotionally expressive faces as ‘neutral’ was greater for CHR+ than for CHR− or HC subjects (both post hoc p's < 0.001). Correspondingly, review of ER40 error patterns in CHR+ subjects showed that ‘false-positive’ labeling of neutral was applied primarily to expressions of fear and anger.
Further, for ER40, CHR+ individuals had decreased accuracy for identification of face emotions of more mild intensity (χ2 2 = 10.2, p = 0.006), as compared with CHR− (post hoc p = 0.009) and HC subjects (post hoc p = 0.001). By contrast, no difference in accuracy was found for stimuli showing greater intensity of emotion (χ2 2 = 2.6, p = 0.27). Consistent with this, there was a trend for a group × emotion intensity interaction (F 2,77 = 2.9, p = 0.06).
For the EMODIFF, the baseline degree of deficit for CHR+ patients was similar for happy (χ2 2 = 12.4, p = 0.002) and sad (χ2 2 = 12.9, p = 0.002, Fig. 1b ), with no group × emotion interaction. As in primary analyses, CHR+ subjects differed from both CHR− and HC individuals (all post hoc p's < 0.001).
Thought disorder and clinical variables
In addition, consistent with prior research, subthreshold thought disorder (χ2 2 = 35.9, p < 0.001) and total negative symptom severity (χ2 2 = 50.7, p < 0.001) also varied across groups (Table 1), with CHR+ individuals showing increased severity relative to both CHR− individuals (thought disorder: post hoc p = 0.04; negative symptoms: post hoc p = 0.01) and HC subjects (all post hoc p's < 0.001). Subthreshold thought disorder was significantly associated with both face emotion recognition accuracy (r = −0.46, p = 0.001) and negative symptoms (r = 0.35, p = 0.02).
Prediction of schizophrenia outcome
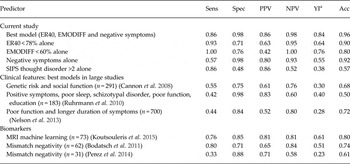
Baseline performance on the ER40 alone was able to predict psychosis outcome with 90% accuracy (Table 2), with an AUC of 0.815 for the ROC curve (see online Supplementary Fig. S2). When identified predictors of psychosis were evaluated together in forward stepwise logistic regression, the derived optimal model (−2 log likelihood = 4.7, χ2 1 = 35.5, p < 0.001) also included negative symptoms and face emotion discrimination, in addition to face emotion recognition, with 96% accuracy and an AUC of 0.99 (Table 2).
Predictors of psychosis onset in CHR cohorts

CHR, Clinical high-risk; Sens, sensitivity; Spec, specificity; PPV, positive predictive value; NPV, negative predictive value; YI, Youden index; Acc, accuracy; ER40, Penn Emotion Recognition Test – 40 faces; EMODIFF, Penn Emotion Discrimination Task; SIPS, Structured Interview for Prodromal Syndromes; MRI, magnetic resonance imaging.
a ‘Maximal value for sensitivity + specificity −1’ at the optimal cut-point (Ruopp et al. Reference Ruopp, Perkins, Whitcomb and Schisterman2008).
Of note, IQ did not account for the predictive value of deficit in face emotion recognition in CHR+ subjects, as it was neither related to face emotion recognition (r = 0.02) nor to schizophrenia outcome (Table 1). Neither ‘mental age’ nor its difference from chronological age was associated with face emotion recognition (all r's < 0.2; p's = n.s.). In the CHR cohort, only two subjects (CHR−) had a mental age below adulthood: they had adult levels of accuracy on the ER40 (age 13 years, FSIQ 91, mental age 11.8 years, 82.5% accuracy; and age 17 years, FSIQ 83, mental age 14.1 years, 87.5% accuracy). Likewise, two HCs had a mental age below adulthood: they also nonetheless had adult levels of accuracy on the ER40 (age 14 years, FSIQ 93, mental age 13.0 years, 90% accuracy, and age 17 years, FSIQ 91, mental age 15.4 years, 85% accuracy).
Auditory emotion recognition
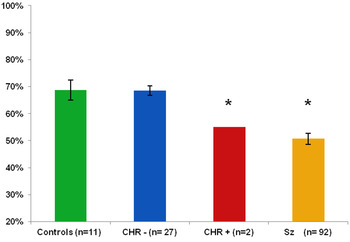
Data on baseline AER and tone matching were available for a subgroup of the cohort, i.e. eight HC and 29 CHR subjects, of whom only two developed schizophrenia (Fig. 2). Results from these subjects were therefore compared with published values. Specifically, in a prior study we observed a normative range of mean 65.9 (s.d. = 9.8) in a sample of 188 healthy subjects with mean age of 21.3 years (Gold et al. Reference Gold, Butler, Revheim, Leitman, Hansen, Gur, Kantrowitz, Laukka, Juslin, Silipo and Javitt2012). Six of the eight current HC and 24 of the 27 CHR− subjects fell within or above this range; by contrast, both CHR+ subjects were significantly impaired and at levels comparable with those previously observed in schizophrenia. Of course, this apparent deficit in AER must be replicated in a larger sample.
Auditory emotion recognition in healthy controls, CHR participants who transitioned to psychosis (CHR+), CHR participants who did not transition to psychosis (CHR−) and schizophrenia patients (Sz) (Gold et al. Reference Gold, Butler, Revheim, Leitman, Hansen, Gur, Kantrowitz, Laukka, Juslin, Silipo and Javitt2012): percentage accuracy at baseline on the Auditory Emotion Recognition Test. Values are means, with standard deviations represented by vertical bars. * Mean value was significantly different from those for the controls and the CHR– group (p < 0.05).

Normal development
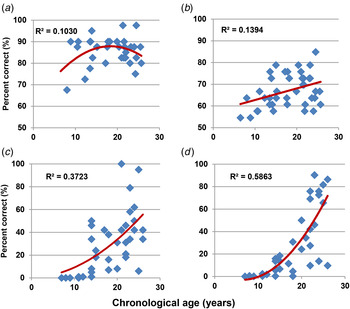
In the NKI-RS, adult performance in face emotion recognition was achieved by the age of 14 years, reaching a plateau thereafter. By contrast AER showed a monotonic increase starting before the age of 14 years but then extending into adulthood (r = 0.37, p = 0.02; Fig. 3), suggesting a differential age-related trajectory across the two forms of emotion recognition. By contrast to these measures, both speed of processing and attention/vigilance showed little development before the age of 14 years, but significant increase thereafter, with R 2 maximized by an exponential model for both measures (r = 0.64 and r = 0.74, respectively, p < 0.001) (Fig. 3). Correspondingly, in repeated-measures ANOVA, across all four tests, there was a significant task × age interaction (F 3,28 = 21.5, p < 0.001). Although the task × age interaction was not significantly different for auditory and facial emotion recognition (F 1,30 = 1.21, p = 0.28), trajectories of both were significantly different from both processing speed (F 1,30 = 25.3, p < 0.001) and attention (F 1,30 = 59.1, p < 0.001). As expected, trajectories of processing speed and attention were not significantly different from each other (F 1,30 = 0.0, p = 0.99).
Normal development of social and other cognition in the Nathan Kline Institute Rockland sample. Percentage accuracy across ages for (a) the Penn Emotion Recognition Test – 40 faces (ER40), (b) the Auditory Emotion Recognition (AER) Test, (c) Measurement and Treatment Research to Improve Cognition in Schizophrenia (MATRICS) Consensus Cognitive Battery (MCCB) speed of processing and (d) MCCB attention/vigilance.

Comparison of clinical and developmental cohorts
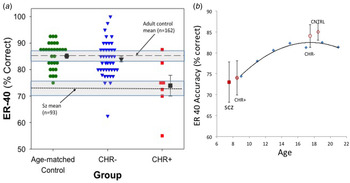
When data from the CHR group for face emotion recognition were compared with neurodevelopmental norms (Nooner et al. Reference Nooner, Colcombe, Tobe, Mennes, Benedict, Moreno, Panek, Brown, Zavitz, Li, Sikka, Gutman, Bangaru, Schlachter, Kamiel, Anwar, Hinz, Kaplan, Rachlin, Adelsberg, Cheung, Khanuja, Yan, Craddock, Calhoun, Courtney, King, Wood, Cox, Kelly, Di Martino, Petkova, Reiss, Duan, Thomsen, Biswal, Coffey, Hoptman, Javitt, Pomara, Sidtis, Koplewicz, Castellanos, Leventhal and Milham2012), mean scores from CHR+ subjects and schizophrenia patients were at or below those observed in 10-year-olds, whereas CHR− subjects and HCs showed age-appropriate performance levels, consistent with the larger Philadelphia Neurodevelopment Cohort (Fig. 4b ). By contrast, no reduction was observed in FSIQ, or in tests of processing speed index or attention/vigilance, suggesting maintenance of other neurocognitive functions in CHR+ subjects despite emotion recognition deficits.
Face emotion recognition across groups: age-matched controls; clinical high risk (CHR) participants who transitioned to psychosis (CHR+); CHR participants who did not transition to psychosis (CHR−). Percentage accuracy at baseline for the Penn Emotion Recognition Test – 40 faces (ER-40) from Fig. 1 for at-risk groups and age-matched controls (CNTRL), (a) illustrated in a dot plot (as compared with schizophrenia and local populations) and (b) plotted against the cross-sectional developmental growth curve of scores on the same test in the Philadelphia Neurodevelopment Cohort (courtesy of Holly Moore, Ph.D.). In Fig. 4a , individual data for age-matched healthy controls (circles), CHR− (triangles) and CHR+ (squares) were compared with mean accuracy for adult controls in New York (dashed line) and with schizophrenia patients (Sz; dotted line), both with 95% confidence intervals (shaded area). Similar results were obtained when groups were compared with external norms. In Fig. 4b , mean (s.d.) ER40 percentile accuracy for schizophrenia patient (SCZ) and control groups were mapped along the normal growth curve derived from 9492 children and adolescents in Philadelphia.

Discussion
Early prediction of schizophrenia is critical, so that effective preventive strategies can be developed and implemented. Known predictors of psychosis transition in CHR cohorts include subthreshold thought disorder (Klosterkotter et al. Reference Klosterkotter, Hellmich, Steinmeyer and Schultze-Lutter2001; Haroun et al. Reference Haroun, Dunn, Haroun and Cadenhead2006; Cannon et al. Reference Cannon, Cadenhead, Cornblatt, Woods, Addington, Walker, Seidman, Perkins, Tsuang, McGlashan and Heinssen2008; Ruhrmann et al. Reference Ruhrmann, Schultze-Lutter, Salokangas, Heinimaa, Linszen, Dingemans, Birchwood, Patterson, Juckel, Heinz, Morrison, Lewis, von Reventlow and Klosterkotter2010; Bearden et al. Reference Bearden, Wu, Caplan and Cannon2011; Demjaha et al. Reference Demjaha, Valmaggia, Stahl, Byrne and McGuire2012; Nelson et al. Reference Nelson, Yuen, Wood, Lin, Spiliotacopoulos, Bruxner, Broussard, Simmons, Foley, Brewer, Francey, Amminger, Thompson, McGorry and Yung2013; DeVylder et al. Reference DeVylder, Muchomba, Gill, Ben-David, Walder, Malaspina and Corcoran2014), negative symptom severity (Velthorst et al. Reference Velthorst, Nieman, Becker, van de Fliert, Dingemans, Klaassen, de Haan, van Amelsvoort and Linszen2009; Demjaha et al. Reference Demjaha, Valmaggia, Stahl, Byrne and McGuire2012; Piskulic et al. Reference Piskulic, Addington, Cadenhead, Cannon, Cornblatt, Heinssen, Perkins, Seidman, Tsuang, Walker, Woods and McGlashan2012; Nelson et al. Reference Nelson, Yuen, Wood, Lin, Spiliotacopoulos, Bruxner, Broussard, Simmons, Foley, Brewer, Francey, Amminger, Thompson, McGorry and Yung2013; Valmaggia et al. Reference Valmaggia, Stahl, Yung, Nelson, Fusar-Poli, McGorry and McGuire2013) and sensory processing deficits (Bodatsch et al. Reference Bodatsch, Ruhrmann, Wagner, Muller, Schultze-Lutter, Frommann, Brinkmeyer, Gaebel, Maier, Klosterkotter and Brockhaus-Dumke2011; Kayser et al. Reference Kayser, Tenke, Kroppmann, Alschuler, Ben-David, Fekri, Bruder and Corcoran2013, Reference Kayser, Tenke, Kroppmann, Alschuler, Fekri, Ben-David, Corcoran and Bruder2014; Perez et al. Reference Perez, Woods, Roach, Ford, McGlashan, Srihari and Mathalon2014). The present study examined facial and auditory emotion recognition deficits as potential additional predictors of liability for transition to schizophrenia. Emotion recognition deficits are profound in schizophrenia (Haskins et al. Reference Haskins, Shutty and Kellogg1995; Leitman et al. Reference Leitman, Foxe, Butler, Saperstein, Revheim and Javitt2005; Leitman et al. Reference Leitman, Hoptman, Foxe, Saccente, Wylie, Nierenberg, Jalbrzikowski, Lim and Javitt2007; Kohler et al. Reference Kohler, Walker, Martin, Healey and Moberg2010; Gold et al. Reference Gold, Butler, Revheim, Leitman, Hansen, Gur, Kantrowitz, Laukka, Juslin, Silipo and Javitt2012; Kantrowitz et al. Reference Kantrowitz, Hoptman, Leitman, Silipo and Javitt2014) and are evident early in illness (Edwards et al. Reference Edwards, Pattison, Jackson and Wales2001; Kucharska-Pietura et al. Reference Kucharska-Pietura, David, Masiak and Phillips2005; Addington et al. Reference Addington, Saeedi and Addington2006, Reference Addington, Penn, Woods, Addington and Perkins2008, Reference Addington, Piskulic, Perkins, Woods, Liu and Penn2012; van Rijn et al. Reference van Rijn, Aleman, de Sonneville, Sprong, Ziermans, Schothorst, van Engeland and Swaab2011; Amminger et al. Reference Amminger, Schafer, Papageorgiou, Klier, Schlogelhofer, Mossaheb, Werneck-Rohrer, Nelson and McGorry2012; Thompson et al. Reference Thompson, Papas, Bartholomeusz, Allott, Amminger, Nelson, Wood and Yung2012; Wolwer et al. Reference Wolwer and Frommann2012; Comparelli et al. Reference Comparelli, Corigliano, De Carolis, Mancinelli, Trovini, Ottavi, Dehning, Tatarelli, Brugnoli and Girardi2013; Kohler et al. Reference Kohler, Richard, Brensinger, Borgmann-Winter, Conroy, Moberg, Gur, Gur and Calkins2014), adding to their potential utility as markers of emergent schizophrenia.
Principal findings of the present study are threefold. First, although CHR subjects as a group were not impaired in face emotion recognition, significant deficits were observed within the subgroup that later developed schizophrenia. In this CHR+ subgroup, deficits evident before psychosis onset were of similar magnitude to those observed in established schizophrenia and significant relative to both HC and CHR subjects who did not develop schizophrenia, supporting its specificity for the illness. Equivalent deficits were observed for face emotion identification and discrimination.
In the present study, measures of general intelligence and neurocognition were not significantly different between CHR+ and CHR− subjects. Of note, in published multicenter studies of cognition in CHR+ v. CHR− subjects (Seidman et al. Reference Seidman, Giuliano, Meyer, Addington, Cadenhead, Cannon, McGlashan, Perkins, Tsuang, Walker, Woods, Bearden, Christensen, Hawkins, Heaton, Keefe, Heinssen and Cornblatt2010), the effect size has been found to be about 0.4 s.d. units. Deficits of this magnitude would be significant only with sample sizes much larger than those used in the present study (n > 100). It is therefore noteworthy that significant deficits in the ER40 were observed, corresponding to a large effect-size (0.9 s.d. units) per group. Other measures such as verbal fluency and memory may also distinguish CHR+ from CHR− subjects with a similar effect size of about 0.4 (Fusar-Poli et al. Reference Fusar-Poli, Deste, Smieskova, Barlati, Yung, Howes, Stieglitz, Vita, McGuire and Borgwardt2012b ). Such measures were not included in the present study so their utility relative to the ER40 could not be assessed. Although the number of CHR+ subjects included in the study (7/49 total CHR patients, 14.3% 2-year conversion rate) was relatively small relative to other recent predictor studies (e.g. Meyer & Kurtz, Reference Meyer and Kurtz2009; Nieman et al. Reference Nieman, Ruhrmann, Dragt, Soen, van Tricht, Koelman, Bour, Velthorst, Becker, Weiser, Linszen and de Haan2014; Perkins et al. Reference Perkins, Jeffries, Addington, Bearden, Cadenhead, Cannon, Cornblatt, Mathalon, McGlashan, Seidman, Tsuang, Walker, Woods and Heinssen2015), emotion recognition represents a critical construct in schizophrenia research and is relatively understudied in CHR patients. Furthermore, the results were statistically robust and survived both Bonferroni correction for multiple comparisons and non-parametric statistical analysis to mitigate effects of potential outliers. Furthermore, both the ER40 and EMODIFF are well-validated, easily implementable tasks, so that the present results have potential short-term clinical utility, as well as assisting long term in refining etiological theories of schizophrenia.
Second, in logistic regression analysis, emotion recognition deficits remained as significant predictors over and above general cognition and contributions of other known risk factors including severity of subthreshold thought disorder (Klosterkotter et al. Reference Klosterkotter, Hellmich, Steinmeyer and Schultze-Lutter2001; Haroun et al. Reference Haroun, Dunn, Haroun and Cadenhead2006; Cannon et al. Reference Cannon, Cadenhead, Cornblatt, Woods, Addington, Walker, Seidman, Perkins, Tsuang, McGlashan and Heinssen2008; Ruhrmann et al. Reference Ruhrmann, Schultze-Lutter, Salokangas, Heinimaa, Linszen, Dingemans, Birchwood, Patterson, Juckel, Heinz, Morrison, Lewis, von Reventlow and Klosterkotter2010; Bearden et al. Reference Bearden, Wu, Caplan and Cannon2011; Demjaha et al. Reference Demjaha, Valmaggia, Stahl, Byrne and McGuire2012; Nelson et al. Reference Nelson, Yuen, Wood, Lin, Spiliotacopoulos, Bruxner, Broussard, Simmons, Foley, Brewer, Francey, Amminger, Thompson, McGorry and Yung2013; DeVylder et al. Reference DeVylder, Muchomba, Gill, Ben-David, Walder, Malaspina and Corcoran2014) and negative symptoms (Velthorst et al. Reference Velthorst, Nieman, Becker, van de Fliert, Dingemans, Klaassen, de Haan, van Amelsvoort and Linszen2009; Demjaha et al. Reference Demjaha, Valmaggia, Stahl, Byrne and McGuire2012; Piskulic et al. Reference Piskulic, Addington, Cadenhead, Cannon, Cornblatt, Heinssen, Perkins, Seidman, Tsuang, Walker, Woods and McGlashan2012; Nelson et al. Reference Nelson, Yuen, Wood, Lin, Spiliotacopoulos, Bruxner, Broussard, Simmons, Foley, Brewer, Francey, Amminger, Thompson, McGorry and Yung2013; Valmaggia et al. Reference Valmaggia, Stahl, Yung, Nelson, Fusar-Poli, McGorry and McGuire2013). Furthermore, as opposed to negative symptoms, which show low sensitivity but high specificity at the point of maximal discrimination, emotion recognition deficits showed higher sensitivity (0.93) than specificity (0.71). Consequently, an optimal model combining both emotion recognition values and suprathreshold negative symptoms (SIPS > 22) showed high values for both sensitivity (0.86) and specificity (0.98) and high (0.96) overall accuracy (Table 2), comparable with or higher than that seen for symptoms alone (Cannon et al. Reference Cannon, Cadenhead, Cornblatt, Woods, Addington, Walker, Seidman, Perkins, Tsuang, McGlashan and Heinssen2008; Ruhrmann et al. Reference Ruhrmann, Schultze-Lutter, Salokangas, Heinimaa, Linszen, Dingemans, Birchwood, Patterson, Juckel, Heinz, Morrison, Lewis, von Reventlow and Klosterkotter2010; Nelson et al. Reference Nelson, Yuen, Wood, Lin, Spiliotacopoulos, Bruxner, Broussard, Simmons, Foley, Brewer, Francey, Amminger, Thompson, McGorry and Yung2013), though with the caveat that these were not a priori criteria, as had been employed in prior studies such as by Ruhrmann et al. (2010). Our model's accuracy in predicting psychosis was also comparable with or greater than that observed for risk biomarkers, such as auditory mismatch negativity (Bodatsch et al. Reference Bodatsch, Ruhrmann, Wagner, Muller, Schultze-Lutter, Frommann, Brinkmeyer, Gaebel, Maier, Klosterkotter and Brockhaus-Dumke2011; Perez et al. Reference Perez, Woods, Roach, Ford, McGlashan, Srihari and Mathalon2014) or neuroimaging patterns (Koutsouleris et al. Reference Koutsouleris, Riecher-Rossler, Meisenzahl, Smieskova, Studerus, Kambeitz-Ilankovic, von Saldern, Cabral, Reiser, Falkai and Borgwardt2015). Of note, once emotion recognition and negative symptoms were considered, contributions of thought disorder were no longer significant.
Third, using a parallel developmental study – the large Philadelphia Neurodevelopment Cohort, it was demonstrated that levels of face emotion recognition deficits associated with the pre-psychosis state in schizophrenia were equivalent to levels of accuracy reached by the age of 10 years in normal development, supporting the concept that these deficits may be stable pre-morbid features in individuals predisposed to schizophrenia (Dickson et al. Reference Dickson, Calkins, Kohler, Hodgins and Laurens2014). In normal development, face emotion recognition ability is nearly fully developed by the end of early adolescence (Vicari et al. Reference Vicari, Reilly, Pasqualetti, Vizzotto and Caltagirone2000; Gao & Maurer, Reference Gao and Maurer2010; Rosenqvist et al. Reference Rosenqvist, Lahti-Nuuttila, Laasonen and Korkman2013). By contrast, AER (Cohen et al. Reference Cohen, Prather, Town and Hynd1990; Doherty et al. Reference Doherty, Fitzsimons, Asenbauer and Staunton1999; Morton & Trehub, Reference Morton and Trehub2001) and other aspects of neurocognition such as processing speed or attention/vigilance (Roalf et al. Reference Roalf, Gur, Ruparel, Calkins, Satterthwaite, Bilker, Hakonarson, Harris and Gur2014) continue to improve throughout adolescence, the age of schizophrenia risk, into adulthood. The earlier normal development of emotion identification in faces (versus speech) may reflect earlier maturation of visual versus auditory or prefrontal brain regions (Hill et al. Reference Hill, Inder, Neil, Dierker, Harwell and Van Essen2010).
Although emotion recognition deficits are well established across stages of schizophrenia, relatively few studies to date have evaluated their predictive power for psychosis onset in CHR cohorts. An initial prospective study performed by Addington et al. (Reference Addington, Piskulic, Perkins, Woods, Liu and Penn2012), using tests developed by Kerr & Neale (Reference Kerr and Neale1993), found no predictive value for emotion recognition deficits, though dropout rates were high at 46% by 6 months and 66% by 12 months. Of note, dropouts were considered non-converters, potentially biasing against detection of transition to psychosis. A more recent study in a primarily female cohort that included placebo-assigned participants in an omega-3 polyunsaturated fatty acids clinical trial, using a modification of Feinberg's procedure (Feinberg et al. Reference Feinberg, Rifkin, Schaffer and Walker1986), also did not find decreased overall accuracy in face emotion recognition among CHR+ versus CHR− individuals, but did find significant reduced accuracy in identifying fearful and neutral faces (Allott et al. Reference Allott, Schafer, Thompson, Nelson, Bendall, Bartholomeusz, Yuen, McGorry, Schlogelhofer, Bechdolf and Amminger2014). In the present battery, the highest predictive value was observed also for sensitivity to fearful and angry faces, partially consistent with the prior CHR study. The decrease in discrimination of negative emotions of fear and anger from neutral expression is consistent with prior cross-sectional studies in schizophrenia and its risk states (Kohler et al. Reference Kohler, Turner, Bilker, Brensinger, Siegel, Kanes, Gur and Gur2003; Premkumar et al. Reference Premkumar, Cooke, Fannon, Peters, Michel, Aasen, Murray, Kuipers and Kumari2008; Eack et al. Reference Eack, Mermon, Montrose, Miewald, Gur, Gur, Sweeney and Keshavan2010; Pinkham et al. Reference Pinkham, Brensinger, Kohler, Gur and Gur2011; van Rijn et al. Reference van Rijn, Aleman, de Sonneville, Sprong, Ziermans, Schothorst, van Engeland and Swaab2011; Dickson et al. Reference Dickson, Calkins, Kohler, Hodgins and Laurens2014). Similarly, although the number of subjects studied was low, promising results were obtained with our AER battery as a predictor, encouraging further research.
An unanswered question in the present study is the degree to which deficits in emotion processing are related to more basic deficits in early visual and auditory processing (Butler et al. Reference Butler, Abeles, Weiskopf, Tambini, Jalbrzikowski, Legatt, Zemon, Loughead, Gur and Javitt2009). van Rijn et al. (Reference van Rijn, Aleman, de Sonneville, Sprong, Ziermans, Schothorst, van Engeland and Swaab2011) described deficits in face emotion processing in CHR individuals in the context of otherwise normal basic face perception (van Rijn et al. Reference van Rijn, Aleman, de Sonneville, Sprong, Ziermans, Schothorst, van Engeland and Swaab2011), suggesting relative preservation of occipital relative to temporal face regions as in schizophrenia (Butler et al. Reference Butler, Tambini, Yovel, Jalbrzikowski, Ziwich, Silipo, Kanwisher and Javitt2008). Furthermore, the present study is consistent with prior work from our group demonstrating impaired form perception on the Rorschach test in CHR individuals relative to HCs (Kimhy et al. Reference Kimhy, Corcoran, Harkavy-Friedman, Ritzler, Javitt and Malaspina2007), as well as more recent work demonstrating impaired visual reading ability in CHR individuals (Revheim et al. Reference Revheim, Corcoran, Dias, Hellmann, Martinez, Butler, Lehfeld, DiCostanzo, Albert and Javitt2014). Over recent years, there has been an increased focus on sensory processing impairments, particularly auditory, in schizophrenia (Javitt, Reference Javitt2009) and CHR individuals (Bodatsch et al. Reference Bodatsch, Ruhrmann, Wagner, Muller, Schultze-Lutter, Frommann, Brinkmeyer, Gaebel, Maier, Klosterkotter and Brockhaus-Dumke2011; Kayser et al. Reference Kayser, Tenke, Kroppmann, Alschuler, Ben-David, Fekri, Bruder and Corcoran2013, Reference Kayser, Tenke, Kroppmann, Alschuler, Fekri, Ben-David, Corcoran and Bruder2014; Perez et al. Reference Perez, Woods, Roach, Ford, McGlashan, Srihari and Mathalon2014), and demonstration of predictive value for sensory measures such as auditory mismatch negativity (Bodatsch et al. Reference Bodatsch, Ruhrmann, Wagner, Muller, Schultze-Lutter, Frommann, Brinkmeyer, Gaebel, Maier, Klosterkotter and Brockhaus-Dumke2011; Kayser et al. Reference Kayser, Tenke, Kroppmann, Alschuler, Fekri, Ben-David, Corcoran and Bruder2014; Perez et al. Reference Perez, Woods, Roach, Ford, McGlashan, Srihari and Mathalon2014). To date, studies of emotion recognition and basic sensory function have been conducted in separate investigations. The present study argues for future investigations using parallel sensory and emotion recognition measures.
In addition to their predictive power, it has been proposed that emotion recognition deficits may also play a contributory role in the development of psychosis in CHR individuals. Specifically, difficulties in participating in normal social interaction may lead directly over time to social withdrawal and ‘deafferentation’ (Hoffman, Reference Hoffman2007), which are known exacerbating features in early psychosis. To the extent that emotion recognition deficits do contribute directly to development of psychosis, early detection may be critical to permit timely intervention. Recent studies suggest that impaired face emotion recognition may be remediable, with generalization of effect including improved prosody and social function (Wolwer & Frommann, Reference Wolwer, Brinkmeyer, Stroth, Streit, Bechdolf, Ruhrmann, Wagner and Gaebel2011), and normalization of activity in the face-processing network (Habel et al. Reference Habel, Koch, Kellermann, Reske, Frommann, Wolwer, Zilles, Shah and Schneider2010). Implementation of such efforts during the CHR period may thus be critical for altering long-term course.
A notable finding in this study is the strong correlation between subthreshold thought disorder and face emotion recognition. Both processes have been studied independently but this is the first study to our knowledge to include measures of both within the same CHR sample. At present, the basis for this correlation remains unknown. One potential basis for integration occurs at the level of regional dysfunction, with both emotion recognition (Calder & Young, Reference Calder and Young2005; Atkinson & Adolphs, Reference Atkinson and Adolphs2011; Said et al. Reference Said, Haxby and Todorov2011) and verbal communication (Rama et al. Reference Rama, Relander-Syrjanen, Carlson, Salonen and Kujala2012; Ozyurek, Reference Ozyurek2014) depending heavily on structures within the superior temporal sulcus (STS), with right STS activity being critical for the detection of features such as face emotion recognition or trustworthiness (Dzhelyova et al. Reference Dzhelyova, Ellison and Atkinson2011) and the left STS playing a significant role in normal language (Brunetti et al. Reference Brunetti, Zappasodi, Marzetti, Perrucci, Cirillo, Romani, Pizzella and Aureli2014) and in thought disorder associated with schizophrenia (Horn et al. Reference Horn, Federspiel, Wirth, Muller, Wiest, Walther and Strik2010). A second occurs at the level of shared neurochemical substrates, such that both schizophrenia-like deficits in early visual processing (Javitt, Reference Javitt2009) and thought disorder (Adler et al. Reference Adler, Goldberg, Malhotra, Pickar and Breier1998) are induced by antagonists of N-methyl-d-aspartate receptors (NMDAR), suggesting that these impairments may index subthreshold NMDAR dysfunction. Regardless of the underlying mechanism, the significant correlation between these two constructs, which survives co-variation for severity of symptoms or more general neurocognitive dysfunction, argues for further joint investigation to determine shared underlying substrates.
The main limitation in the current study is cohort size and an absence of simultaneous data on physiological measures, such as auditory mismatch negativity, which have also been shown to predict conversion (Bodatsch et al. Reference Bodatsch, Ruhrmann, Wagner, Muller, Schultze-Lutter, Frommann, Brinkmeyer, Gaebel, Maier, Klosterkotter and Brockhaus-Dumke2011; Kayser et al. Reference Kayser, Tenke, Kroppmann, Alschuler, Fekri, Ben-David, Corcoran and Bruder2014; Perez et al. Reference Perez, Woods, Roach, Ford, McGlashan, Srihari and Mathalon2014) and might help to further refine the prediction algorithm. Future studies will entail the assessment in tandem of symptoms, emotion recognition, and neurophysiological measures in order to further refine the risk prediction algorithm and to further understand the early pathophysiological mechanisms of schizophrenia onset.
Conclusion
Although significant improvements have been made over recent years in the development of predictors of transition to psychosis among CHR individuals, established scales such as the SIPS/SOPS are only partially effective. The present study suggests that face emotion recognition ability, which reaches adult levels early in adolescence, may represent a significant additional predictor of conversion, consistent with its known role in predicting impaired outcome in schizophrenia. The present results are consistent also with other recent studies establishing early visual impairment as potential endophenotypes for psychotic disorders (Yeap et al. Reference Yeap, Kelly, Sehatpour, Magno, Javitt, Garavan, Thakore and Foxe2006; Revheim et al. Reference Revheim, Corcoran, Dias, Hellmann, Martinez, Butler, Lehfeld, DiCostanzo, Albert and Javitt2014). The present study thus adds to the emergent literature suggesting that sensory-level deficits, including not only deficits in auditory (Bodatsch et al. Reference Bodatsch, Ruhrmann, Wagner, Muller, Schultze-Lutter, Frommann, Brinkmeyer, Gaebel, Maier, Klosterkotter and Brockhaus-Dumke2011; Kayser et al. Reference Kayser, Tenke, Kroppmann, Alschuler, Fekri, Ben-David, Corcoran and Bruder2014; Perez et al. Reference Perez, Woods, Roach, Ford, McGlashan, Srihari and Mathalon2014) and olfactory (Kayser et al. Reference Kayser, Tenke, Kroppmann, Alschuler, Ben-David, Fekri, Bruder and Corcoran2013) processing, but also visual-level impairments (Kimhy et al. Reference Kimhy, Corcoran, Harkavy-Friedman, Ritzler, Javitt and Malaspina2007; Perez et al. Reference Perez, Shafer and Cadenhead2012; Revheim et al. Reference Revheim, Corcoran, Dias, Hellmann, Martinez, Butler, Lehfeld, DiCostanzo, Albert and Javitt2014), may represent critical targets for early detection and intervention.
Supplementary material
For supplementary material accompanying this paper visit http://dx.doi.org/10.1017/S0033291715000902
Acknowledgments
This study was supported by the National Institute of Mental Health (R21MH086125, R01P50MH086384 and R01P50MH086384 S1) and the New York State Office of Mental Health.
Declaration of Interest
None.