I. INTRODUCTION
Recently, the in situ bulk metallic glass matrix composites (in situ BMGCs) especially the one with tough dendritic phase gradually became the hot spot in the bulk metallic glass materials due to their distinctive mechanical properties. On the one hand, large numbers of in situ BMGCs having excellent mechanical properties have been developed.Reference Qiao1 For example, Hoffman et al.Reference Hofmann, Suh, Wiest, Lind, Demetriou and Johnson2,Reference Hofmann, Suh, Wiest, Duan, Lind, Demetriou and Johnson3 designed a series of Zr-based and Ti-based in situ BMGCs with considerable plastic deformation and high fracture toughness. Jeon et al.Reference Oh, Kim, Lee and Kim4 successfully developed the in situ bulk metallic glass matrix composites possessing high yield strength (1.3 GPa) and obvious plastic deformation (∼7%) through optimizing the conventional Ti–6Al–4V alloy. On the other hand, the deformation mechanism by which the in situ BMGCs with tough dendritic phase aroused a lot of attention. Oh et al.,Reference Oh, Kim, Lee and Kim4 Ha et al.,Reference Ha, Kim and Lee5 and Qiao et al.Reference Qiao, Sun, Huang, Zhang, Liaw and Chuang6,Reference Qiao, Zhang, Liaw and Chen7 systematically analyzed and studied the mechanical behavior and microdeformation mechanism of these in situ bulk metallic glass matrix composites. The results revealed that the mechanical behaviors of these composites are not only related to the deformation behaviors of the two phases but also closely to the microstructures of the materials. Furthermore, He,Reference He, Eckert and Loser8 Eckert,Reference He, Eckert and Loser8,Reference Pauly, Gorantla, Wang, Kuhn and Eckert9 Löser,Reference He, Eckert and Loser8,Reference Pauly, Gorantla, Wang, Kuhn and Eckert9 and WuReference Wu, Xiao, Chen, Liu and Lu10 discovered that the formation and transformation of the ductile crystalline phases in the in situ BMGs contribute to the promotion of their ductility. In their work, it is found that the stress-induced phase transformation and twinning are the key factors of the observed work hardening and ductility improvement. Thus based on the close relations between the microstructures and the mechanical behaviors, Hoffman et al.Reference Hofmann, Suh, Wiest, Duan, Lind, Demetriou and Johnson3 and Qiao et al.Reference Qiao, Zhang, Jiang, Zhang, Liaw, Ren and Chen11 improved the mechanical properties of the corresponding composites with methods such as semisolid processing and Bridgman solidification, respectively.
Up to now, much research on these composites has been conducted using samples prepared by the conventional rapid solidification techniques.Reference Mu, Zhu, Su, Wang, Zhang and Ren12–Reference Sha, Zhu, Fu, Li, Wang, Zhang, Zhang and Hu16 For the close relations between the microstructures and mechanical properties of these materials, the variation of the two aspects leading by the different quick solidification methods is more obvious.Reference Narayan, Singh, Hofmann, Hutchinson, Flores and Ramamurty13,Reference Sha, Zhu, Fu, Li, Wang, Zhang, Zhang and Hu16,Reference Tang17 At the same time, due to the lack of effective technical controls under the condition of the rapid solidification, the diversities of the sample's microstructures and the mechanical properties among different preparations are hard to be eliminated. Thus, the study on the influences of different preparation methods on the microstructures and properties of the in situ bulk-metallic-glass-matrix composites has a vital practical significance.
In this study, the evolution principles of the microstructures and mechanical properties of the Ti45.7Zr33Ni3Cu5.8Be12.5 in situ BMGCReference Tang, Zhu, Fu, Wang, Li, Zhang, Ma, Zhang and Hu15 (denoted as ZT-M) under different solidification conditions will be discussed through analyzing the variations on the corresponding aspects of the ZT-M samples obtained by different preparations. Finally, we will reach the goal of gaining the sample with stable properties as well as summarizing and optimizing the techniques by studying the influences of different preparations on the microstructures and mechanical properties of the alloy.
II. EXPERIMENTAL
Samples of the Ti45.7Zr33Ni3Cu5.8Be12.5 alloy were fabricated by first melting ultra-high purity elements (>99.9% wt%) in a Ti-gettered arc melter. The prealloyed ingots (denoted as MA) were then remelted for the casting process to obtain cylindrical samples through suction-casting (denoted as SC) and injection-casting (denoted as IC). All the samples were labeled by their diameters: 5 mm (denoted as D5), 6 mm (denoted as D6), and 8 mm (denoted as D8). Testing techniques such as differential x-ray diffraction (XRD, Philips PW1050, Cu Kα) for the crystal structure, scanning electron microscopy (SEM, Quanta 600, FEI Corporate, Hillsboro, OR), differential scanning calorimetry (DSC, Netzsch DSC 204F, aluminum crucible, NETZSCH group, Selb, Germany), and mechanical tests (INSTRON 5582, INSTRON Corporation, Norwood, MA) were used.
III. RESULTS AND DISCUSSION
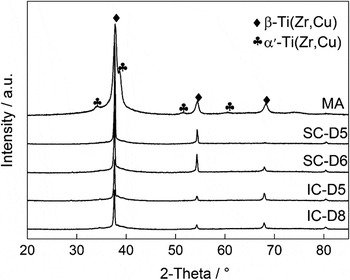
Figure 1 shows the XRD pattern scan of the ZT-M samples produced by different preparation methods. The master ingots (i.e., MA) are composed of the β-Ti(Zr,Cu) phase (body-centered cubic (bcc) structure), α′-Ti(Zr,Cu) phase (hexagonal structure), and amorphous phase, while the suction casting samples (SC-D5 and SC-D6) and the injection casting samples (IC-D5 and IC-D8) only present the β-Ti(Zr,Cu) phase and amorphous phase.
XRD patterns of the ZT-M samples obtained by different methods.

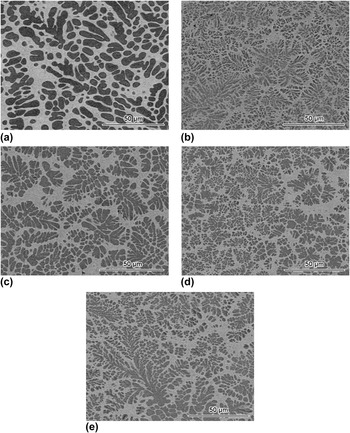
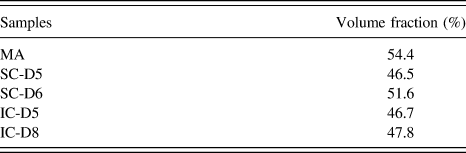
Figure 2 shows the SEM micrograph of the microstructures of the ZT-M samples. It can be seen that all the microstructures are made up of the amorphous phase and dispersed solid solutions. Furthermore, the solid solutions in MA are mostly round and elliptical while in other samples they are mostly dendrites. Regardless of MA, for the same preparation method, samples with smaller size always possess tinier and more homogeneous solid solutions than those in ones with larger size. The volume fracture of the solid solutions (Table I) presents that all the samples have almost the same value that is around 49.4 vol%. The data are consistent with the description of the ZT-M samples in Refs. Reference Tang, Zhu, Fu, Wang, Li, Zhang, Ma, Zhang and Hu15 and Reference Tang17. To investigate the influences of the preparations on the microstructures of the ZT-M samples, we first discuss the effects of different heating and cooling methods on ZT-M samples. For heating techniques, samples of MA, SC-D5, and SC-D6 are produced through arc melting with a water-cooled copper crucible while samples of IC-D5 and IC-D8 are obtained through the induction heating methods. For arc melting, according to the previous simulations,Reference Zheng18 the temperature in the vicinity of the arc reaches as high as 2552 K, which is much higher than the melting point of the amorphous (915 K) and that of the solid solutions (1700 K). And the temperature in the vicinity of the crucible is only about 1512 K that is higher than the melting point of the amorphous phase and near the solid solution's melting point. It means that the melt in the vicinity of the arc will be homogeneous, while the solid solution phase will precipitate from the melt near the crucible caused by the relatively low temperature. On account of the temperature differences between the two regions, there produces rather large supercooling degree leading to the probability of high nucleation rates and thus forms many tiny and dispersed solid solutions. In general, the samples present the molten state at the top while semisolid state at the bottom during the heating process. According to the description about the semisolid processing on in situ BMGC,Reference Hofmann, Suh, Wiest, Duan, Lind, Demetriou and Johnson3,Reference Cheng, Chen, Xu, Du, Li and Liu19 the preproduced solid solutions will gradually undergo complicated morphological variations like growing and ripening in the melt.
SEM images for the central parts of the ZT-M samples obtained by different methods: (a) A sample from the arc melted ZT-M master alloy ingot (MA); (b and c) a cylindrical sample with a diameter of 5 and 6 mm obtained by suction casting, respectively (SC-D5 and SC-D6); (d and e) a cylindrical sample with a diameter of 5 and 8 mm obtained by injection casting, respectively (IC-D5 and IC-D8).

The volume fraction of the solid solution phase in ZT-M samples obtained by different methods.
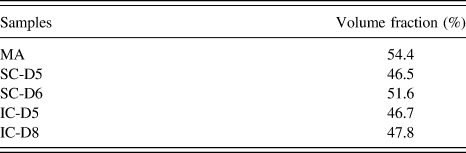
And the differences among MA, SC-D5, and SC-D6 lie mainly on the process of cooling. The bottom of MA contacts with the water-cooled copper crucible possesses rather high cooling rate, while the top of MA contacts with the Ti-gettered argon atmosphere possesses slower cooling rate. Thus, most of the heat will be transmitted through the alloy and dissipate via the crucible, which will result in a relatively low average cooling rate. In contrast, the whole samples of SC-D5 and SC-D6 are cooled through the copper mold. Because the specific surface area between the samples and the copper mold is higher than that between the samples and the crucible, SC-D5 and SC-D6 possess higher cooling rates which lead to the formation of tinier dendrites. This phenomenon can be verified from Figs. 2(b) and 2(c). On the other hand, with the slower cooling rates, the dendrites in MA will precipitate, grow, and ripen more sufficiently. Therefore, the solid solutions in MA present the elliptical ones rather than the tiny dendrites. At the same time, the greater volume fracture of the solid solutions in MA also proved this point (Table I).
For induction heating, samples are heated under the homogeneous magnetic field, which leads to the similar temperature inside the alloys. Considering the reaction between the quartz crucible and ZT-M,Reference Jeon, Kim, Joo, Kim and Lee20,Reference Mao21 we control the heating temperature between 1473 and 1573 K, which makes the alloy be in the semisolid state. According to the melting point, the amorphous matrix melts fully while the solid state of the solid solutions remains in this temperature range. Actually, though the temperature is lower than the melting points of the solid solutions, the melt of the amorphous phase will still be capable to dissolve part of the solid solutions and precipitate some later.Reference Tang17 So the solid solutions only undergo the procedure of fragmentation, ripening, and certain degree of dissolution in the matrix with uniform temperature. Due to the lack of the process of nucleation-growth, the solid solutions in IC samples are thicker and sparser than that of the SC samples [Figs. 2(b)–2(d)].
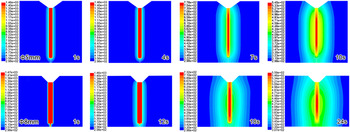
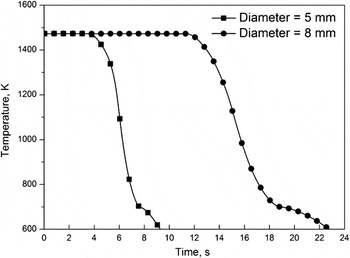
The major difference between IC-D5 and IC-D8 is the sample's size. To study the cooling process of samples with different sample sizes, numerical simulations are conducted using the finite volume method (FVM). We construct the model according to the real size of the molds and use six seeds in 1 mm to form the quadrangle unit grid. Besides, all the parameters such as initial temperature of the alloy (1473 K) and the initial temperature of the mold (298 K) are selected from Ref. Reference Sha, Zhu, Fu, Li, Wang, Zhang, Zhang and Hu16. Figure 3 shows that the heat is transmitted from the middle to the side with different cooling rates as time passes by. Figure 4 presents that the temperature variation of the middle of samples shows both a period of mild plateau and a period of sudden decline. ZT-M will undergo the glass transition at lower temperatures leading to the sudden change at the end of the curve. To measure the two samples' cooling rates, the average cooling rate during the sudden decline period is taken. Through calculation, we get the cooling rate of the middle part of IC-D5 is 144.8 K/s while IC-D8's is 73.3 K/s. These data reveal that the sample with larger size has a slower cooling rate especially in the middle part of the sample. Thus, the solid solutions in a large sample will grow and ripen more sufficiently. That is why the solid solutions of IC-D8 are larger than those of IC-D5. And the above reasons can also be expanded to the suction samples. With the slower cooling rate in the middle of the samples, SC-D6 exhibits larger size of the solid solutions than that of SC-D5.
The cooling process calculated by FVM for ZT-M samples with a diameter of 5 and 8 mm.

The cooling curves for the central parts of ZT-M samples with a diameter of 5 and 8 mm calculated by FVM analysis.

Furthermore, the phase composition of ZT-M and the volume fraction of the solid solutions are found to be related to the preparation methods. β-Ti(Zr,Cu) is a stable phase at high temperature and can only remain abound at the high cooling rate.Reference Lütjering and Williams22 Thus due to the rather slow cooling rate, parts of the β-Ti(Zr,Cu) in MA transform into α′-Ti(Zr,Cu). Also, with the slowest cooling rate of the current samples, the solid solutions' volume fraction of MA is the highest. In contrast, other samples preserve more β-Ti(Zr,Cu) better with higher cooling rate. Meanwhile, the solid solutions' volume fraction of SC-D6 is a little more than that of SC-D5 owing to a relatively low cooling rate. As to the injection samples, most of the original solid solutions do not melt during the heating process, so the solid solutions' volume fractions are almost the same. Also with the higher cooling rate, the solid solutions cannot completely precipitate from the melt leading to the slightly lower volume fractures than that of the SC samples.
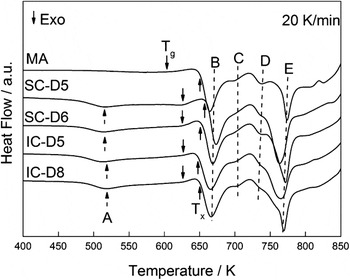
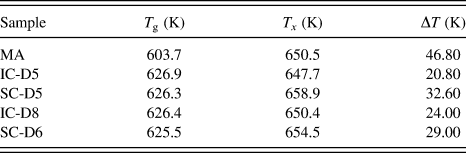
Combining the results of XRD in Fig. 1 with the microstructures shown in Fig. 2, the matrix of all samples fabricated through different preparations is amorphous. Although the microstructure variations of amorphous matrix are difficult to characterize through general experiments,Reference Cheng and Ma23 the results of DSC can reflect the change in microstructures indirectly.Reference Sha, Zhu, Tang, Fu, Li, Li, Wang, Zhang, Zhang and Hu24–Reference Evenson and Busch26Figure 5 (DSC curves) shows the obvious glass transition and crystallization of all samples at the heating rate of 20 K/min. For glass transition, MA possesses an obvious lower glass transition temperature (T g), while the T g of other samples is almost the same (see Table II). Actually, the effects of different preparations reflect on the crystallization temperature (T x): T x of SC samples is the highest; and the MA have the close T x to that of the injection samples. What worthy to be noticed is that the crystallization of ZT-M is rather complex. It mainly presents four exothermic peaks (denoted as B, C, D, and E). Peak B and peak E are not merely more obvious but also show some degree of overlapping with peak C and peak D as well. Figure 5 shows that MA presents the different behaviors in the DSC results by lacking peak A and containing weaker intensity of exothermic peaks than others. We found that the temperatures of peak A for IC-D5, IC-D8, SC-D5, and SC-D6 are separately distributed at 518.6, 518.9, 515.3, and 515.7 K in the DSC curve. This indicates that the variation of preparation methods does not influence peak A dramatically. Besides comparing the DSC curves of SC samples and IC samples to that of the amorphous alloy that has the similar constituents with ZT-M's matrix, it can be seen that peak A in SC samples and IC samples does not appear in the DSC curve of the amorphous alloy. This proves that the exothermic peak A represents the phase transition of the solid solutions rather than the amorphous phase.
DSC traces for ZT-M samples obtained by different methods examined at a heating rate of 20 K/min: The glass transition temperature (T g) and the crystallization onset temperature (T x) are marked with down and up arrows, respectively; the exothermic peaks are denoted as A–E peaks according to the ascending peak temperatures.

Thermal analysis data for ZT-M samples obtained by different methods.
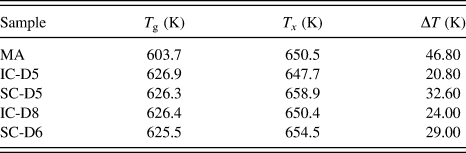
Figure 5 and Table II present that MA has almost the same T x as that of others and a lower T g than that of others, which leads to a rather broad supercooled liquid region (ΔT). It indicates that the supercooled liquid of amorphous matrix in MA possesses rather high level of thermal stability under the given experimental conditions. Just as the analysis before, the slower cooling rate leads to complete reactions between the solid solutions and residual liquid. And all these will make the amorphous matrix of MA reach to a more stable (broad ΔT) level than others. In other words, the supercooled liquid of MA possesses a high level of stability. At the same time, we discovered that the ΔT of SC samples is broader than that of the IC samples. Thus, we can surmise that the complex temperature field of arc melting will be benefited for the interactions between the residual liquid and the solid solutions, and thus improving the supercooled liquid stability.
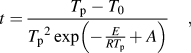
To further study the thermal stability variation of ZT-M samples at different heating rates, we use four heating rates (10, 20, 35, and 50 K/min) for the ZT-M samples produced via different preparations in the further DSC tests. All the corresponding results will be used to establish the continuous heating transformation (CHT)Reference Louzguine and Inoue27,Reference Zhu, Zhang, Wang, Ding and Hu28 diagram through the Kissinger equation for further discussion.
 $$t = {{{T_{\rm{p}}} - {T_0}} \over {\mathop {{T_{\rm{p}}}}\nolimits^2 \exp \left( { - {E \over {R{T_{\rm{p}}}}} + A} \right)}}\quad {\rm{,}}$$
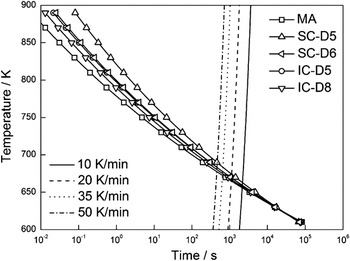
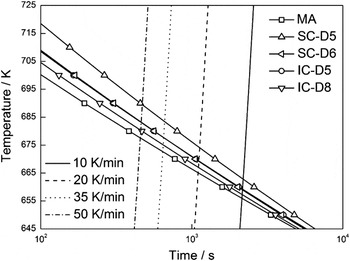
where t is the continuous heating time, T p is the peak temperature in the DSC, T 0 is the initial heating temperature, E is the apparent activation energy, R is the ideal gas constant, and A is a constant. Figures 6 and 7 present the CHT and the detail with an enlarged scale of the CHT diagrams of ZT-M samples produced by different preparation methods. From the two figures, we discovered that the curves of different ZT-M samples do have some kind of relations during a large period of time. By the left side of the CHT (namely at the high heating rate), the differences among all samples are more obvious; while with lowering down the heating rate, the differences begin to decrease and all the curves begin to converge. From the above equation, the CHT curves actually present the time for amorphous alloys to reach the temperature of the certain crystallization peak, namely the rate of crystallization reactions. So if the CHT curve lies beside the left parts, it means that the time for the alloy samples to reach the temperature of the crystallization is less, namely possessing a high rate of crystallization reactions and vice versa. Actually, MA owns the largest rate of crystallization reactions among rather broad heating rates. And the rate of crystallization reactions for other samples is slower than that of MA and presents the dropping trend with the decrease in samples' sizes. The entire phenomenon above proves that the high cooling rate does help to suppress the crystallization reaction. Combining with the analysis about the stability of supercooled liquid for all samples, an interesting question arises. The activation energy of MA is 264 kJ/mol which is higher than that of other samples (220–250 kJ/mol). It seems that it would be rather difficult for the supercooled liquid of the amorphous matrix in MA to transform into the crystalline structure. But CHT of MA presents the shortest time to reach the certain peak, which proves that the rate of crystallization reaction of MA will be very fast once starts. From the discussion in Ref. Reference Clavaguera-Mora, Clavaguera, Crespo and Pradell29, we know that large numbers of quench-in nuclei in the amorphous alloy will improve the crystallization of amorphous greatly. And the number of quench-in nuclei has a close relationship with the cooling rate: The lower the cooling rate is, the more quench-in nuclei in the amorphous matrix and vice versa.Reference Mao21 Before the crystallization begins, the kinetic conditions (such as diffusion etc.) of the supercooled liquid have not been met and thus will lead to the difficult start of the crystallization. Once the conditions are ripe for crystallization, large quantities of quench-in nuclei will become the cores and accelerate the reactions.
The CHT diagram for the ZT-M samples obtained by different methods as well as the curves with constant heating rates.

A magnified diagram for the intersections among the CHT curves of ZT-M samples obtained by different methods and the curves with heating rates of 10, 20, 35, and 50 K/min.

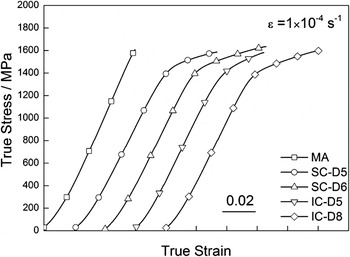
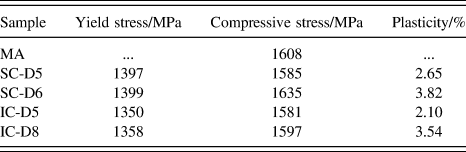
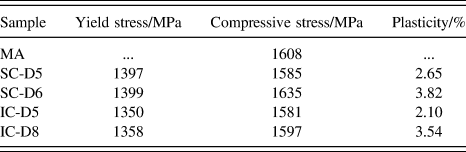
Figure 8 shows the uniaxial compression curve of the ZT-M samples obtained by different methods at room temperature. All the samples exhibit different degrees of plasticity as well as the obvious strain-hardening, except that MA presents the brittle fracture without any plastic deformation. From the data of Table III, SC-D6 and IC-D8 possess relatively good plasticity as 3.82 and 3.54%, respectively. At the same time, SC-D6 owns better advantages in the above aspect than IC-D8. For other samples, SC-D5 and IC-D5 possess almost the same degree of yield strength, while the plasticity of SC-D5 is higher than that of IC-D5. As to work hardening, all the curves fit the model of linear hardening well. IC-D5 has the highest work hardening modulus (5.225 GPa); the work hardening modulus of IC-D8 is about 3.774 GPa. Besides, SC-D5 and SC-D6 own nearly the same values (3.449 and 3.470 GPa, respectively).
The compression curves for the ZT-M samples obtained by different methods.

The uniaxial compression statics of the different ZT-M samples at room temperature.
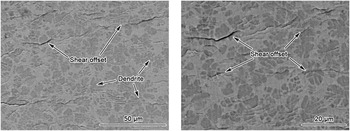
The SEM images of the deformed ZT-M samples in Fig. 9 will help to further understand how the preparations affect the mechanical properties. Both of the figures are made up of solid solutions and amorphous matrix. It is easy to find lots of steps distributed on the surface of the deformed samples. Actually, due to the interaction between the shear bands raised in the amorphous matrix and the sample surface, materials are shifted along the direction of shear stress, thus forming the steps.Reference Anand and Su30–Reference Greer, Cheng and Ma32 And the distribution and amount of the steps can reflect the behaviors of shear bands in the deformation to some degree.Reference Lee, Han, Park, Chattopadhyay, Kim and Kim33,Reference Dai and Bai34 At the same time, the morphology and distribution of the shear steps have a close relation with the solid solutions in the ZT-M samples. After further observations, we found that the shear steps are small, curving, some of them penetrate the solid solutions and others are deflected by the solid solutions without any interconnections among each other. With the help of the interaction between the solid solutions and the shear bands in the amorphous matrix, the plasticity of ZT-M is improved greatly.
The typical features on the surfaces of the ZT-M samples after the room temperature compression test.

From Refs. Reference Greer, Cheng and Ma32, Reference Bei, Xie and George35, and Reference Lei, Wei, Hu and Wang36, the shear bands generated from the amorphous matrix lead to the shear softening effects when the ZT-M sample is under stress. And this will help extend the shear bands and make the macromechanical response of ZT-M samples appear the trend of softening. By the time the shear bands approach the solid solutions, the stress field of the shearing front will affect the solid solutions. Then the β solid solutions will be transformed into α-type solid solutions under the complex stress field. For the α-type solid solution, it exhibits higher strength than the β solid solution. Then the shear bands will be effectively blocked by α solid solutions, leading to the great improvement in the plastic deformation of ZT-M. From the above analysis, we note that the interactions between the solid solutions and the shear bands are realized via the stress field. Hofmann et al.Reference Hofmann, Suh, Wiest, Duan, Lind, Demetriou and Johnson3 use the stress field of the crack tip in the fracture mechanics instead of the stress field in the front of the shear bands to study the problem. It points out that only when the dimension of the dendrites is similar to the characteristic dimension of the shear bands' front (such as the thickness and width of the shear bands), blockage can be effectively carried out. According to this, SC-D6 and IC-D8 that own the best mechanical properties have the rather suitable solid solutions, while the smaller solid solutions in SC-D5 and IC-D5 as well as the larger ones in MA all result in the different levels of performance degradation. This reminds us that during the rapid solidification preparation, we should lower down the cooling rates properly to make the solid solutions ripen to some degree. Thus it will help adjust the dimension of the solid solutions to the characteristic dimensions of the shear bands. And this way does finally improve the mechanical properties effectively.
On the other side, the work hardening of the ZT-M samples will also be greatly affected by the preparation methods. Actually after the martensite transformation, the strength of the solid solutions rises, which will lead to the hardening response of ZT-M samples. From Fig. 8, we find that the entire macromechanical response of ZT-M is actually the comprehensive results between the hardening effects of the inner solid solutions and the softening effects of the shear bands. The above analysis denotes that there exists a close relation between the work hardening of the solid solutions and the degree of the phase transformation of the alloys. Once the phase transformation of the solid solutions in the ZT-M alloys becomes popular, the hardening of the entire alloy will be obvious, just as IC-D5. Although with obvious hardening, the evident phase transformation of IC-D5 after loading will produce a large number of α-type solid solutions that have a weak ability of plastic deformation. Then, this leads to the restriction of the plasticity. It verifies that the work hardening of the ZT-M samples and the plastic deformation are the two mutual suppression factors. For IC-D8 and SC-D6, they exhibit not only good plasticity but also rather obvious work hardening. This proves that increasing the size of samples to slow down the cooling rate will optimize the dimension of solid solutions to improve plasticity and balance the relation between the work hardening and the shear softening effects to obtain good comprehensive properties.
IV. CONCLUSION
(1) The different preparation methods will influence the morphology of the solid solutions and the phase composition through the process of heating and cooling. Most importantly, the cooling rate will have a great impact on the degree of ripening and the microstructures of the solid solutions.
(2) The different preparation methods will make the amorphous matrix behave differently. The different process of heating will make a difference in the thermal stability of the amorphous matrix and its supercooled liquid, while the high cooling rate will inhibit the rate of crystallization of the amorphous.
(3) Different preparation methods will lead to the varied mechanical properties of ZT-M. Especially, the morphological evolution and the phase composition of the solid solutions will make a different contribution to the comprehensive properties.
ACKNOWLEDGMENTS
The authors gratefully acknowledge the financial support from National Basic Research Program of China (973 Program, Grant No. 2011CB606301), the National Natural Science Foundation of China (51434008), and The Program of “One Hundred Talented People” of The Chinese Academy of Sciences.