


INTRODUCTION
Escherichia coli O157 is an important zoonosis with global distribution. In Scotland, approximately 200 cases of E. coli O157 infection in humans are reported annually, although much larger outbreaks with significant fatalities have occurred. Cattle are well recognized to be a reservoir for the organism [Reference Borczyk, Karmali, Lior and Duncan1, Reference Gansheroff and O'Brien2], although the mechanisms by which E. coli O157 is maintained in the cattle population are still poorly understood. Studies of E. coli O157 prevalence in cattle typically find the shedding of the organism to be sporadic and of short duration [Reference Besser, Hancock, Pritchett, McRae, Rice and Tarr3–Reference Shere, Bartlett and Kaspar7]. Prevalences are generally low – usually reported to be <10% of animals carrying the pathogen [Reference Gansheroff and O'Brien2].
Typical features of the distribution of E. coli O157 shedding are revealed in two datasets available to this study. The first, a cross-sectional survey of cattle groups on 952 farms [Reference Synge and Paiba8], shows striking variability in the on-farm prevalence of E. coli O157 (see Fig. 1). On 78% of farms sampled no shedding of the organism was detected, but on a small proportion, ∼2%, very high prevalences of infection were found (with 90–100% of faecal pat samples being positive). A second study comprising pat samples taken from 32 farms at monthly intervals over a period of 1 year [Reference Synge, Chase-Topping and Hopkins9], shows substantial variation both between farms and between sampling events on the same farm (see Fig. 2): a few farms displayed high levels of shedding; some were never identified as positive for E. coli O157; while others had occasional, short-lived periods of shedding.
The distribution of prevalences of E. coli O157 in faecal pats sampled from finishing groups of beef cattle on 952 Scottish cattle farms.

Illustrative (six out of 32 shown) time series of prevalences of E. coli O157 in faecal pats sampled monthly during a longitudinal study of beef suckler cows on 32 Scottish farms.

The variability in E. coli O157 prevalence revealed by these data leads us to ask whether the farms displaying high levels of shedding have different epidemiological characteristics, or whether the on-farm transmission dynamics of E. coli O157 are such that these high prevalences are to be expected occasionally by chance. The potential sources of epidemiological heterogeneity in the cattle population are many-fold. Some farms may provide a better environment for transmission than others, for reasons depending on geographical location, farm type, management practices, and presence of other animals or wildlife [Reference Synge, Chase-Topping and Hopkins9]. Differing exposure to infection may result from variation in movement rates of livestock onto and from farms. Furthermore, some animals may be more persistent carriers of the organism or shed at higher levels than others – the so-called super-shedders [Reference Low, McKendrick and McKechnie10–Reference Naylor, Low and Besser13].
Although the cross-sectional data (Fig. 1) present a static picture of the on-farm prevalence, the longitudinal data (Fig. 2) clearly demonstrate that complex patterns of shedding underlie this distribution. By viewing the cross-sectional data as a snapshot of a dynamic process, the consequences of different sources of heterogeneity on the prevalence distribution can be explored by considering the effect of both animal-level and farm-level variability in rates of infection and recovery.
Specifically, we describe the on-farm transmission dynamics in terms of a susceptible–infected–susceptible (SIS) type model [Reference Anderson and May14]. The typically small cattle group sizes and frequent low prevalences of infection suggest that infection and recovery should properly be regarded as probabilistic events – we, therefore, employ a stochastic model of the transmission dynamics. Within this framework, we assume that infections arise in the susceptible population via two possible routes; first, transmission from other infected individuals, the probability of which increases with the number of infected individuals; and second, immigration of infection from some external source, which occurs with a constant probability – this could represent either the presence of an environmental reservoir, or the movement onto the farm of an already infected individual. Since there is no evidence to suggest that cattle acquire immunity to carriage of the pathogen we assume that all individuals recover to the susceptible state.
The stochastic on-farm dynamics lead to an equilibrium distribution of prevalences whose shape reflects the balance between immigration, transmission and recovery from infection. We make the assumption that the dynamics on different farms are not correlated; we may, therefore, regard the cross-sectional data as providing a sample from such an equilibrium prevalence distribution. Competing hypotheses for the likely source of heterogeneity are represented by allowing either between-farm variation in the parameters of the SIS model, or, in the case of heterogeneities at the level of the individual, multiple classes of susceptible and infected individuals. Analysis of the longitudinal data is similarly structured, but must additionally account for the fact that successive on-farm measurements are correlated.
Maximum-likelihood methods [Reference Barndorff-Nielson and Cox15] are used to fit models with different sources of heterogeneity to the observed data. This allows us to (i) obtain estimates for epidemiologically important parameters and (ii) discriminate formally between models and draw conclusions as to the likely sources of heterogeneity underpinning the observed distribution of prevalences of E. coli O157 on Scottish cattle farms.
METHODS
Data collection
The cross-sectional data comprise pat samples collected from finishing groups of beef cattle on 952 Scottish cattle farms between March 1998 and May 2000. The farms selected were a random sample from the population of target farms stratified with respect to region, production system and season at time of sampling [Reference Synge and Paiba8]. The longitudinal data comprise pat samples collected from a beef suckler cow group on each of 32 farms in the north of Scotland [Reference Synge, Chase-Topping and Hopkins9]. Each farm was visited approximately monthly and was sampled, with the exception of one, over a 12-month period. Fresh faecal material from pats were collected and examined for E. coli O157 strains using immunomagnetic separation (IMS) [Reference Chapman, Wright and Siddons16, Reference Foster, Hopkins and Gunn17].
The transmission model
Transmission dynamics within a group of cattle are represented using a stochastic, individual-based SIS Markovian model [Reference Anderson and May14]. Thus, within-group transmission of infection (occurring at a mean rate β), recovery from infection (which occurs at a mean rate σ), and immigration of infection into the group (which occurs at a mean rate λ) are probabilistic events. Intuitively we expect the probability of there being j infected individuals in the group at a given time to depend on: (i) the probability of recovery from the state with j+1 infecteds; (ii) the probability of transmission or immigration of infection into the state with j−1 infecteds; and (iii) the probability of remaining in the state with j infecteds. Combining these events we obtain the following:

with
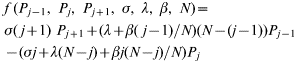
and P j(t) being the probability of there being j animals infected in a group of size N at a time t [for clarity we write P j rather than P j(t) in the equations]. Note that the formulation of the immigration term can be interpreted as either acquisition of infection from an environmental reservoir or a simplified representation of cattle movements whereby a susceptible individual is replaced by an infected individual. Equation (1) defines the null model against which models incorporating either farm-level or animal-level heterogeneity are compared. (Note that this equation is valid for 1<j<N; for j=0 or j=N the terms involving P j−1 and P j+1 respectively are omitted. An equivalent convention should be assumed where appropriate in subsequent sets of equations.)
Farm-level heterogeneity
Here, we allow for the possibility that either (i) transmission rates or (ii) immigration rates may vary between farms. In both cases we consider the straightforward scenario whereby a fraction of the farms are assumed to have a higher transmission or immigration rate than the others.
Farm-level variability in transmission rates
We assume that a fraction of farms, f FT, have a transmission rate which is r FT times higher than the transmission rate on the remaining farms. In mathematical terms, on a fraction of farms, f FT, the transmission dynamics are governed by the equations

and on the remaining fraction, 1−f FT, the transmission dynamics are governed by the equations

Farm-level variability in immigration rates
Analogous to the previous section we assume that a fraction of farms, f FI, have an immigration rate which is r FI times higher than the immigration rate on the remaining farms. Thus, on a fraction of farms, f FI, the transmission dynamics are governed by the equations

and on the remaining fraction, 1−f FI, the transmission dynamics are governed by the equations

Individual-level heterogeneity
Here, we allow for the possibility that either (i) transmission rates or (ii) infectious period may vary between animals. In this case, we need to incorporate multiple classes of susceptible and infected individuals into the model. Again, we consider the straightforward case whereby a fraction of individuals are assumed to have either higher transmission rates or a longer infectious period than others.
Individual-level variability in transmission rates
We assume that a random number of individuals within each farm group, if infected, will have a transmission rate which is r AT times higher than that of the other individuals. Over the population as a whole, we assume a mean fraction f AT, of individuals have this property. The number of high-level transmitters of infection, which we denote L, in a group of N individuals is assumed to follow a binomial distribution with probability of success f AT.
A group of N individuals is, therefore, subdivided into K normal individuals and L individuals which, when infected, will transmit infection at high levels. The number of currently infected individuals in these categories are denoted by k and l respectively. The probability, P kl(t), of there being k normal individuals infected and l high-level transmitters infected at time t is given by
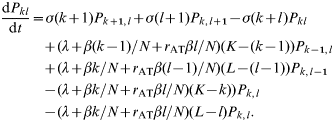
The probabilities P kl(t) are calculated separately, conditioning on different values of K and L. These probabilities are then weighted with respect to the binomial distribution for (K, L) and summed to give an overall distribution P′kl(t). The probability P j(t), of there being a total of j infecteds of either type in the group at time t is given by

Individual-level variation in infectious period
In this case we assume that a mean fraction f AI of individuals has an infectious period which is r AI times longer than that of the other individuals. As in the previous section these individuals are assumed to be distributed across the farm population according to a binomial distribution, leading to the following definition of transmission dynamics
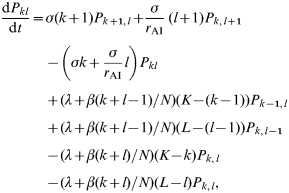
where P kl(t) is the probability of there being k (of K) normal individuals and l (of L) individuals with longer infectious periods infected at time t. The probability P j(t) of there being a total of j infecteds in the group at time t is defined as above (see ‘Individual-level variability in transmission rates’ section).
Free choice of transmission rate at farm level
In the case of the longitudinal analysis we will consider one further model in which each farm is allowed to have its own individual transmission rate. Thus, on each farm the dynamics are governed by dP j/dt=f(P j−1, P j, P j+1, σ, β i, λ, N), where β i is the transmission rate on farm i.
Model fitting and parameter estimation
The models are fitted to the data using the method of maximum likelihood [Reference Barndorff-Nielson and Cox15]. In the above sections on farm-level and individual-level heterogeneity we outline the calculation of the model likelihood for the cross-sectional and longitudinal data. The parameter space is searched systematically to identify those parameter combinations which maximize the likelihood (for mathematical convenience we equivalently minimize the negative log-likelihood).
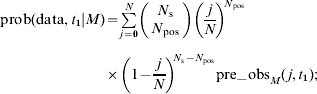
For both datasets, the method of sampling pats is assumed to be well approximated by sampling with replacements from the group; making the assumption that different animals do not produce different numbers of pats, the number of positive samples will follow a binomial distribution [Reference Clough, Clancy, O'Neill and French18]. Therefore, if j animals in a group of N are infected (giving a true prevalence of j/N), the probability of finding N pos positives in a sample of N s is given by

Likelihood calculation for cross-sectional data
The above sets of equations can be solved [analytically for equations (1), (2) and (3); numerically in the case of (4) and (5)] to obtain equilibrium values of the probabilities P j. We assume that the transmission dynamics on different farms are not correlated and can, therefore, regard each data point as a sample from such an equilibrium distribution.
The probability of obtaining the observed number of positive samples from a given group of animals is given by the sum of the probabilities of making that observation for all possible group prevalences. Thus, on farm i, with a group size N i, a sample size N Si, the probability P i of observing N posi positive samples is given by

where p Mj* is the equilibrium probability for model M of j of the N i animals being infected. The total likelihood of the data given the model is given by the product of the probabilities P i over all sampled farms, and the negative log-likelihood, L(M) given by the negative sum of the logged probabilities:

Likelihood calculation for longitudinal data
The longitudinal data comprise a time-series of observations from a group of animals on each of 32 farms. In this case, calculation of the likelihood of the observations made on a given farm must take into account that successive measurements are not statistically independent.
The first observation made on each farm is assumed to represent a sample from the equilibrium distribution of prevalences; the probability of this observation is calculated as defined above for the cross-sectional data. The probability of each successive observation is then calculated conditional on the probability of the previous observation. The product of these gives the likelihood of the sequence of observations made on that farm.
Specifically the method is as follows:
(i) the equilibrium distribution of prevalences, p Mj*, is taken to be the pre-observation distribution, pre_obsM(j, t 1), for the on-farm prevalence at time t=t 1;
(ii) the probability of the observation, prob(data, t 1|M) at time t=t 1 is given by

(iii) the post-observation distribution of prevalences, post_obsM(j, t 1), calculated using the observation made at time t=t 1 is given by
(iv) the post-observation distribution of prevalences at time t=t 1, post_obsM(j, t 1), defines an ‘initial’ state for the transmission dynamics model [equations (1)–(5) depending on model under consideration];
(v) the transmission model specifies how the distribution of prevalences evolves until time t=t 2 at which point it defines the pre-observation distribution for the distribution of prevalences at time t=t 2
(vi) the probability of the observation, prob(data, t 2|M), and the post-observation distribution, post_obsM(j, t 2), are calculated as above, and the process repeated for all subsequent sampling times
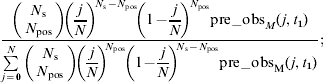

The likelihood of the sequence of observations made on a given farm given a model M is given by the product of the probabilities of the observations at times t=t 1, t 2, …, t num_visits, and the negative log-likelihood, L(M) by the negative sum of the logs of the probabilities:

The individual farm negative log-likelihoods are summed to give the total negative log-likelihood.
Confidence intervals and model selection
Confidence intervals for the parameter estimates in the cross-sectional analysis are calculated using the χ 2 approximation to the profile log-likelihood ratio [Reference Barndorff-Nielson and Cox15]. The likelihood ratio test is used to discriminate between competing nested models and the Akaike information criterion (AIC) for non-nested models. For models with equal numbers of parameters the method of AIC corresponds to making a direct comparison of the model likelihoods; models with lower negative log-likelihoods provide a better fit to the data.
For the longitudinal analysis, due to the small size of the dataset and correlation between samples at the within-farm stratum, these asymptotic methods are not considered appropriate; in this case confidence limits are obtained by non-parametric bootstrapping [Reference Efron and Tibshirani19] of the data at the farm level to provide a distribution of estimated parameters. In total, 1000 bootstrapped samples were obtained and the 2·5th and 97·5th percentiles of the resulting distribution for each of the fitted parameters provided by the confidence limits.
The distributional assumptions underlying the likelihood ratio test are invalid in the presence of small samples and within-farm correlation, therefore, we take a Monte Carlo-based approach to discriminate between the null and alternative models. An appropriate test statistic is selected to compare formally the observed data with that which would be expected under the null model. For inference, we would ideally simulate many realizations (often 1000) from the null model directly, and compute the value of the test statistic for each, ranking our observed test statistic amongst those from the simulated data to generate a P value corresponding to the test of alternative against null. As a consequence of computational expense, however, we simulate 32 (corresponding to the number of farms in the actual dataset) datasets under the null model, and then bootstrap from these datasets to re-create the appropriate null distribution. We select as our test statistic the difference between the log-likelihoods for the null and alternative models, draw 1000 bootstrap samples and recompute the test statistic for each; for a ranking of the statistic from the observed data as kth largest from n bootstrap sample-based test statistics, the P value is computed as k/(n+1).
The method of AIC is again used to compare likelihoods between the competing alternative models and draw conclusions as to which provide the better fit.
RESULTS
We analyse the cross-sectional and longitudinal data separately. In each case, maximum-likelihood methods are used to fit models with different sources of heterogeneity of the transmission dynamics to the observed data. The null model assumes that all farms and all animals are governed by the same underlying dynamics. Competing models allow that (i) the transmission and immigration rates may vary between farms or (ii) that the transmission rate and infectious period may vary between animals.
Analysis of cross-sectional data
As these data do not explicitly incorporate a time-scale, the fitting process can only provide relative estimates for parameters. In other words, we may choose the time-scale such that the recovery rate, σ, is equal to 1. Estimates of transmission and immigration rates are obtained relative to this time-scale.
We consider first the fit of the null model, which assumes no differences between farms or animals, to the observed data. Figure 3 compares the observed data with the predicted prevalence distribution from the null model generated using the maximum-likelihood estimates of the transmission rate ( =1·14, 95% CI 1·06–1·20), and immigration rate (
 =0·005, 95% CI 0·003–0·006). The null model explains a substantial proportion of the variation in the data, including the large number of zero prevalences, but does not succeed in reproducing the long tail of the distribution (Fig. 3b).
(a) A comparison of model fits to the cross-sectional data (□) for the (null) model containing no heterogeneities (▪) and the model containing animal level variation in transmission rates ( ) – the super-shedder model. (b) As panel (a) but with a restricted vertical axis to expose the tail of the distributions.

The fits of two alternative models which incorporate heterogeneities at the farm level are compared with the null model in Table 1. We use the likelihood ratio test to discriminate between the null model and the alternatives which incorporate variation in either immigration or transmission rates. Accordingly, a difference in the negative log-likelihoods >3·0 (corresponding to a difference of 6 in twice the negative log-likelihoods in accordance with the likelihood ratio test) between a two-parameter and four-parameter model is significant at the 95% level. It is clear, therefore, that both models which incorporate heterogeneities at the farm level produce highly significant improvements in the fit to the data over the null model. In both cases the estimated percentage of farms with higher immigration or transmission rates is of the order of 10%, but far greater heterogeneity in immigration rates (350 times) is required than in transmission rates (three times).
A comparison of maximum-likelihood parameter estimates (indicated by hats above characters) and model fits to the cross-sectional data for the null model and two alternative models incorporating farm-level variation in either the immigration rate or the transmission rate (95% confidence intervals are indicated within parentheses)

We also investigate the fits of two models which incorporate animal-level variation in either transmission rate or infectious period (which is taken to be the reciprocal of the recovery rate). Allowing a proportion of animals to have longer infectious periods succeeds in producing a marginally statistically significant improvement in model fit at the 95% level (see Table 2 for a comparison of the fit of the null model with the fits of models with animal-level variation). However, far more substantial improvements are found when a proportion of animals is allowed to have higher transmission rates. The maximum-likelihood estimates identify the best fit in this model as occurring when 4% of animals have transmission rates which are 50 times higher than those of normal individuals. Figure 3 compares the observed data with the predicted prevalence distribution from the model with animal-level variation in transmission rates. In this instance we can see that the model succeeds in both reproducing the high number of zero prevalences and the long tail of the distribution (see Fig. 3b).
A comparison of maximum-likelihood parameter estimates (indicated by hats above characters) and model fits to the cross-sectional data for models incorporating animal-level variation in either the infectious period or the transmission rate (95% confidence intervals are indicated within parentheses)

Applying AIC to discriminate between the (non-null) competing models in this case corresponds to a direct comparison of likelihoods, since all competing models have equal numbers of parameters. We, therefore, conclude that three models providing the best fit to the data are those incorporating (i) farm-level variation in immigration rate, (ii) farm-level variation in transmission rate or (iii) animal-level variation in transmission rate; all of which provide a substantially better fit than the model incorporating animal-level variation in the infectious period.
Analysis of longitudinal data
The three models which best fit the cross-sectional data – farm-level variation in immigration rate; farm-level variation in transmission rate; and animal-level variation in transmission rate – are now fitted to the longitudinal data. Since these data incorporate an explicit time-scale, we can also estimate the recovery rate (or equivalently the infectious period) and, therefore, obtain absolute values for the transmission and immigration rates.
We take our unit of time to be the sampling interval (1 month) and compare model fits for infectious periods of 0·5, 0·67 and 1·0 months. These numbers were chosen on the basis of exploratory investigations of parameter space to determine a range of infectious periods which incorporates the maximum-likelihood estimate for this parameter. For each of the models considered the best fit occurs for an infectious period of 0·67 (equivalent to a recovery rate of 1·5). In Table 3 we compare the fits of the models with farm-level variation in immigration and transmission rates with that of the null model. It can be seen that the confidence limits for the proportion of farms with a higher immigration rate include zero, so the model with heterogeneities in immigration rates cannot be regarded as providing a statistically significantly improved fit over the null model. Using the Monte Carlo test described in the Methods section (which in this case requires a difference in negative log-likelihoods of greater than 1·4 to reject the null model) the model with farm-level variation in transmission rates does provide a significant improvement in model fit.
A comparison of maximum-likelihood parameter estimates (indicated by hats above characters) and model fits to the longitudinal data for the null model and two alternative models incorporating farm-level variation in either the immigration rate or the transmission rate (95% confidence intervals are indicated within parentheses)

A further comparison is made with the model incorporating animal-level variation in transmission rates (Table 4). In this case, using the Monte Carlo test (which in this case requires a difference in negative log-likelihoods of >0·3 to reject the null model), the model with animal-level variation in transmission rates can be seen to provide a highly statistically significant increase in goodness of fit over the null model. The maximum-likelihood parameter estimates identify the best fit as occurring when 11% of animals have higher transmission rates and a relative transmissibility of 60.
Maximum-likelihood parameter estimates (indicated by hats above characters) and fit to the longitudinal data for the model incorporating animal-level variation in the transmission rate (95% confidence intervals are indicated within parentheses)
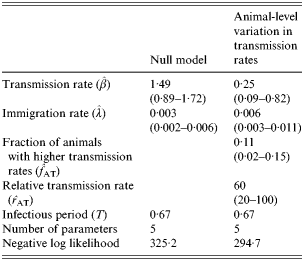
Using AIC to discriminate between the competing models, we conclude again that the model incorporating animal-level variation in transmission rates provides a substantially better fit to the data than either of the models incorporating farm-level heterogeneity. However, since these models only incorporate heterogeneity in a relatively simple manner a further comparison of the models with animal- or farm-level variation in transmission rates was conducted. In this case, rather than restricting the farm-level variation to the straightforward case in which some farms have high transmission rates and some have low transmission rates, we allowed the model to select transmission rates on a farm-by-farm basis (whilst fixing the immigration rate across farms as usual). Even with the additional degrees of freedom used in this final model (an extra 30 parameters which arises through fitting transmission rates on a farm-by-farm basis) the lowest model negative log-likelihood attained was 299·1, which is still substantially greater (i.e. a worse fit) than that achieved by the model containing animal-level variability in transmission rates (294·7) – see Table 4. We conclude, therefore, that the farm-level model is unable to provide as good a fit to the data as the animal-level model.
DISCUSSION
In this paper, we have used a combination of mathematical modelling and statistical techniques to identify sources of variation in the cattle population which might explain the strikingly overdispersed distribution of prevalences of E. coli O157 shedding on Scottish farms. Maximum-likelihood methods were used to (i) fit stochastic models of transmission dynamics to prevalence data (both cross-sectional and longitudinal), (ii) obtain estimates for epidemiologically important parameters and (iii) discriminate between models with alternative sources of heterogeneity.
Our results suggest that the pattern of prevalence across the Scottish cattle population can not be adequately explained by the inherent stochasticity in within-group infection dynamics (our null model). Although incorporating the probabilistic nature of infection and recovery events into the transmission dynamics model can explain much of the variability in the data (including the high proportion of farms with entirely negative samples) the null model does not reproduce the long tail of the distribution, corresponding to the few farms on which very high shedding prevalences were observed.
Incorporating variability in infection rates at either the farm or animal level produced significant improvements in the fit of the model to the cross-sectional data. At the farm level, the possibilities considered were that a proportion of the farms may have either higher transmission rates (representing higher levels of between-animal transmission) or higher immigration rates; the latter represents either higher rates of infection from some on-farm environmental reservoir, or higher rates of introduction of infection via movement onto the farm of an already shedding animal. In both cases, similar improvements in model fit were found, but the variation required in the immigration rate was much greater than that required in the on-farm transmission rates. This is because the correlated nature of outbreak events arising on a farm with high levels of animal-to-animal transmission means that such farms are more likely to exhibit high prevalences than farms where high prevalence could only be ‘built-up’ via infection events occurring independently from the environment or via animal movements into the group.
At the animal level, we considered the effect of between-animal variability in infectious period and transmission rates. Allowing a proportion of animals to have a much longer shedding period (whilst keeping the same transmission rate as the other animals) produced a relatively slight improvement in model fit, showing a continuing failure of the model to reproduce the long tail of the distribution. This occurs because although the individuals with long recovery periods will tend to produce higher numbers of infections than the normal individuals, these will tend to be spread out in time and consequently do not produce the occasional high prevalences observed in the data. As would be expected, estimates for the immigration rate were substantially lower for this model; this is because the long infectious period of a few individuals ensures that infection becomes extinct in the group far less frequently and consequently fewer re-introductions are required.
The best fit to the cross-sectional data is obtained when we allow a proportion of animals to have much higher transmission rates than the others. This model is able to capture the key features of the cross-sectional data – the high proportion of zero prevalences and the long tail of the distribution comprising a small number of farms with very high prevalences.
Conducting similar analyses of the longitudinal data sheds further light on the most likely source of heterogeneity. In this case, incorporating farm-level variation in immigration and transmission rates provides a relatively small increase in goodness of fit; this contrasts with the cross-sectional analysis for which models incorporating either farm-level or animal-level variability in transmission rates were able to provide substantial improvements in fit over the null model. However, allowing animal-level variation in transmission rates is able, as it did for the cross-sectional analysis, to produce highly significant improvements in model fit.
The failure of the longitudinal farm-level models to exhibit significant improvements in fit might have been due to the smaller dataset available in the longitudinal study. However, the significant improvement in fit seen for the model with animal-level variation in transmission rates suggests that the different nature of the information contained in the longitudinal data does favour the animal-level model.
Although the models we have investigated incorporate heterogeneities in a relatively simple fashion, these results suggest that the observed prevalence patterns are better explained by models containing between-animal heterogeneities than by those with between-farm variation. This conclusion is supported by the results of a further comparison between models containing farm- and animal-level variation in transmission rates; rather than restricting the farm-level variation to the straightforward case of having either a high or low transmission rate, we allowed the model to select transmission rates on a farm-by-farm basis. Even allowing these degrees of freedom in the variability at the farm level, this model did not succeed in fitting the longitudinal data as well as the model with animal-level variability in transmission rates. The longitudinal data allow a greater degree of discrimination between farm-level and animal-level models than the cross-sectional data because they contain information on the range of prevalences which can be achieved on a given farm. This within-farm variability cannot be adequately reproduced with models containing homogeneous on-farm dynamics, and is much better explained by the model containing between-animal heterogeneity.
Overall, the results from both the cross-sectional and longitudinal analyses therefore suggest that the highly overdispersed distribution of prevalences is best explained by within-farm rather than between-farm variability, and that the within-farm variability may arise as a result of animal-level variation in transmission rates.
In support of these conclusions there exists accumulating evidence that some cattle may indeed harbour and shed bacteria at higher levels than others (the so-called super-shedders [Reference Naylor, Low and Besser13]). Several recent studies [Reference Low, McKendrick and McKechnie10–Reference Ogden, MacRae and Strachan12] of slaughterhouse cattle have identified a proportion of animals as being high shedders of E. coli O157. In each case, the count data have been obtained on a basis of one sample per animal; in the absence of longitudinal data it is not possible to discriminate between the possibility that the range of bacterial counts observed is a consequence of observing different stages of carriage in the individual, rather than genuine between-animal variation in the ability to harbour and shed the organism. However, the success with which the super-shedder model describes the prevalence data lends supports to the former hypothesis – that the observed variation in counts is indicative of between, rather than within, animal variation in shedding levels.
Not only have these analyses allowed us to discriminate between alternative biological hypotheses, they also provide estimates of epidemiologically important parameters which have not been previously reported in the literature. The basic reproduction ratio, R 0, which is the average number of infections generated by one infected individual when introduced into a naive population, is given by the ratio of the transmission rate, β, and the recovery rate, σ. If R 0 is >1 then on average the number of new infections will grow, whereas if R 0 is <1 new infections will decline and a major outbreak cannot occur [Reference Anderson and May14]. For the model with animal-level variation in transmission rates, the cross-sectional analysis estimates the basic reproduction ratio for a normal animal to be 0·65 (0·60–0·75) which is below the threshold at which new infections tend to increase. However, the presence of super-shedding animals in the group, which are estimated to constitute on average 4% of the population and have transmission rates 50 times higher, can increase the average reproduction ratio to 1·9 (1·8–2·2) – well above the critical threshold. The longitudinal data give estimates for R 0 of 0·17 in a group of normal animals whereas in a mixed group containing high- and low-transmission-rate animals, the mean R 0=1·3. The difference in these estimates may be attributable to different shedding rates in finishing cattle and beef suckler cows. However, in both cases it is clear that control measures targeted at the individuals transmitting at high levels would reduce the within-group reproduction ratio to <1 and could, therefore, have a substantial impact on the prevalence of E. coli O157.
The longitudinal analysis additionally provides an estimate for the infectious period – of the order of 3 weeks. This figure is not inconsistent with figures reported for natural infections in the literature: two studies [Reference Besser, Hancock, Pritchett, McRae, Rice and Tarr3, Reference Lahti, Ruoho, Rantala, Hanninen and Honkanen-Buzalski20] both report typical shedding periods of <1 month whilst a third [Reference Rahn, Renwick and Johnson6] did not find any animals that were positive for more than 2 months. It should be noted, however, that our estimate does not necessarily correspond directly to the typical shedding period of an infected individual as we do not explicitly model free-living stages in the environment; instead our estimate may reflect the time-scale over which faeces from shedding animals pose a transmission risk to uninfected animals.
The extent of the cross-sectional prevalence data, which comprises samples from 952 farms, has enabled the use of a novel approach to the fitting of epidemiological models to these data; viewing the data as providing independent snapshots of a dynamic process enables us to fit a dynamic epidemiological model and estimate rate parameters from a static dataset. Our methodology also provides an alternative to standard techniques for analysing longitudinal data (e.g. [Reference Diggle, Heagerty, Liang and Zeger21]) and is one which provides a natural framework for estimating epidemiologically important parameters. Our approach contrasts with the standard risk factor analysis which seeks explanatory variables which explain trends and variation in the observed data. The benefit of underpinning the statistical analyses with a dynamic model is to allow quantification of the role of heterogeneities in epidemiologically important parameters such as transmission and recovery rates. Although beyond the scope of this paper, a combination of these approaches, which would relate risk factors to transmission dynamics, would provide a powerful tool for quantifying risk factors and the impact of control measures.
In summary, fitting dynamic epidemiological models to these datasets has provided estimates for parameters which have not been previously quantified in the literature: the shedding duration of infected cattle; cattle-to-cattle transmission rates and immigration rates of infection from external sources. Moreover, using this approach to discriminate between alternative biologically plausible models, has identified super-shedding cattle as a good candidate for the source of variation leading to the observed distribution of prevalences of E. coli O157 on Scottish farms. This provides a step towards both identifying suitable targets for control and quantifying the impact of control measures.
ACKNOWLEDGEMENTS
The work was conducted on the behalf of the Wellcome Trust-funded IPRAVE Consortium. L. M. is grateful to the Wellcome Trust for a Mathematical Biology Research Training Fellowship. I. J. M. was supported by SEERAD project BSS/028/99. Data collection was funded by Defra (formerly MAFF) and SEERAD. The authors thank Darren Shaw and Nils Toft for their helpful comments.



