1. INTRODUCTION
Global Navigation Satellite Systems (GNSSs) usage has become commonplace in modern society. A broad range of applications are derived from GNSS-based positioning, navigation and time synchronisation services. For instance, transportation, communication, energy distribution, finance, and countless other fields have built ever-increasing reliance on GNSS. However, these powerful systems have weaknesses in two main aspects (Jafarnia-Jahromi et al., Reference Jafarnia-Jahromi, Broumandan, Nielsen and Lachapelle2012). First, the GNSS signals are extremely weak, and can be jammed or spoofed by relatively low-power interference. Secondly, the structure of civil signals is publicly accessible, which leaves the system vulnerable to deliberate GNSS attacks. Therefore, the GNSS security issues require urgent consideration. A common GNSS interference approach is jamming. Although effective, the high-power feature of jamming makes it relatively easy to detect, and the jamming transmitter can often be located (Cetin et al., Reference Cetin, Thompson and Dempster2014). However, with spoofing, it can be possible to control victim receivers without being detected. Spoofing is a process of generating false GNSS signals using GNSS signal simulators or receiver-based spoofers to tamper with the reported position/velocity or time of a victim receiver (Jafarnia-Jahromi et al., Reference Jafarnia-Jahromi, Broumandan, Nielsen and Lachapelle2012). Warner and Johnson (Reference Warner and Johnson2002) achieved a spoofing attack on a truck using a GNSS signal simulator and in 2008, a research team led by Dr. Todd Humphreys developed a portable low-cost GNSS spoofer which successfully spoofed a super yacht in 2013 (Humphreys et al., Reference Humphreys, Ledvina, Psiaki, O'Hanlon and Kintner2008; Psiaki and Humphreys, Reference Psiaki and Humphreys2016a; Reference Psiaki and Humphreys2016b). In June 2017, ship spoofing incidents in the Black Sea received much attention (Jones, Reference Jones2017). Spoofing threats are no longer just theoretical but have become a practical concern.
To detect such spoofing threats, a method based on consistency checks of both Doppler and pseudorange fixes has been proposed in our previous work (Chu et al., Reference Chu, Li, Wen, Wu and Lu2017). This method is position-oriented. It utilises the inconsistency of positioning fixes between the Doppler positioning method and the pseudorange-based method under spoofing scenarios. The essence of the inconsistency is that the spoofing process would destroy the self-consistency of the Doppler and the pseudorange information. A typical spoofer would only manipulate the positioning-based information such as pseudoranges and time instead of Doppler shifts. For example, given that the spoofer and the receiver are static and close, the Doppler positioning results would be near the real receiver position as the Doppler frequencies measured and replayed by the spoofer are about the same as the authentic Doppler frequencies in the nearby receiver. However, the pseudorange positioning fixes could be kilometres away from the real position for the reason that the replay delay causes incorrect measured pseudoranges. Moreover, if a sophisticated spoofer intends to manipulate the Doppler information, they will struggle to reconcile all the Doppler and pseudorange information. Therefore, the spoofed pseudorange-based positioning fixes are probably distant from spoofed Doppler-based positioning fixes, although they are both spoofed away from authentic values. The feasibility of this spoofing detection method in various scenarios has been analysed and validated in detail, which can be particularly seen in our previous work (Chu et al., Reference Chu, Li, Wen, Wu and Lu2017). Nonetheless, a statistical model and performance evaluation of the proposed method has not been completed. Also, the accuracy of Doppler positioning is considerably lower compared with the pseudorange positioning method, which degrades the performance of the spoofing detection method. In this paper, a statistical detection model based on a Generalised Likelihood Ratio Test (GLRT) will be established to help assess the performance of the spoofing detection method theoretically. A practical test statistic and a detection threshold are derived from the model and then applied in a consistency check module to implement the detection approach. In addition, a Doppler smoothing technique based on a modified α -filter is introduced to efficiently increase the accuracy of the Doppler positioning method, thus improving the detection performance.
The paper is organised as follows. In Section 2, we briefly review the basics of the Doppler positioning technique and the Doppler positioning-based spoofing detection method. Section 3 formulates the GLRT based statistical detection model for the spoofing detection method. In Section 4, the theoretical performance is analysed, and a Doppler smoothing technique is proposed to improve the Doppler positioning accuracy and spoofing detection performance. Experimental results are shown in Section 5, which validates the effectiveness of the Doppler smoothing technique and the developed detection model.
2. REVIEW OF THE SPOOFING DETECTION SCHEME BASED ON DOPPLER POSITIONING
2.1. Doppler positioning in GNSS
The Doppler positioning technique was first applied in Transit, the first-generation GNSS (Guier and Weiffenbach, Reference Guier and Weiffenbach1960). The Doppler measurement used in the system is known as integrated Doppler, since it should be integrated over a period of time. However, the second-generation GNSS, the Global Positioning System (GPS), exploits pseudorange measurements instead of Doppler to determine a position. The term “traditional positioning method” refers to the pseudorange measurements-based positioning method in this paper. It has a better positioning accuracy and better generality of dynamics compared with the Doppler positioning technique. Recently, researchers have modified the Doppler method to be reapplied in GNSS to improve robustness (Lehtinen, Reference Lehtinen2002; Othieno, Reference Othieno2012), accuracy (Chen et al., Reference Chen, Wang, Chiang and Chang2014; Li et al., Reference Li, Zhong and Zhao2011; Wang and Xu, Reference Wang and Xu2011), and positioning speed (Jing et al., Reference Jing, Xu, Yong and Sun2015) of the system. The difference between the Doppler positioning done by Transit and that used by more modern GNSSs is that the former positioning method utilises one satellite's Doppler information at different times, while the latter utilises the Doppler shifts of different satellites at the same time.
The principle of Doppler positioning in a modern GNSS is that the measured pseudorange rates are theoretically quite close to the estimated pseudorange rates (Lehtinen, Reference Lehtinen2002). The pseudorange rate is defined as the change of the pseudorange from satellite to receiver within a unit of time. To determine the measured pseudorange rates, carrier Doppler shifts need to be extracted from carrier tracking loops; to calculate the estimated pseudorange rates, satellite positions/velocities and an estimated initial receiver's position/velocity (usually set to zero) are needed. Then, an iterative least squares method can update the estimated receiver's position/velocity by making the residuals of the measured pseudorange rates and the estimated ones sufficiently small. When the estimated position is equal to the actual position of the receiver, in an ideal situation, residuals converge to zero. For the detailed mathematical model of GNSS based Doppler positioning, readers can refer to Equations (1) to (9) of our previous paper (Chu et al., Reference Chu, Li, Wen, Wu and Lu2017).
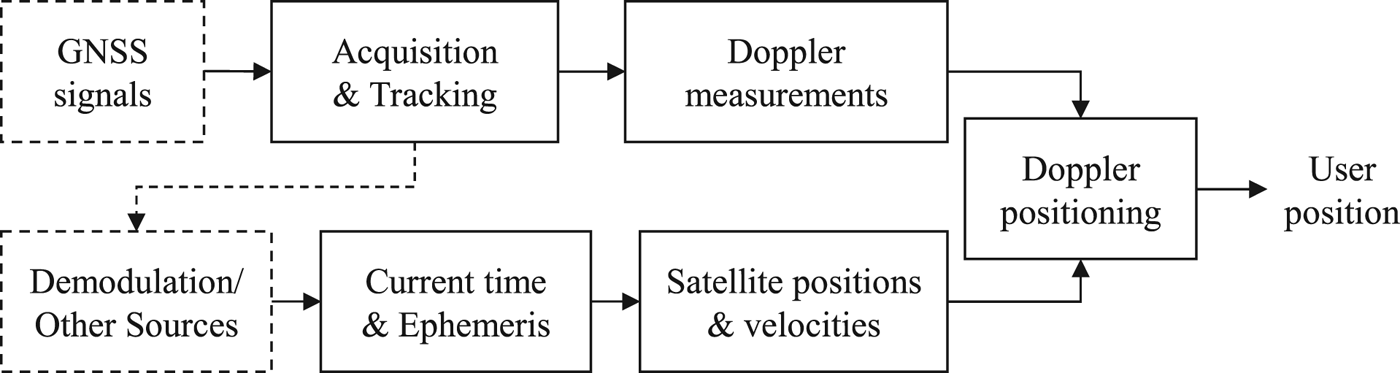
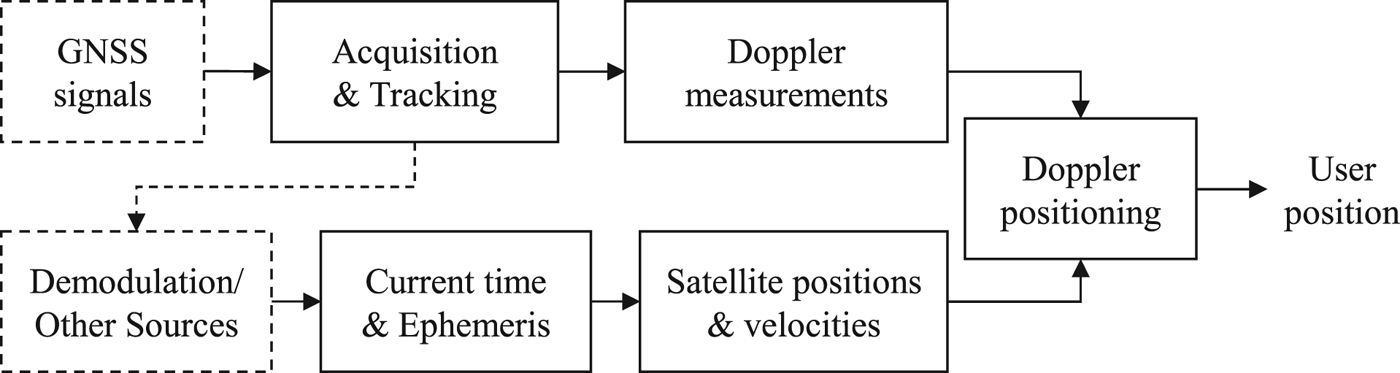
The architecture of a Doppler positioning-based receiver is illustrated in Figure 1. As shown in the block diagram, Doppler measurements and satellite positions and velocities are the inputs of a Doppler positioning algorithm. Unlike the traditional positioning method, the Doppler positioning method cannot offer local time information. On the plus side, the demodulation module can be simplified provided that an ephemeris with the current time is accessible from other sources (for example, internet or cellular network), and this is known as assisted GNSS (Othieno, Reference Othieno2012). Figure 1 indicates that a Doppler-based receiver or a dual-function (Doppler and traditional methods-based) receiver could be easily achieved by simply modifying the software level of a traditional receiver, because the acquisition, tracking, and demodulation modules of a Doppler-based receiver are almost the same as the traditional ones, and only the positioning algorithm module is different. Therefore, a Doppler-based receiver could be achieved by simple transformation of an off-the-shelf product.
The architecture of a Doppler positioning-based receiver.
2.2. Consistency check approach
A spoofing detection method based on a consistency check of the Doppler positioning fixes and the traditional ones was proposed in our earlier work (Chu et al., Reference Chu, Li, Wen, Wu and Lu2017). The viability of the method lies in the fact that an actual spoofer will find it exceptionally difficult to coordinate the pseudorange measurements and the Doppler ones so that a victim receiver derives the spoofed position by the two methods at the same location. By checking the consistency of the Doppler positioning fixes and the traditional ones, a receiver could detect spoofing threats.
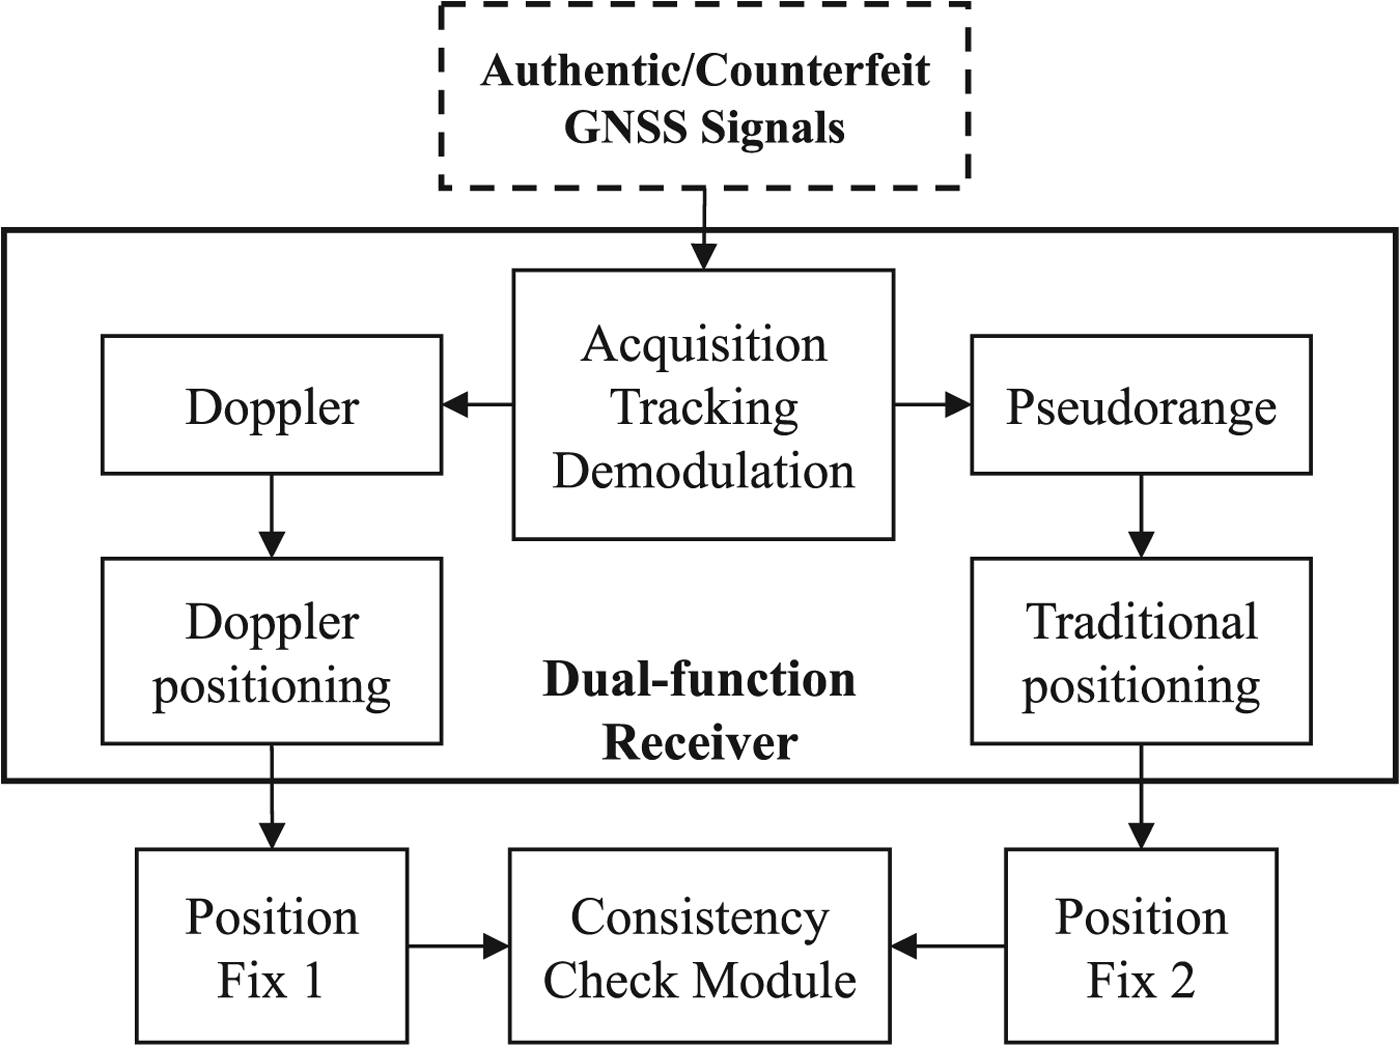
Figure 2 illustrates the consistency check scheme in a modified dual-function receiver. In non-spoofing scenarios, only authentic GNSS signals are received and hence pseudoranges and Doppler shifts are consistent. Therefore, position fix 1 and position fix 2 would be theoretically the same. Then the consistency check module would normally output the position fix 1 as the reported receiver's position for its higher accuracy compared with position fix 2. However, the two kinds of measurements are probably no longer consistent with the presence of spoofing attacks. Thus, a false position fix 1 is likely to be distant from a false position fix 2. In this case, the consistency check module would detect such an abnormality and alarm the user that spoofing has been detected.
The consistency check approach based on a dual-function receiver.

The feasibility of the spoofing detection method has been validated by replay spoofing tests on both software-defined and hardware-based receivers (Chu et al., Reference Chu, Li, Wen, Wu and Lu2017). However, a detailed model for a real consistency check module and a theoretical performance evaluation for such a detection method are still to be completed. In the next section, a GLRT-based statistical detection model is employed to achieve this.
3. DETECTION MODEL
3.1. GLRT-based statistical detection model
An intuitive test metric of a detection model is the Euclidean distance between the Doppler positioning fixes and the traditional ones which is formulated as:
 $$s=\vert {\bf s}^d-{\bf s}^t\vert$$
where s is the Euclidean distance between the Doppler and the traditional positioning fixes, sd is the Doppler positioning result vector, st is the traditional positioning result vector and |•| is the two-norm for the vector.
The test model is formulated as:
 $$\eqalign{{\rm {\cal H}}_0:s[k] & = n[k],k = 0,1, \cdots ,N - 1 \cr {\rm {\cal H}}_1:s[k] &= d + n[k],k = 0,1, \cdots ,N - 1}$$
where  ${\rm {\cal H}}_{0}$ is the hypothesis on the absence of spoofing signals,
 ${\rm {\cal H}}_{1}$ is the hypothesis on the existence of spoofing signals, s[k] is the distance between the Doppler and the traditional positioning fixes at the sampled time k, N is the total number of test points, d is the spoofing-caused distance which is non-negative and n[k] is assumed to be Additive White Gaussian Noise (AGWN), that is,
 $n\lsqb k\rsqb \sim {\rm {\cal N}}\lpar \mu\comma \; \sigma^{2}\rpar $.
Three noteworthy points need to be declared for the test model. First, positioning fixes sd and st are normally considered as Gaussian distributed variables. So, the strict assumption for n[k], as the two-norm of the Gaussian distribution, should be a Rayleigh distribution in normal situations and a Rice distribution under spoofing (Simon, Reference Simon2006). However, in practice, this noise is caused by many factors which could be approximated as Gaussian noise. The rationality of this approximation will be verified in the simulation in Section 3.3. Secondly, μ denotes the distance between the Doppler and the traditional positioning fixes in a non-spoofing scenario, which is regarded as prior information in this paper. Thirdly, premised on a short total test time, d could be regarded as constant during testing.
Based on the Neyman-Pearson (NP) lemma and generalised likelihood ratio criterion, when GLRT L G(bf s) satisfies:
 $$L_G({\bi s}) = \displaystyle{{p({\bi s};\hat d,\hat \sigma _1^2 ,{\rm {\cal H}}_1)} \over {p({\bi s};\hat \sigma _0^2 ,{\rm {\cal H}}_0)}} > \gamma$$
the hypothesis  ${\rm {\cal H}}_{1}$ is accepted, where
 $p\lpar {\bf s}\semicolon \; {\rm {\cal H}}_{i}\rpar $ is the Probability Density Function (PDF) of data vector s under the hypothesis
 ${\rm {\cal H}}_{i}$, d̂ is the Maximum Likelihood Estimate (MLE) of d under
 ${\rm {\cal H}}_{1}$,
 $\hat{\sigma}_{i}^{2}$ is the MLE of σ2 under
 ${\rm {\cal H}}_{i}$ and γ is the threshold for the test.
The MLEs of d̂ and  $\hat{\sigma}_{i}^{2}$ are solved and applied to the inequality Equation (3). After identical transformation, the explicit form of the new test statistic T(s) can be obtained as:
 $$T({\bi s}) = (N - 1)\cdot \displaystyle{{{\left( {\displaystyle{{\sum\nolimits_{i = 0}^{N - 1} {s[i]} } \over N} - \mu } \right)}^2} \over {\displaystyle{{{\sum\nolimits_{k = 0}^{N - 1} {\left( {s[k] - \displaystyle{{\sum\nolimits_{i = 0}^{N - 1} {s[i]} } \over N}} \right)} }^2} \over N}}} > {\gamma }^{\prime}$$
where μ is the distance between the Doppler and the traditional positioning fixes in a non-spoofing scenario.
Thus the receiver would believe that spoofing attacks exist when the test statistic T(s) is larger than the threshold γ′. According to Kay (Reference Kay1998), T(s) conforms to an F-distribution:
 $$\eqalign{& {\rm {\cal H}}_0:T({\bi s})\sim F_{1,\,N - 1} \cr & {\rm {\cal H}}_1:T({\bi s})\sim{F^{\prime}}_{1,\,N - 1}(\lambda )}$$
where λ = Nd 2/σ 2 is the non-central parameter.
False alarm probability P FA is determined by:
 $$P_{FA} = \vint_{T({\bi s}) > {\gamma }^{\prime}} p ({\bi s};{\rm {\cal H}}_0)d{\bi s}$$
With Equations (5) and (6), γ′ then can be expressed explicitly as:
 $${\gamma }^{\prime} = Q_{F_{1,\;N - 1}}^{ - 1} (P_{FA})$$
where Q(·) is the right tail probability function. The benefit of the GLRT method is that the threshold γ ′ can be easily pre-calculated with only the knowledge of the false alarm probability P FA and the test points N. This feature guarantees the practicability and brevity of the proposed detection method.
Furthermore, the detection probability P D is defined as:
 $$P_D = \vint_{T({\bi s}) > {\gamma }^{\prime}} {p({\bi s};{\rm {\cal H}}_1)} d{\bi s}$$
which can be derived as a function of P FA by:
 $$P_D = Q_{{{F}^{\prime}}_{1,\;N - 1}(\lambda )}(Q_{F_{1,\;N - 1}}^{ - 1} (P_{FA}))$$
From Equation (9), we can draw the theoretical curves of Receiver Operating Characteristics (ROC) and evaluate the theoretical performance of the detection model.
3.2. Theoretical performance analysis of GLRT-based statistical detection model
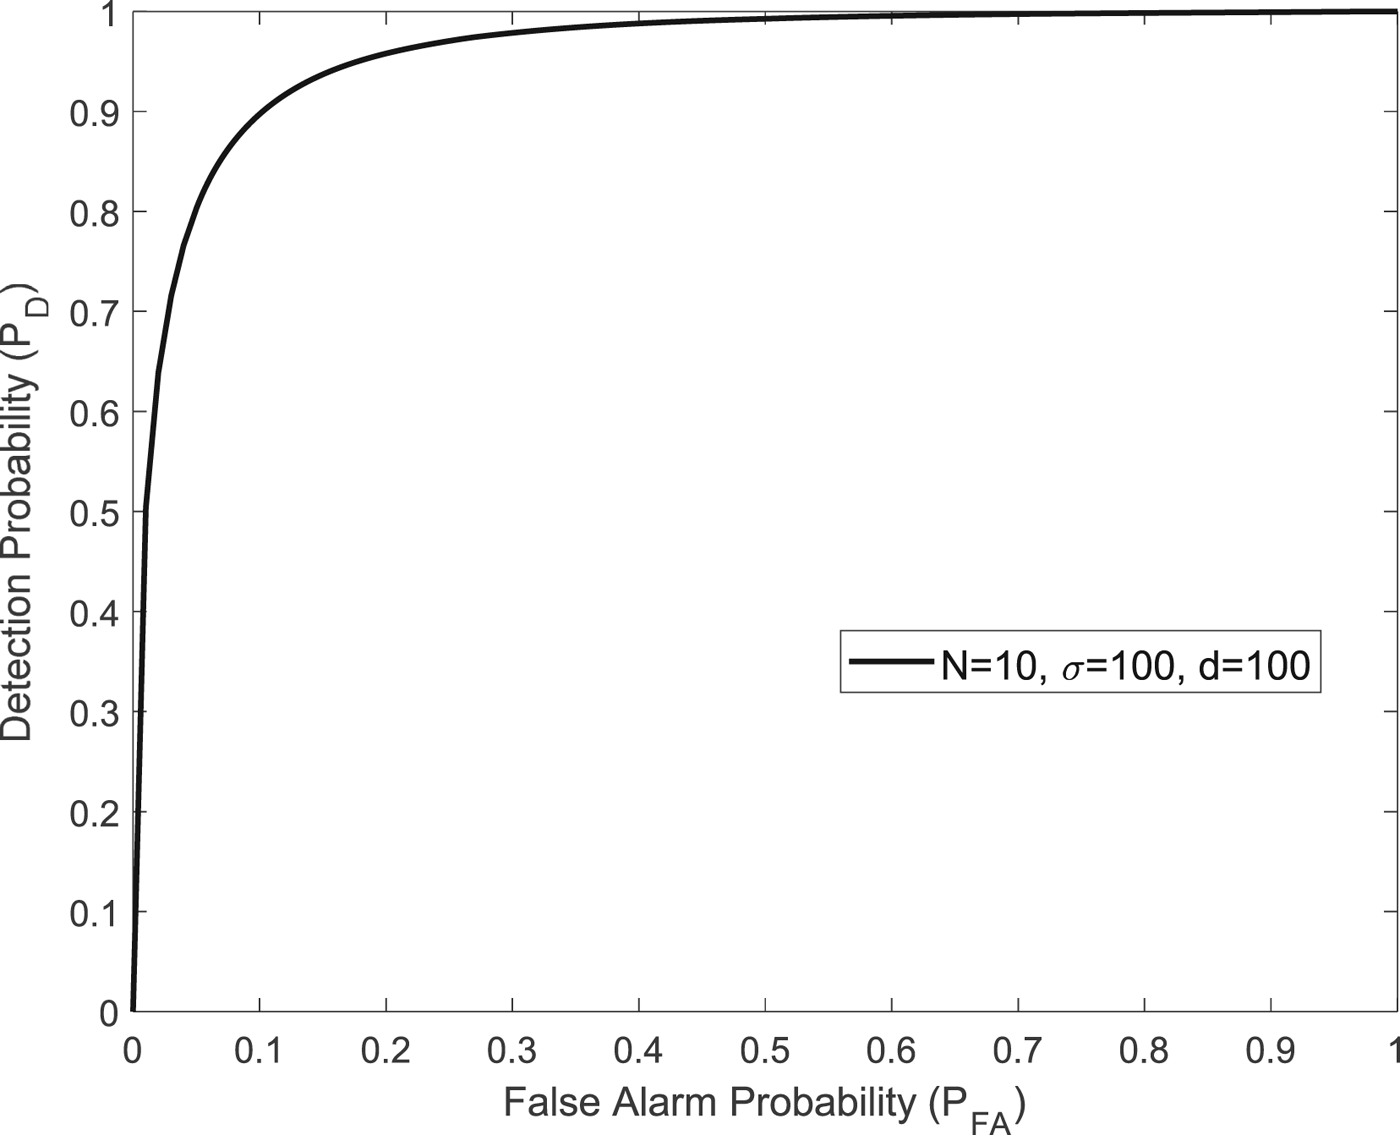
A theoretical simulation based on the proposed detection model was conducted to visualise the performance. Figure 3 shows the theoretical ROC. Parameter settings are shown within Figure 3: N is the total number of test points; σ is the standard deviation of the distance between the traditional and Doppler positioning fixes and d is the spoofing-caused distance between these two methods. The parameter σ is set to 100 metres. This is because simulations and experiments in Figures 8, 10 and 14 demonstrate that σ is mainly determined by Doppler positioning accuracy and after the Doppler smoothing technique, the standard deviation of Doppler positioning results can be improved by up to 100 metres. Therefore, the parameter σ is set to a 100 metre scale.
Theoretical receiver operating characteristic curves.

As can be seen, the detection probability of the proposed spoofing detection method can reach to close to 0.9, given that the false alarm probability is 0.1. This implies that, in theory, a typical dual-function receiver could reliably detect a spoofing in this particular scenario.
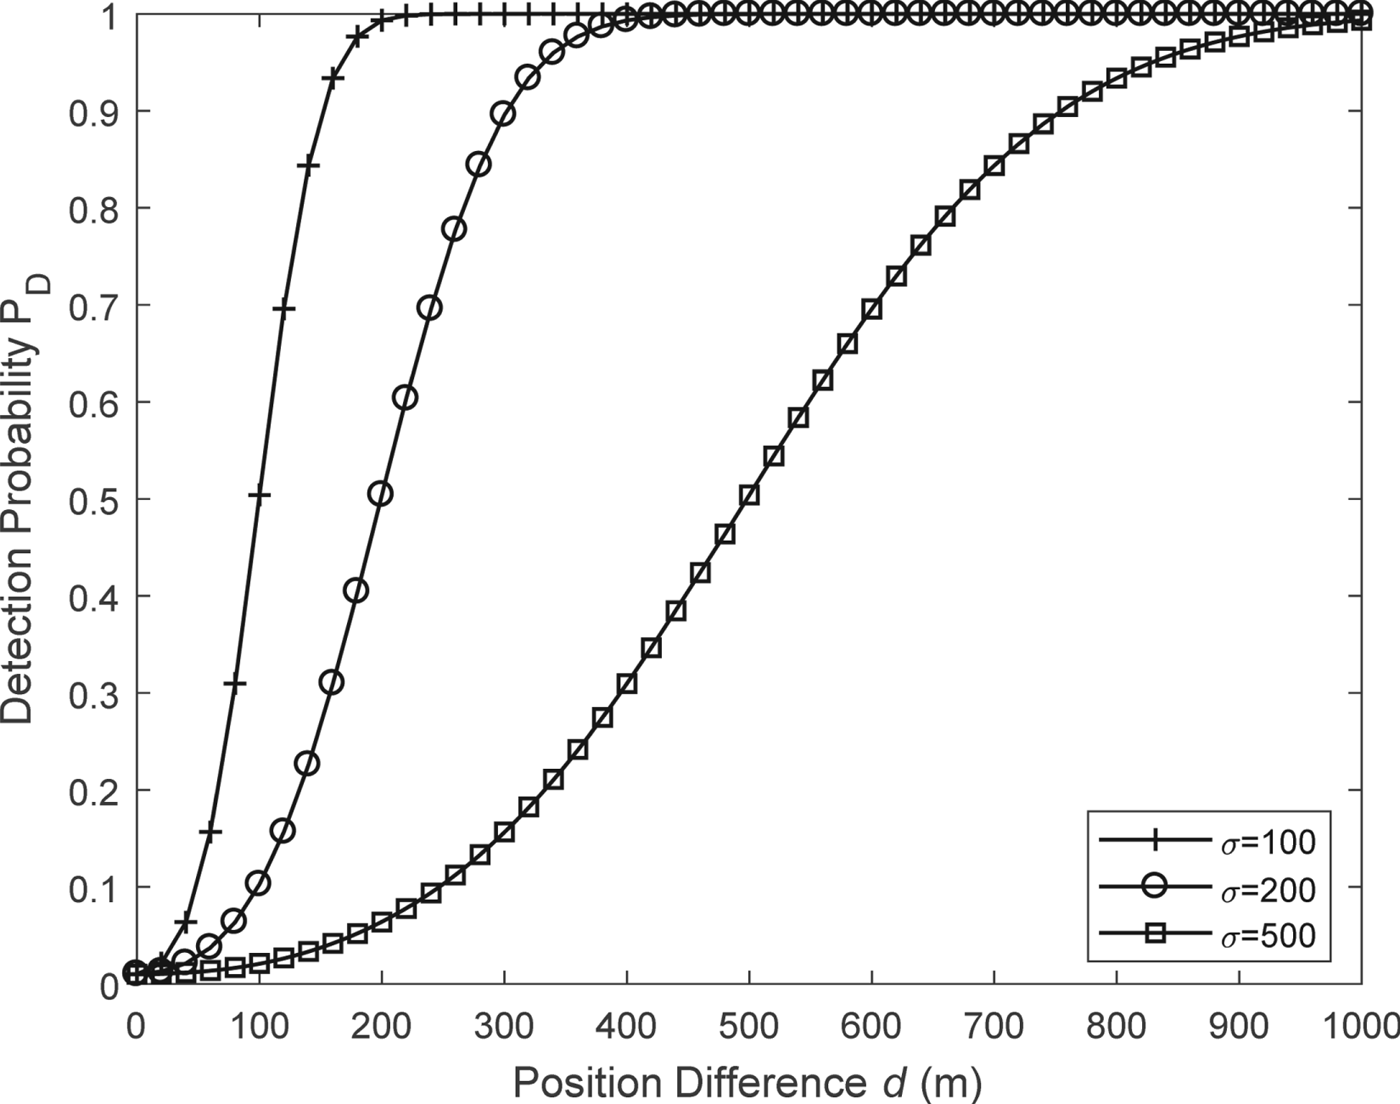
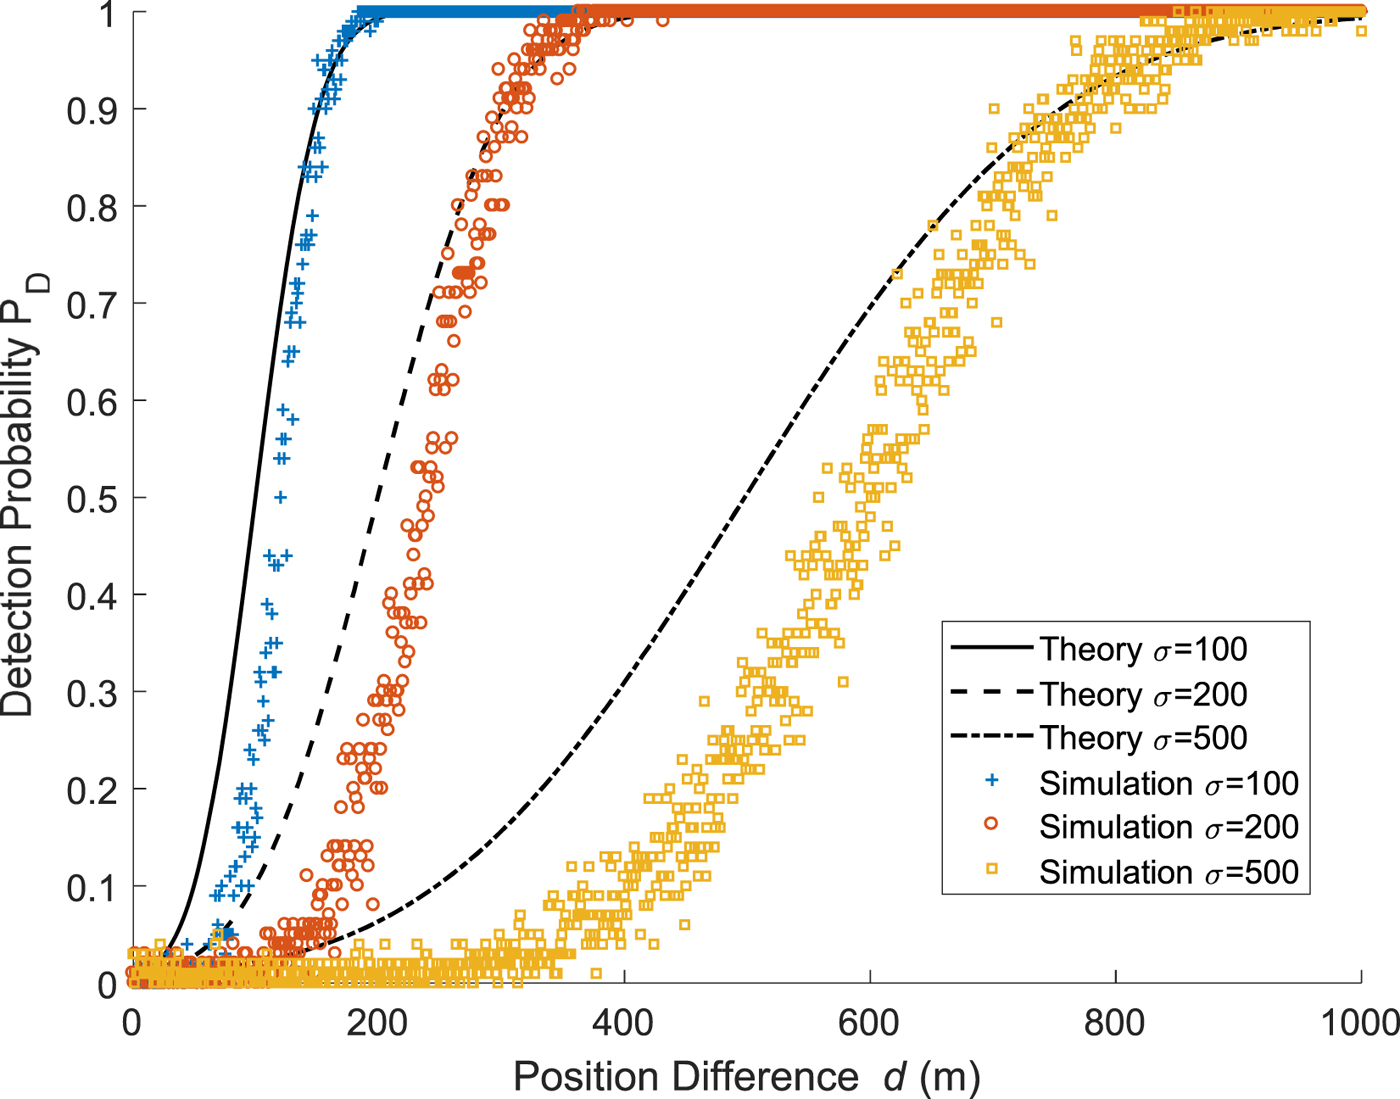
The effects of the standard deviation and the spoofing-caused distance d on the spoofing detection performance are demonstrated in Figure 4. On one hand, for a certain standard deviation, the spoofing is more likely to be detected when the distance between two positioning methods is great. On the other hand, if the spoofing-caused distance is fixed in a certain spoofing scenario, the dual-function receiver with a smaller σ can perform better in a spoofing detection test. The standard deviation σ is related to the positioning accuracy of the traditional and the Doppler positioning methods. Considering that the Doppler positioning method generally has a worse positioning accuracy, usually deviated from hundreds of metres to thousands of metres, the standard deviation of Doppler positioning fixes is the dominant factor of the parameter σ. Therefore, a higher positioning accuracy of the Doppler method means a better detection performance. This conclusion will be further verified in the next simulation. Meanwhile, a higher positioning accuracy of the Doppler method leads to concerns about a Doppler smoothing technique.
The theoretical effects of the standard deviation σ and the spoofing-caused distance d on the spoofing detection performance (P FA = 0.01, N = 10).

3.3. Simulated performance analysis of GLRT-based statistical detection model
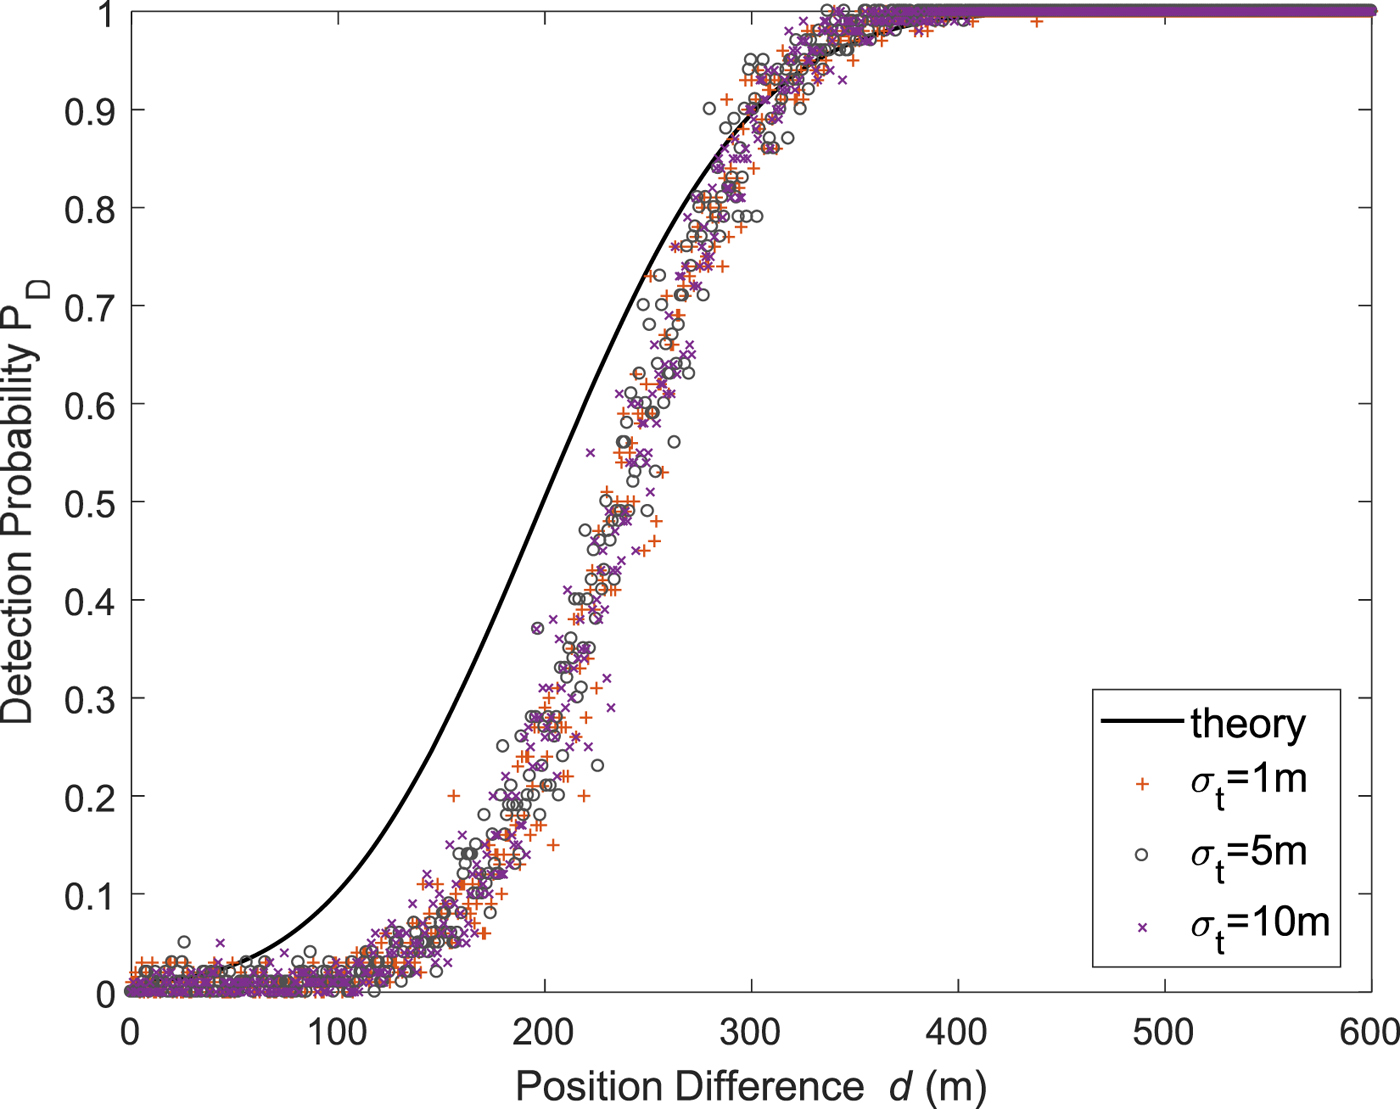
To validate the GLRT-based statistical detection model in Section 3.1 and the theoretical performance figure mentioned in Section 3.2, a 1,000 repetition Monte Carlo simulation was conducted. We generated Gaussian distributed positioning fixes with σd for the Doppler positioning method and with σt for the traditional positioning method. We suggest that the standard deviation σ mainly depends on σd instead of σt. Figure 5 proves this inference. Here the standard deviation σ of the theory curve is 200 metres (that is, σ = 200). In the simulation, the Doppler positioning standard deviation is set to 200 metres (σ d = 200), while the traditional positioning standard deviations are set to 1, 5 and 10 metres, respectively. As Figure 5 shows, the traditional positioning standard deviation barely affects the detection performance and the standard deviation σ can be approximated by Doppler positioning accuracy σd. In the next simulations, σt is set to 10 metres by default and simulated σ represents the Doppler positioning standard deviation.
The simulated effects of the traditional positioning standard deviation σ t on the spoofing detection performance (P FA = 0.01, N = 10, σ d = 200).

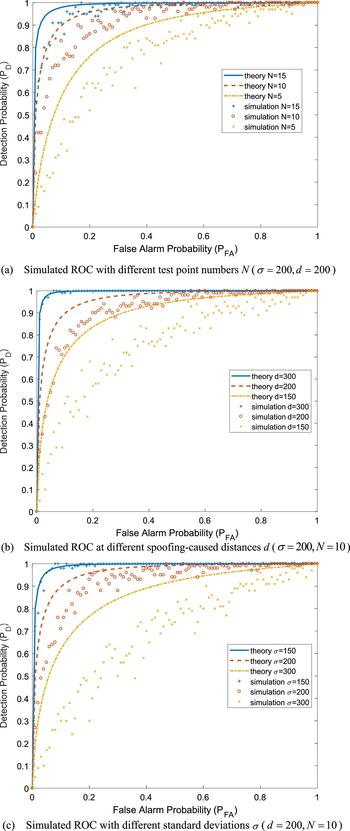
In this simulation, three parameters which influence the detection performance are specifically considered: test point number N, spoofing-caused distance d and positioning standard deviation σ. Simulated results of the ROC are shown in Figure 6, where the step is 0.01. We can draw two conclusions from the results. One is that the simulated ROC curve generally fits the theory, which validates that the proposed GLRT-based statistical detection model generally applies to actual situations and the Gaussian noise assumption is reasonable. The other is that the simulated ROC curve is worse than the theoretical curve especially when the ROC curve moves to the diagonal, which means that there is performance regression in the simulation and it becomes worse in harsh detection environments. Additionally, Figure 6 shows that a better detection performance depends on larger test point number N, more significant spoofing caused distance d and smaller positioning standard deviation σ.
Simulated ROC under three varying parameters.

In practice, the false alarm probability P FA and test point number N are usually pre-set. Considering detection performance and time cost, P FA is set to 0.01 and N is 10. Under these settings, Figure 7 shows how the Doppler positioning standard deviation and the spoofing-caused distance determine the spoofing detection performance in detail. In practical circumstances, defenders cannot control the spoofing-caused distance; so, decreasing the Doppler positioning standard deviation is an important approach in improving the detection performance.
The simulated effects of the standard deviation σ and the spoofing-caused distance d on the spoofing detection performance (P FA = 0.01, N = 10).

4. DOPPLER SMOOTHING TECHNIQUE
Usually, typical accuracy of a Doppler positioning-based receiver is in the order of hundreds of metres to several kilometres, hence a better accuracy is essential for better detection performance. For such a purpose, a post-processing technique, which averages the positioning fixes, has been proposed in our previous work (Chu et al., Reference Chu, Li, Wen, Wu and Lu2017). However, this technique necessitates waiting for sufficient positioning points, which consumes a large amount of time. On the other hand, the variance of Doppler measurements could determine the accuracy of the Doppler positioning results, owing to the fact that the Doppler measurements are the straight inputs to the positioning algorithm. One could thereby improve the accuracy of the Doppler positioning method by smoothing the Doppler measurements. One merit of the Doppler smoothing method is that it is time-saving. For the real-time GNSS receiver used in this paper, the positioning interval is one second while intermediate measurements such as Doppler measurements are updated every millisecond. This means it could keep updating positioning results every one second with hundreds of Doppler points smoothed.
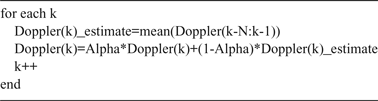
A modified α -filter is adopted to smooth the Doppler measurements in real-time. Table 1 presents the core algorithm in pseudo-code. In the table, Alpha denotes the parameter α, which should be set within the range 0 to 1 and N is the number of Doppler points to be averaged, which is set to 100 in this paper. As the algorithm indicates, the Doppler at the current moment is co-determined by the measured current Doppler and the estimated Doppler (namely, the averaged previous Doppler).
Algorithm for a modified α -filter.

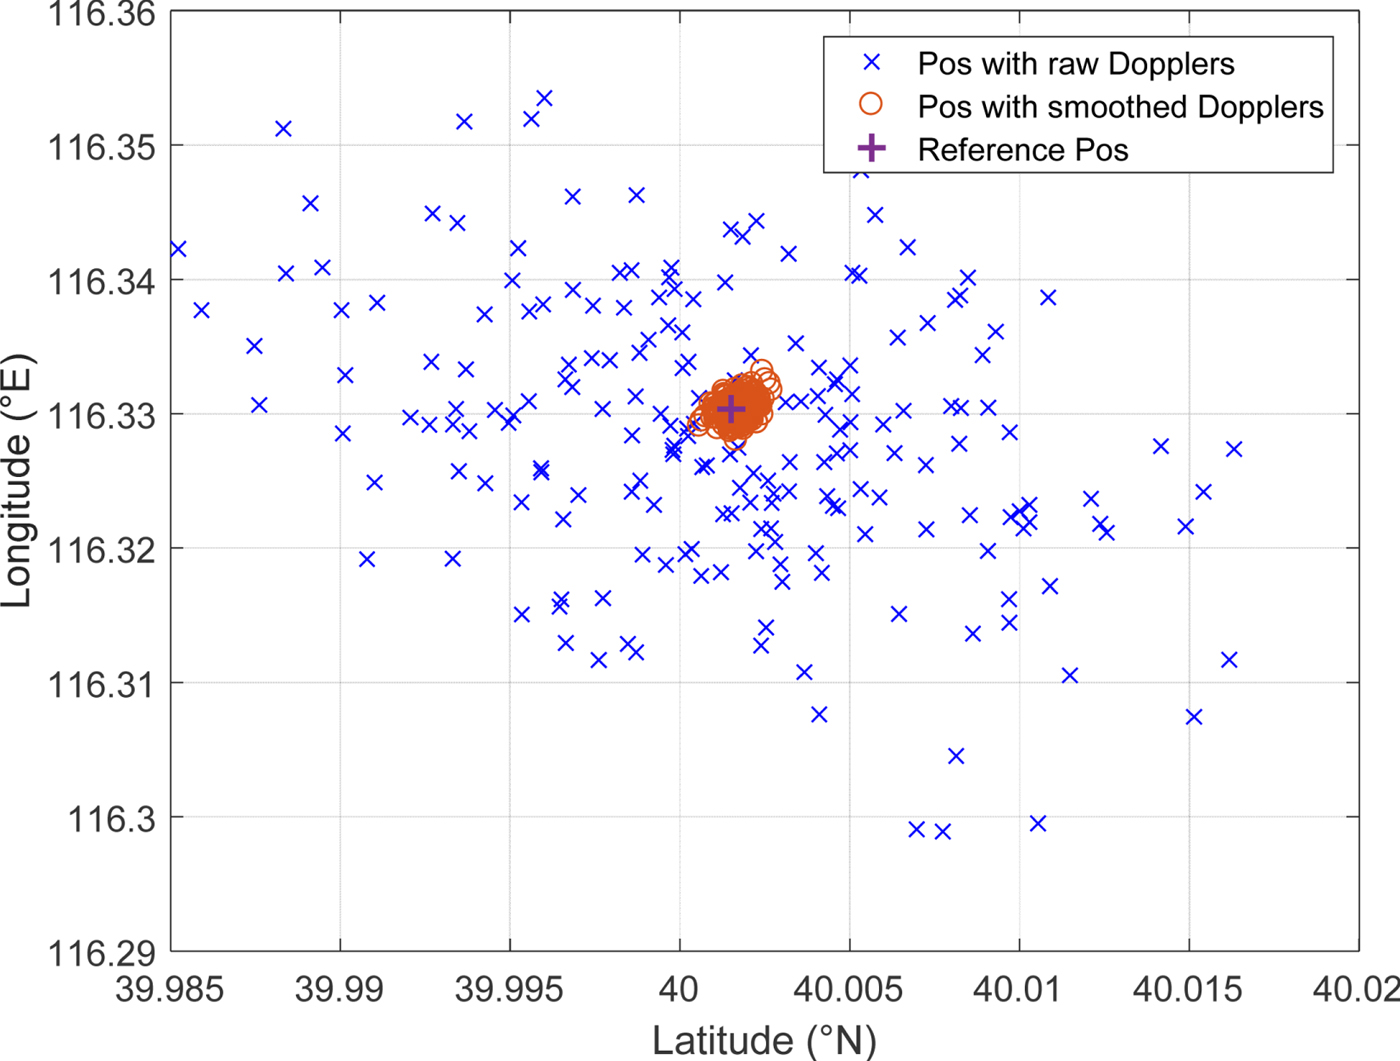
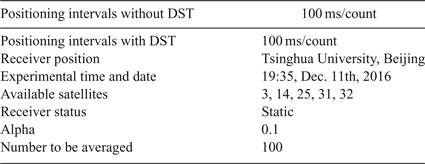
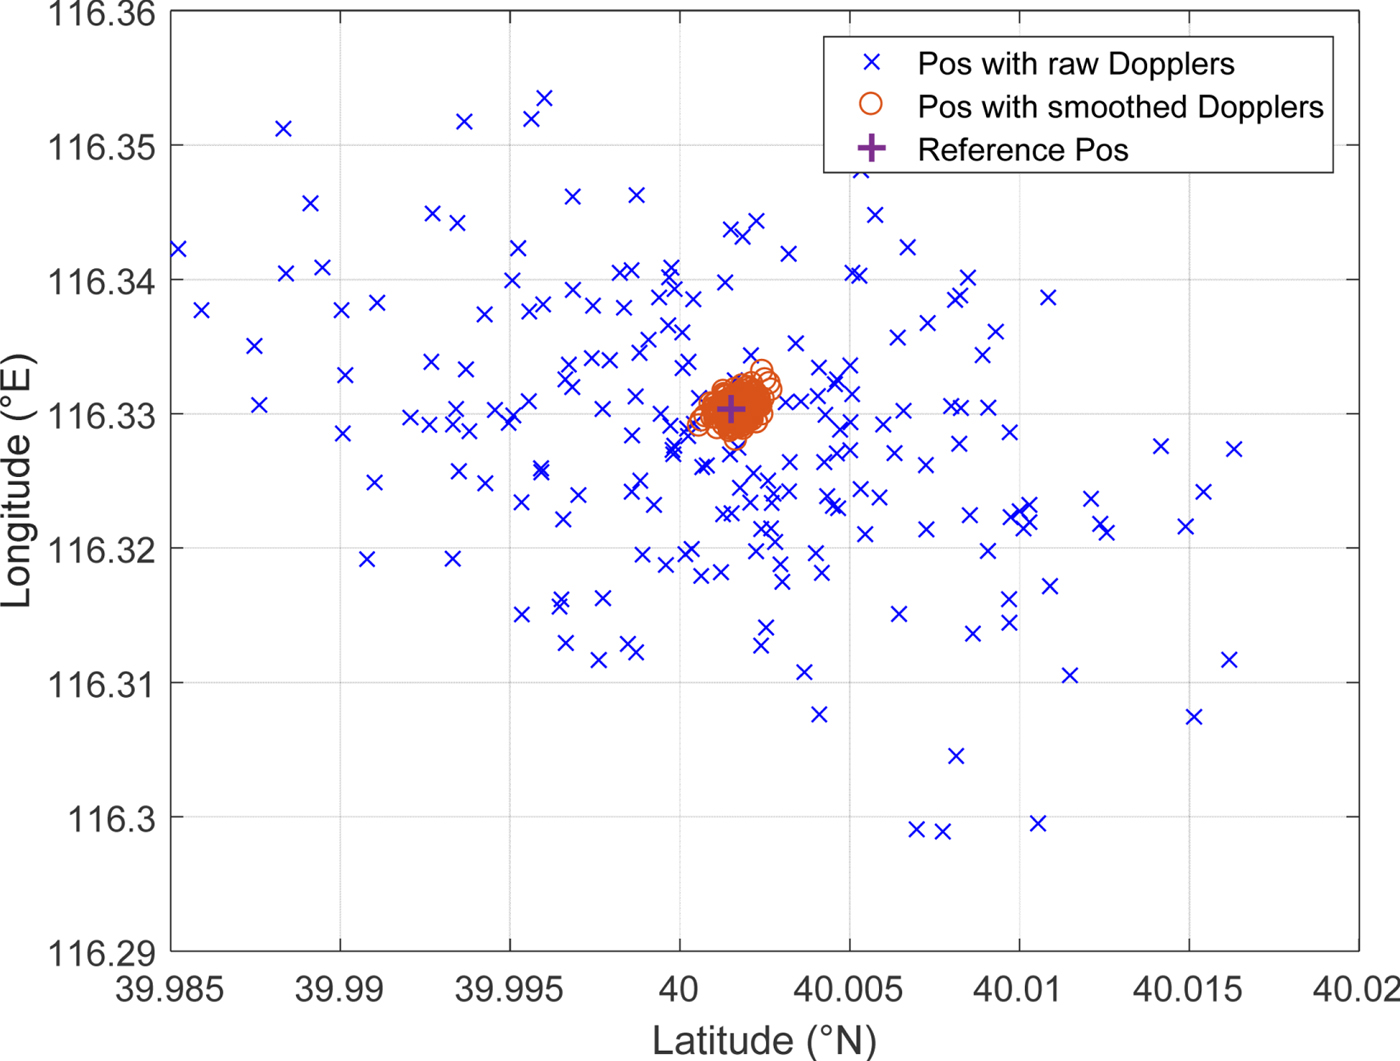
The results of a typical positioning test with the Doppler Smoothing Technique (DST) are shown in Figure 8. The detailed experimental parameters are listed in Table 2. It is evident that the proposed DST significantly improves the accuracy of the Doppler positioning method, while the positioning rate remains unchanged. In the experiment, the standard deviation shrinks from around the kilometre-scale to the hundred-metre scale. In fact, by implementing DST, the hundred-metre scale accuracy of Doppler positioning is what we can expect in the field test.
Improvement of Doppler positioning accuracy with DST (“Pos” refers to position).
Parameters in the Doppler positioning with Doppler Smoothing Technique (DST).

5. EXPERIMENTAL RESULTS
5.1. Spoofing detection on dual-function software defined GNSS receiver
By applying the test statistic in Equation (4) and the derived threshold in Equation (7), a practical and effective consistency check module of the dual-function software-defined GNSS receiver can be realised. Meanwhile, the Doppler smoothing technique is also applied. In order to test the performance of the proposed detection model, a replay spoofing is presented. Briefly speaking, replay spoofing attacks a GNSS receiver by retransmitting delayed GNSS signals. These counterfeit signals would mislead the victim receiver to derive fake transmitting times, calculating false pseudoranges, and finally reporting deviated positions. Such a spoofing technique is common due to its simplicity and effectiveness.
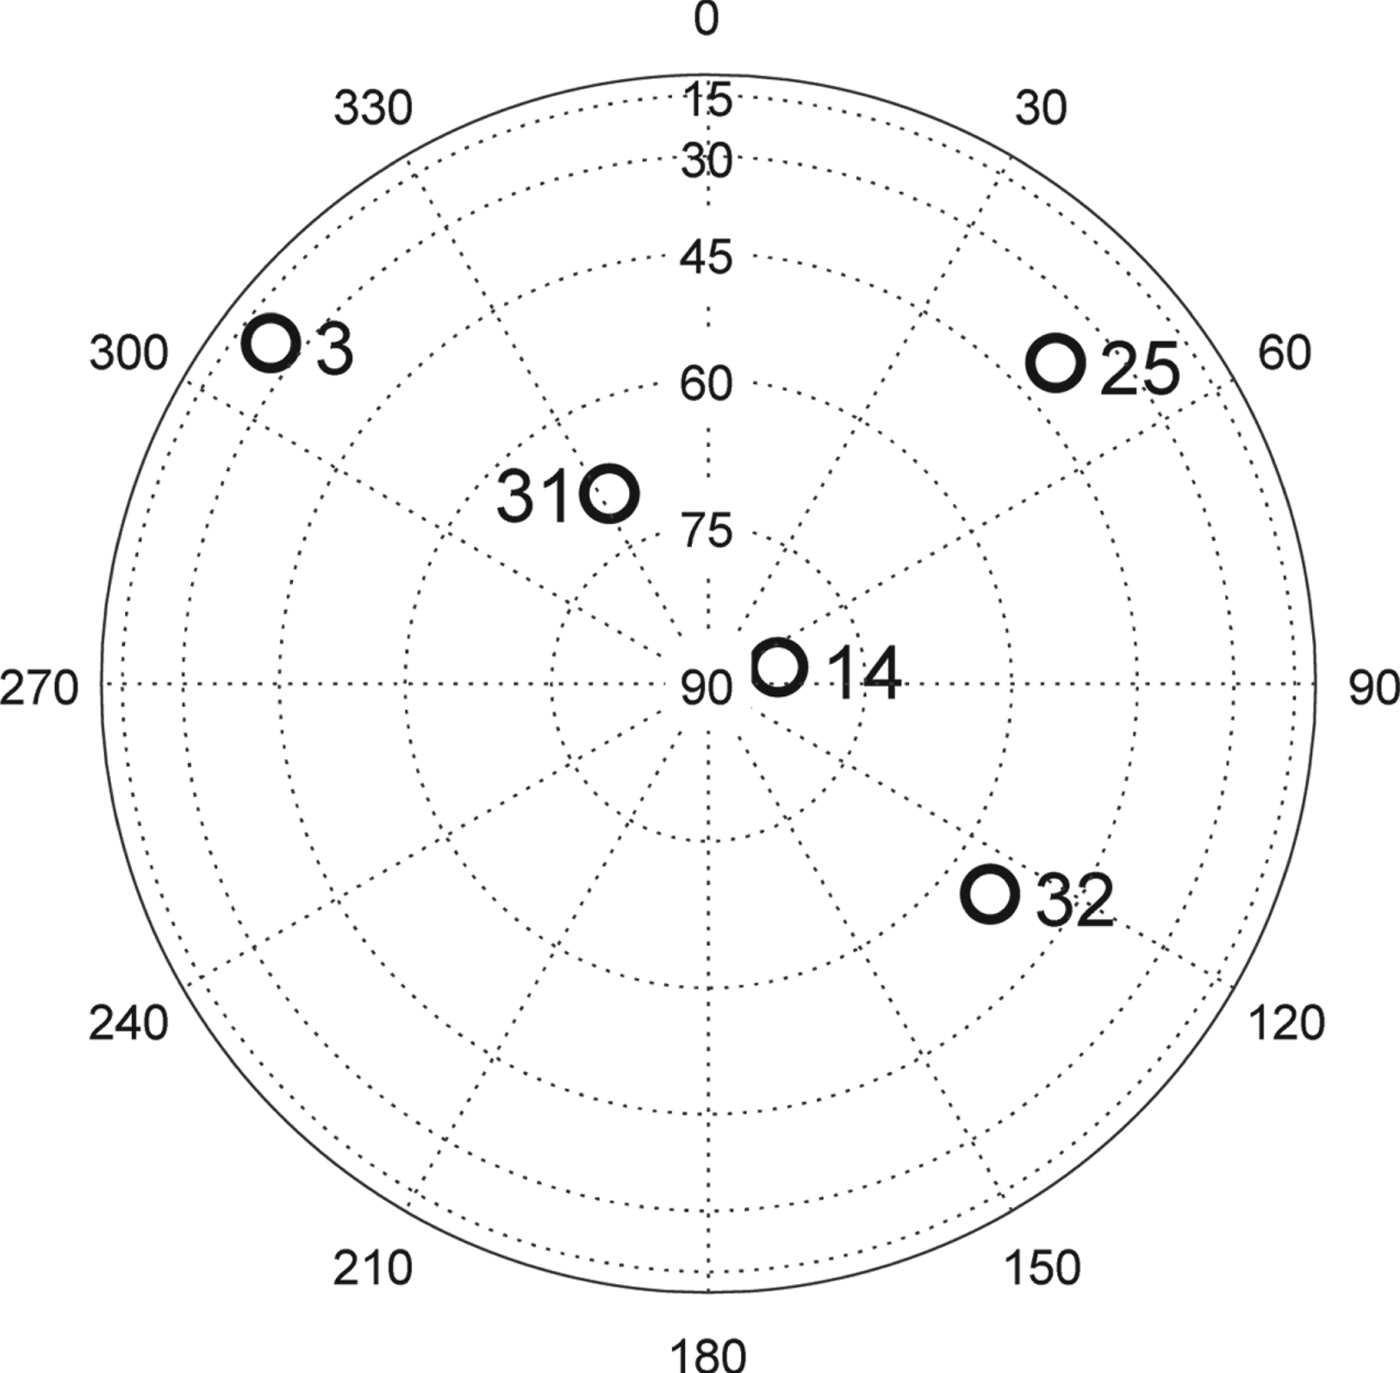
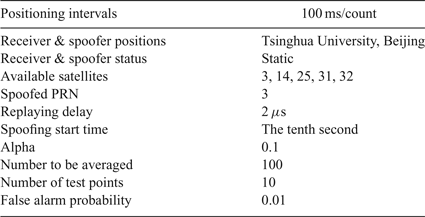
This simulation is based on real GPS Coarse/Acquisition (C/A) code signals on the L1 frequency, which were recorded by a Data Acquisition Card (DAC) with a down converter at 19:35 in Tsinghua University, Beijing on 11 December 2016. The Intermediate carrier Frequency (IF) of the signal was at 46.42 MHz and the sampling rate was 62 MHz. Five available GPS satellite signals were used in positioning. The constellation is plotted in Figure 9 and the experimental environment of the replay-spoofing test is listed in Table 3. As shown in the table, the PRN 3 signal is delayed by 2 μs from the tenth second, which is a typical part-channel spoofing scenario. For various spoofing scenarios to verify the difference of the positioning fixes between Doppler and traditional method, readers can refer to our previous work (Figures 8, 10 and 11, in Chu et al., Reference Chu, Li, Wen, Wu and Lu2017).
Distribution of used satellites in view.

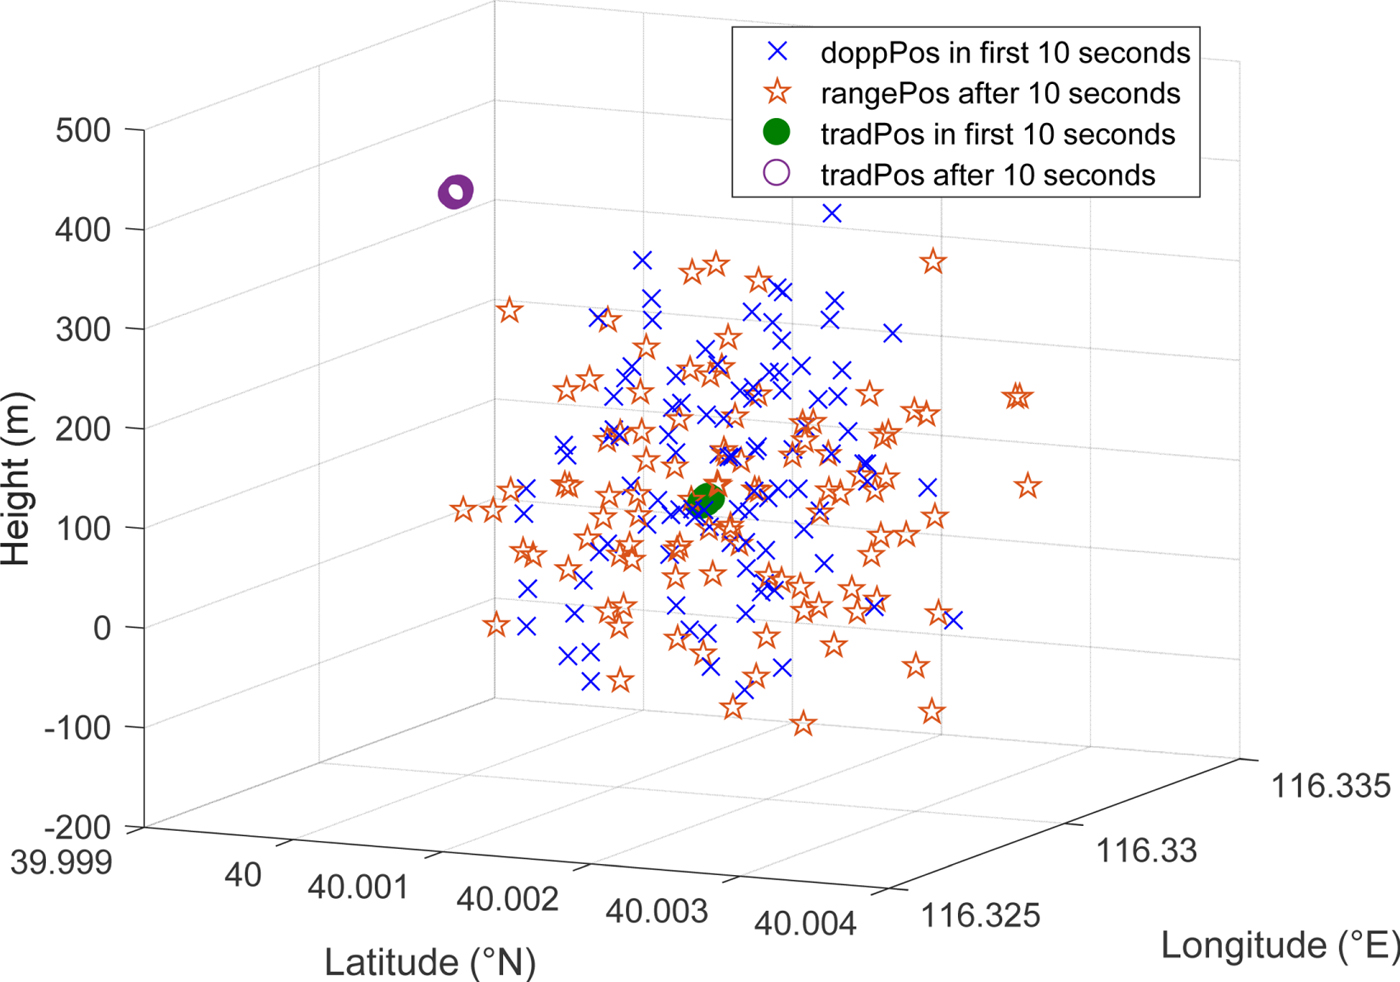
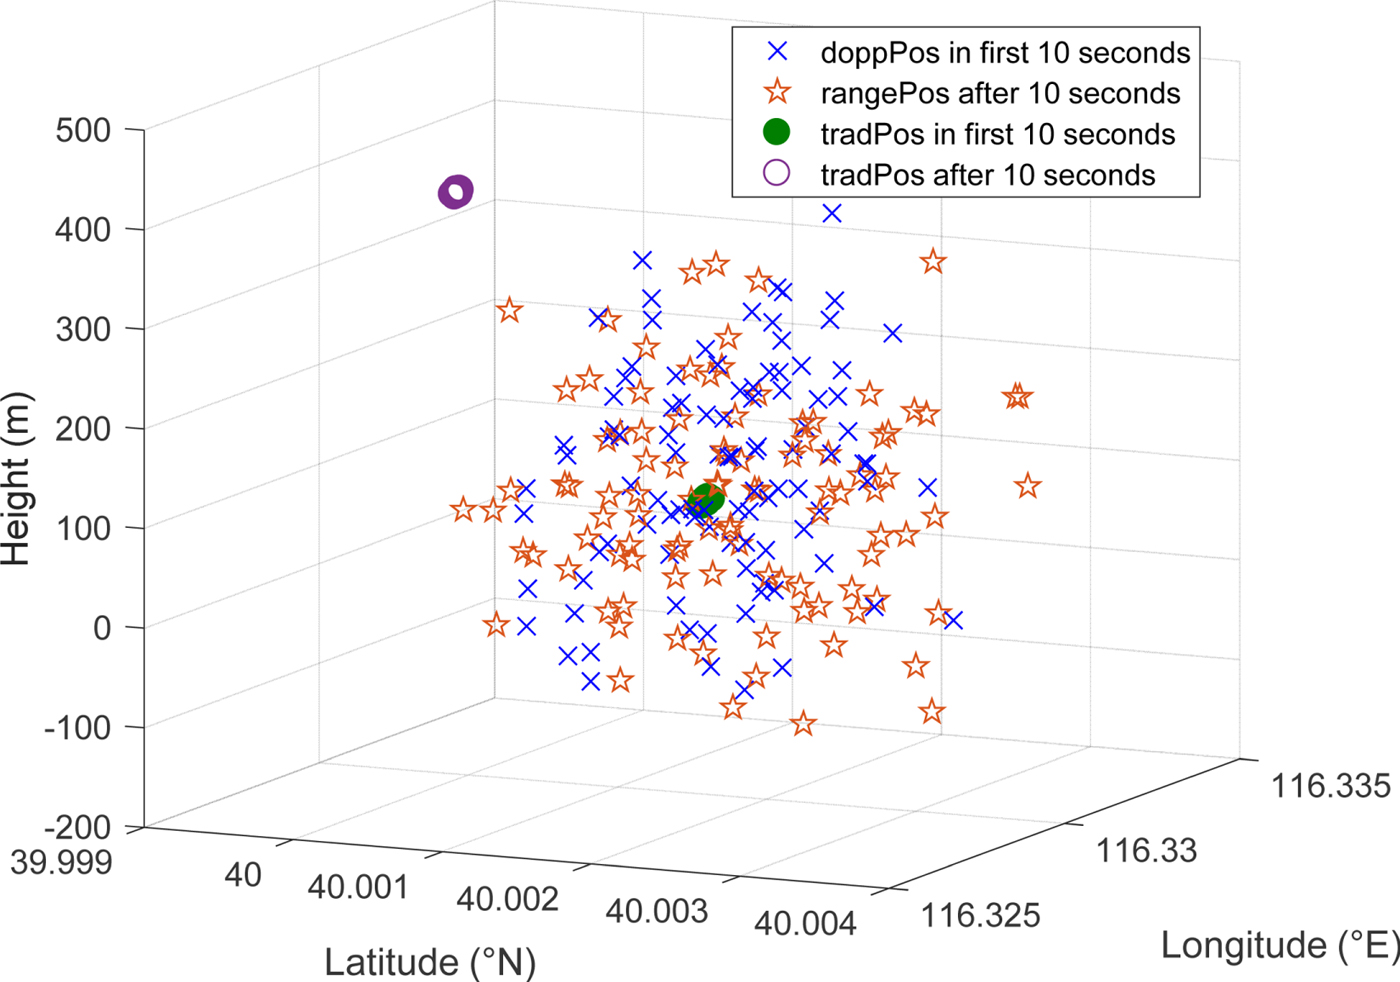
Positioning fixes by Doppler method and traditional method under replay spoofing test (“doppPos” refers to Doppler positioning fixes; “tradPos” refers to traditional positioning fixes).
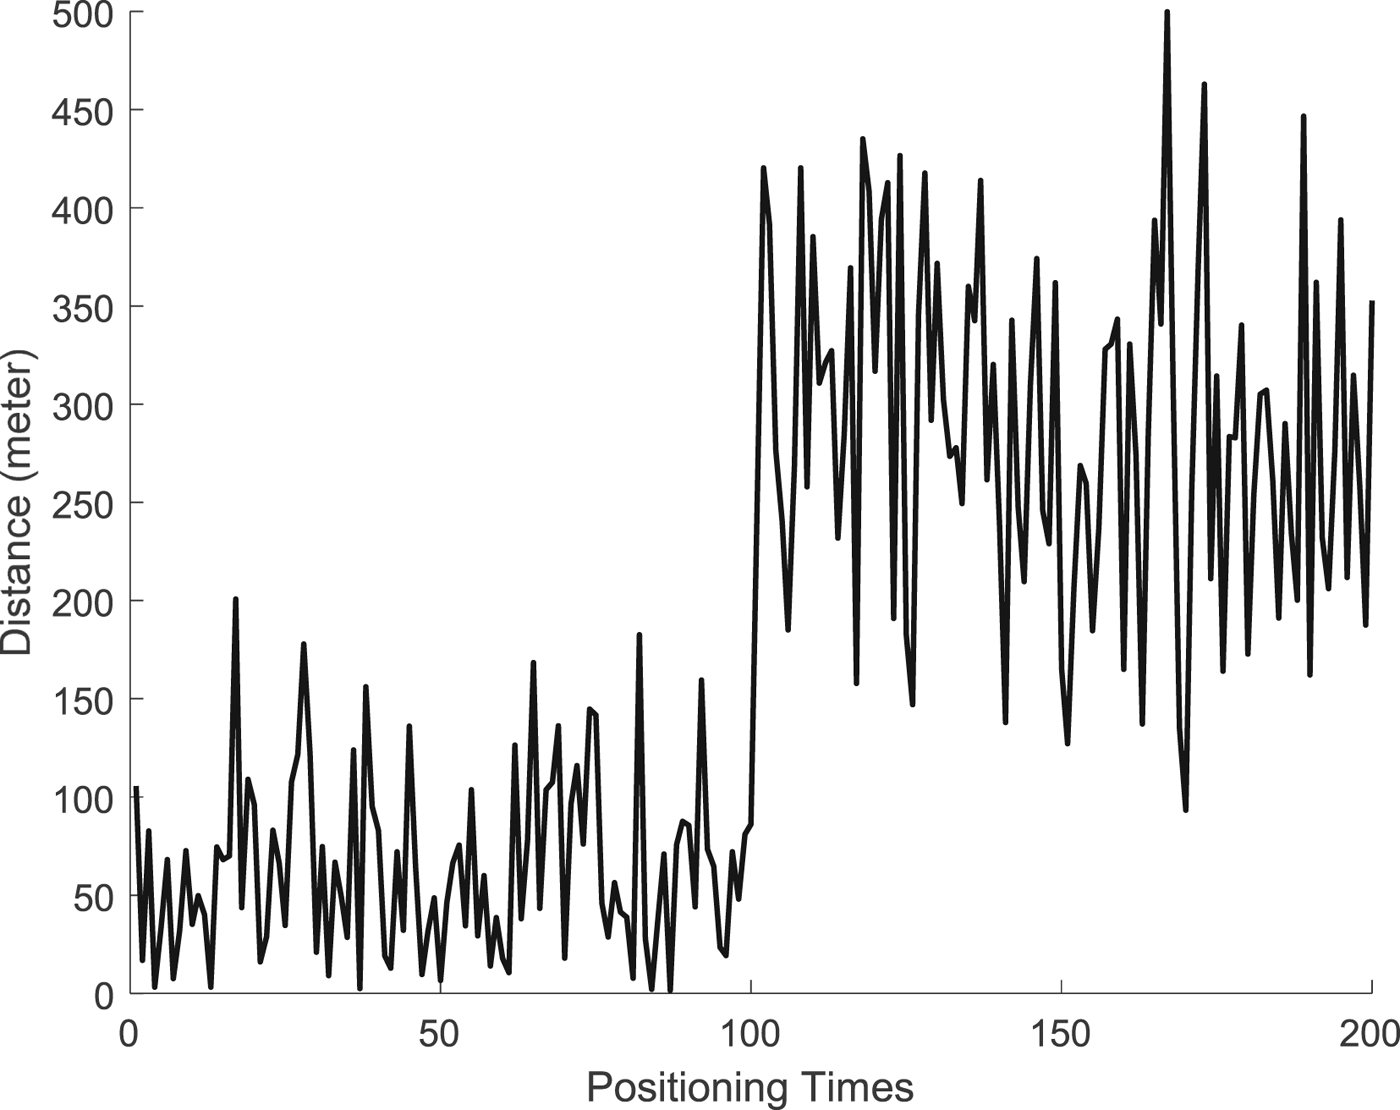
Distance between Doppler positioning fixes and Traditional fixes under replay spoofing test.

Parameters in the replay spoofing test.

Positioning results of both methods are shown in Figure 10 and the distances are shown in Figure 11. From the beginning, the Doppler positioning fixes are consistent with the traditional ones, despite their lower accuracies. At the onset of a replay attack, the traditional positioning fixes are spoofed hundreds of metres away from the authentic position. Doppler positioning fixes are also spoofed but are still near the genuine position. This phenomenon has been modelled and analysed in our earlier work (Chu et al., Reference Chu, Li, Wen, Wu and Lu2017). In fact, due to the small distance between the spoofer and the victim receiver and the stability of Doppler over a short period, the replayed signal of PRN 3 has almost the same Doppler as the authentic one. Therefore, the Doppler positioning results with spoofing are almost identical to the ones without spoofing influence in this case. From Figure 11, it is clear that the distance jumps at the 100th positioning time, namely the tenth second, which is the start of the spoofing.
Figure 12 shows the GLRT-based detection results of the dual-function software-defined receiver. Test statistics are lower than the threshold before spoofing and higher than the threshold after spoofing. The proposed test statistic and threshold are functioning well, thus validating the effectiveness of the GLRT-based statistical detection model on a software-defined receiver.
Detection results of the software-defined receiver.

5.2. Field test of spoofing detection on dual-function real-time GNSS receiver
Experiments based on a dual-function real-time GNSS receiver were conducted. The Doppler positioning and the traditional method were both available in the receiver. The basic functions of the receiver are described in Chu et al. (Reference Chu, Li, Wen, Wu and Lu2017). As an extension, the modified α -filter-based Doppler smoothing technique was applied in the real-time receiver. Meanwhile, the statistical detection model was also employed for the receiver.
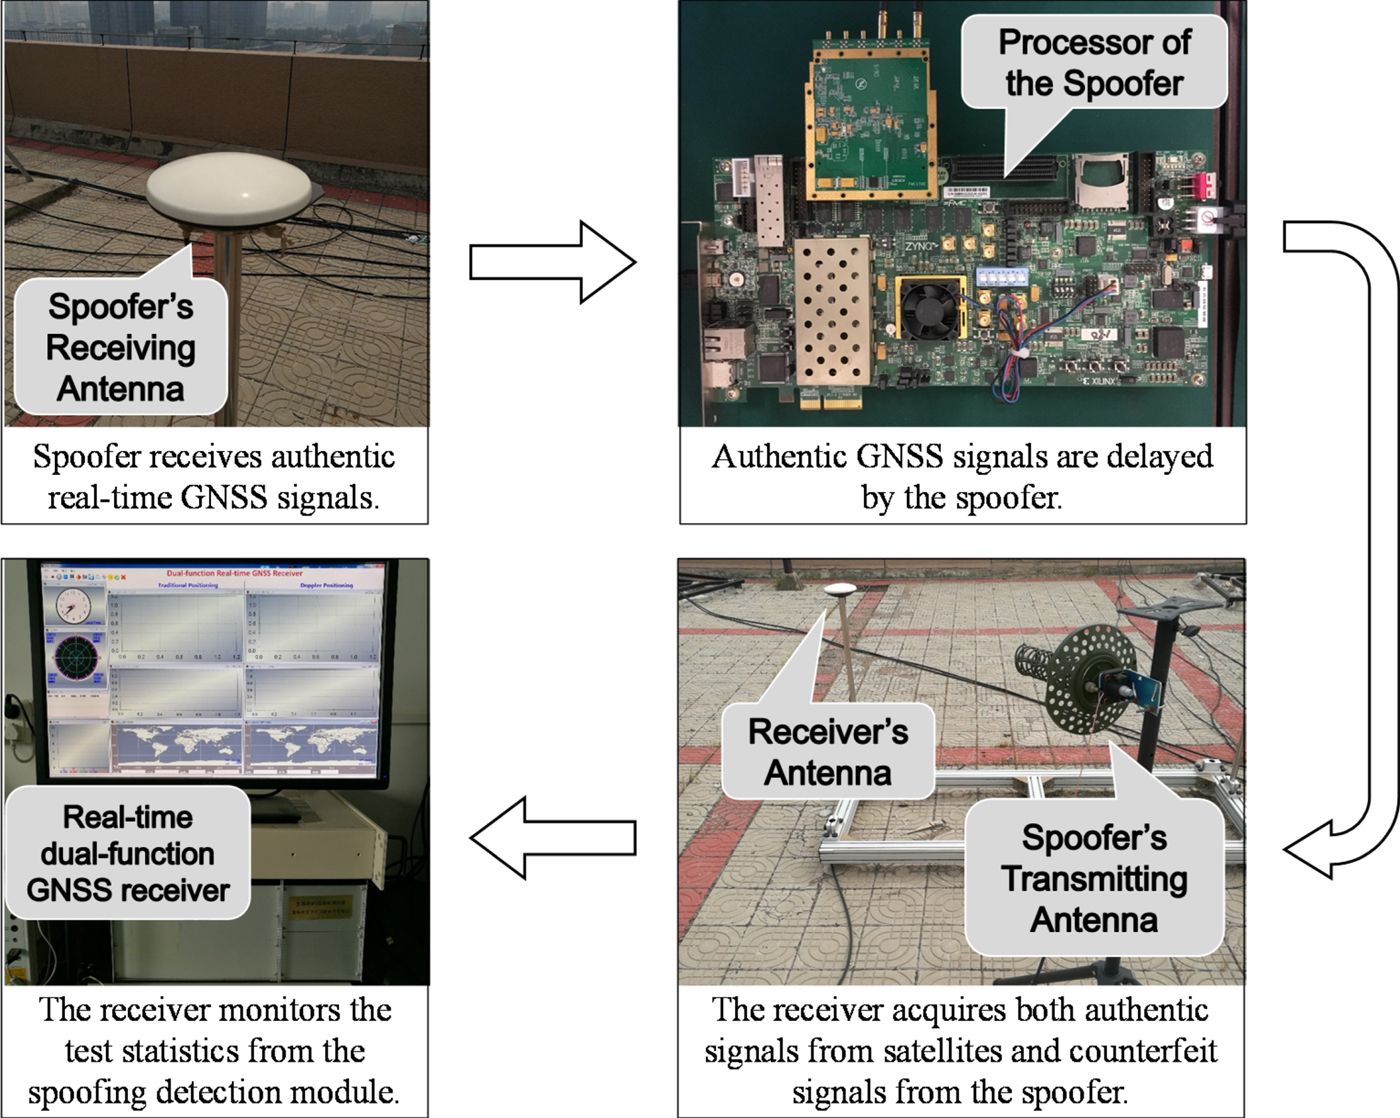
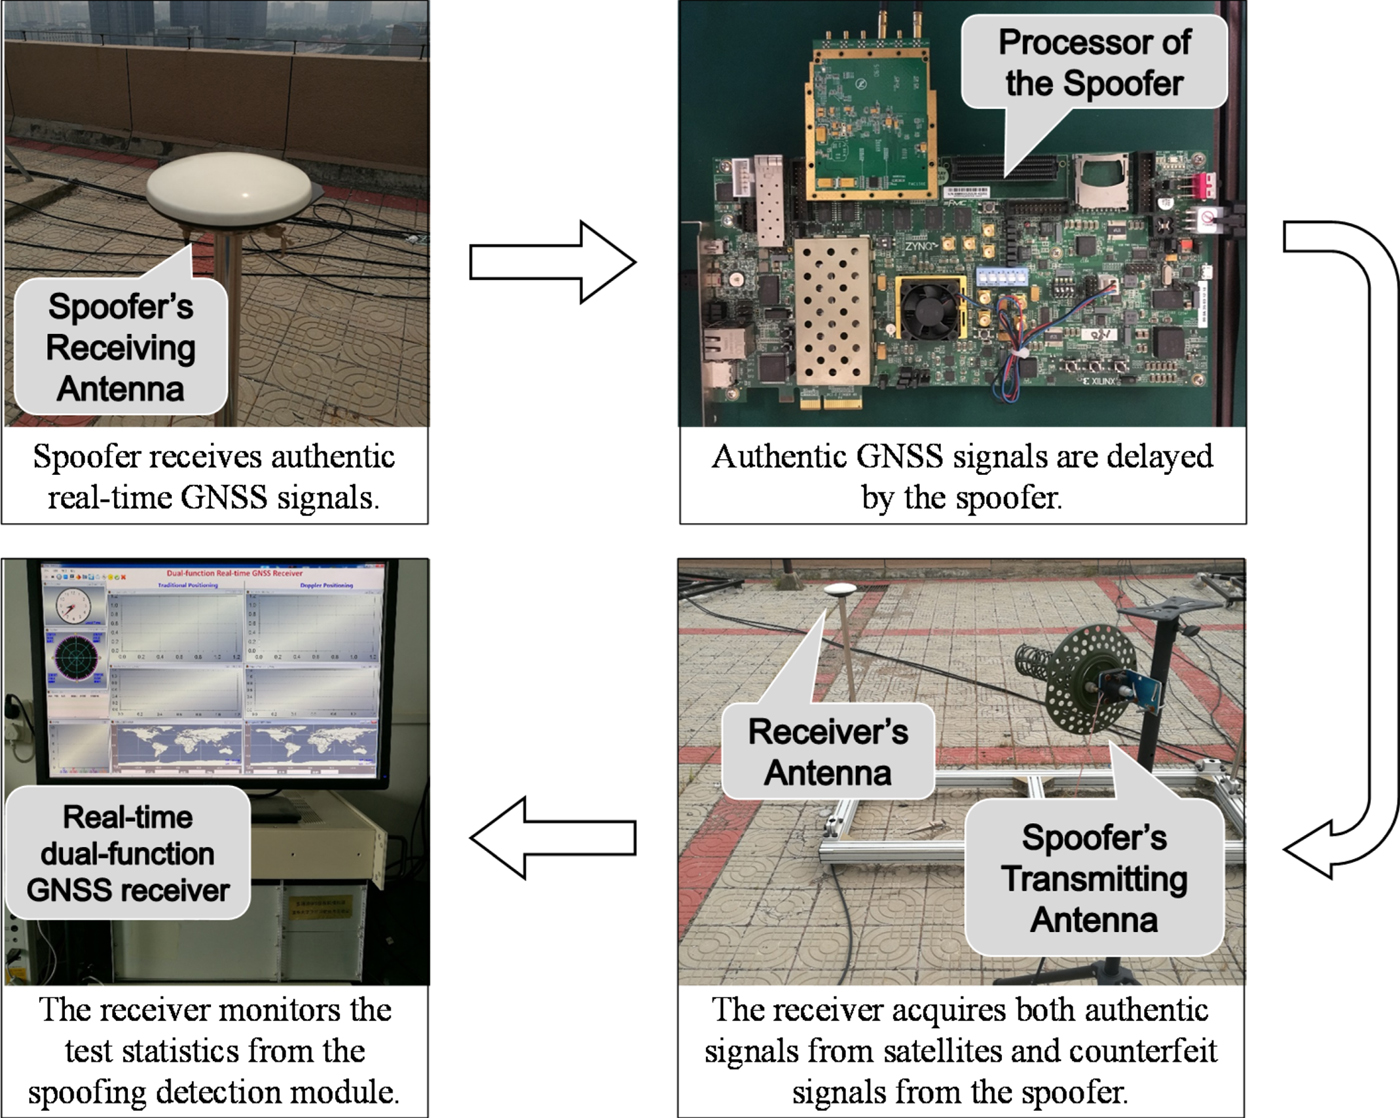
The flow chart of the field test is illustrated in Figure 13. The inherent processing delay of the spoofer was approximately 800 ns to 1,000 ns and the RF module error of the spoofer was around 200 Hz. The antennae of the spoofer and the receiver were both static at Tsinghua University and the distance between them was around 30 metres. In spoofing scenarios, the authentic Radio Frequency (RF) GNSS signals were received by the spoofer's receiving antenna, and then down- converted to IF signals. The IF signals were delayed by the spoofer's processor and then up-converted to RF signals. After power adjustment, the RF false signals were propagated toward a victim receiver via the transmitting antenna of the spoofer. In such a condition, the victim receiver would simultaneously receive both authentic GNSS and spoofing signals and capture the GNSS signals with higher powers. For different satellites, the power of the authentic signals varies, while the power of the false signals was the same when all counterfeit signals were transmitted via one antenna. Owing to a reasonable power of spoofing signals by power adjustment, a part-channel spoofing scenario was likely to happen.
The field test procedure.
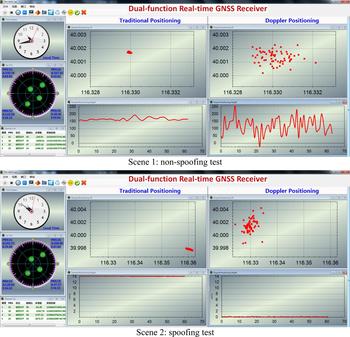
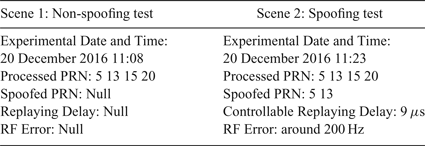
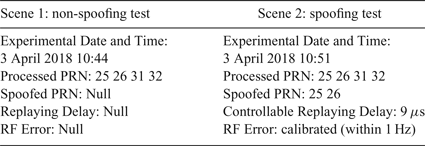
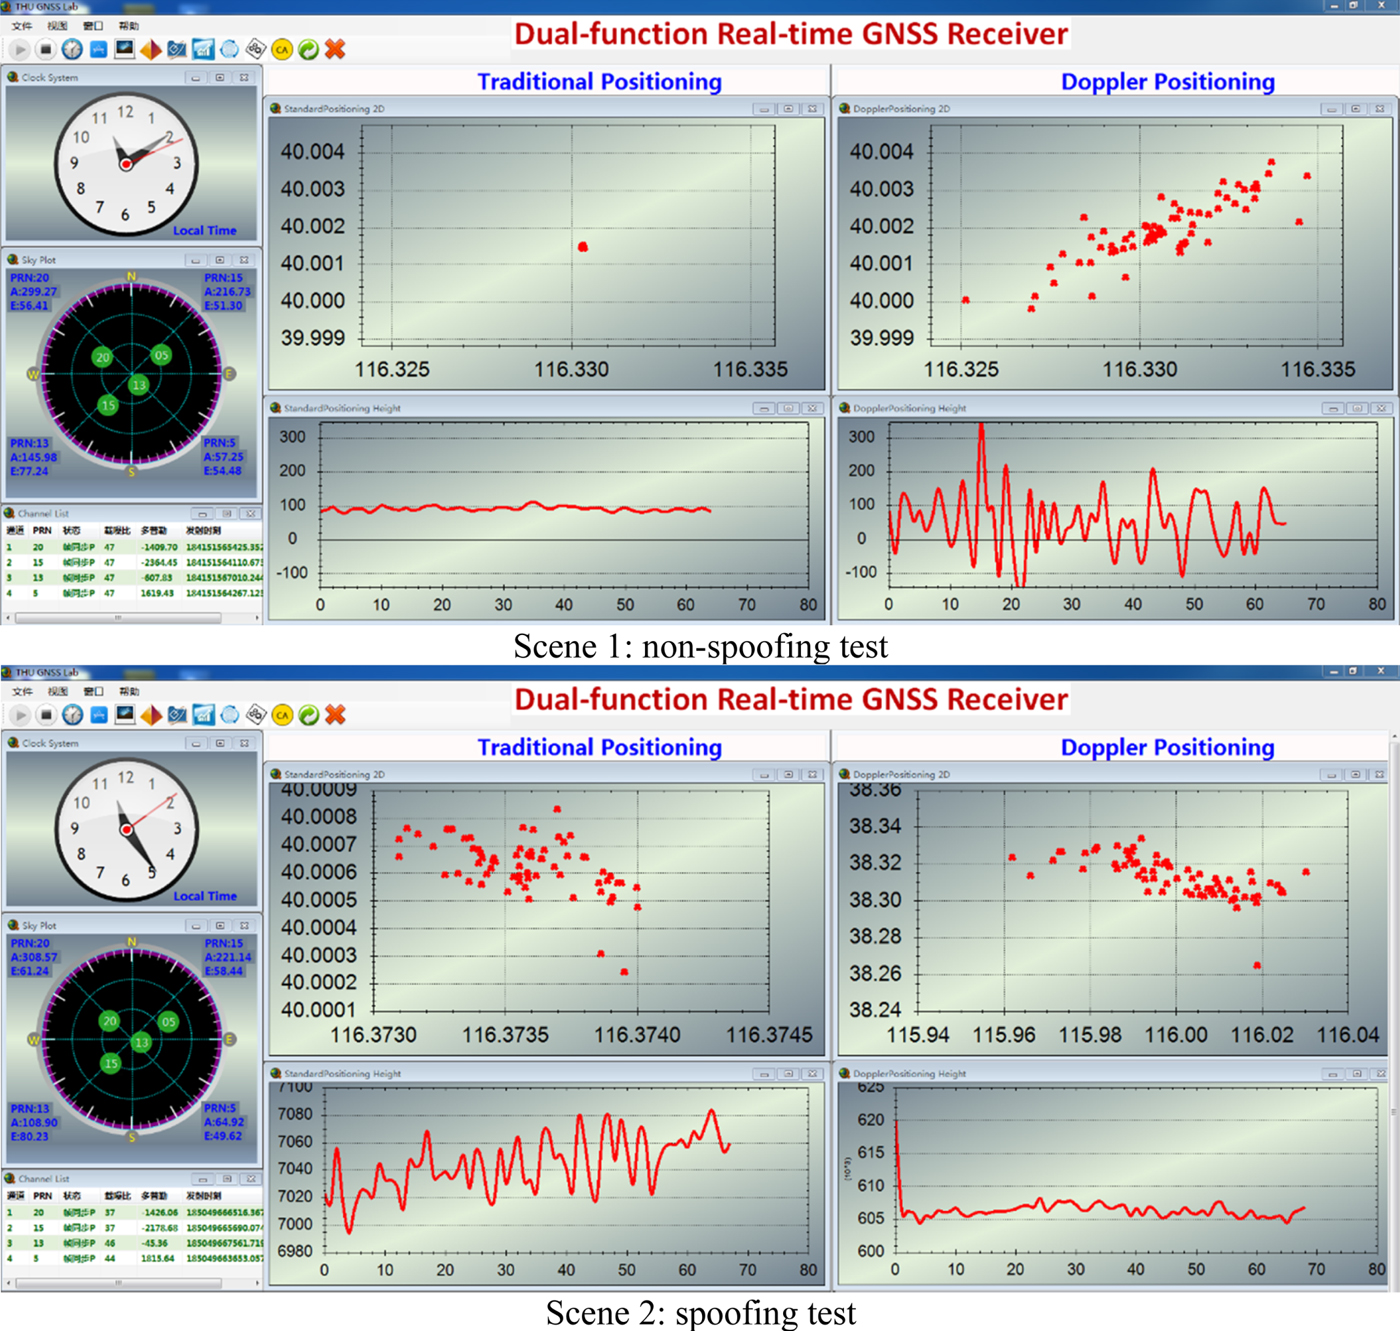
Field tests were conducted in two scenarios. In field test 1, the RF error of the spoofer (which was around 200 Hz) was not calibrated; in field test 2, the RF error of the spoofer was calibrated to within 1 Hz. The detailed experimental environments of field tests 1 and 2 are provided in Tables 4 and 5, respectively. As suggested, they are both typical part-channel spoofing scenarios and the replaying delays are around 10 μs in total (inherent delay plus controllable delay). The parameters of the detector are set as follows: the number of test points is ten and the false alarm probability is 0.01. The distribution of used satellites in view can be seen from the Graphical User Interface (GUI) of the real-time receiver in Figures 14 and 16, respectively.
Positioning results of the real-time receiver (field test 1).
Detection results of the real-time receiver (field test 1).

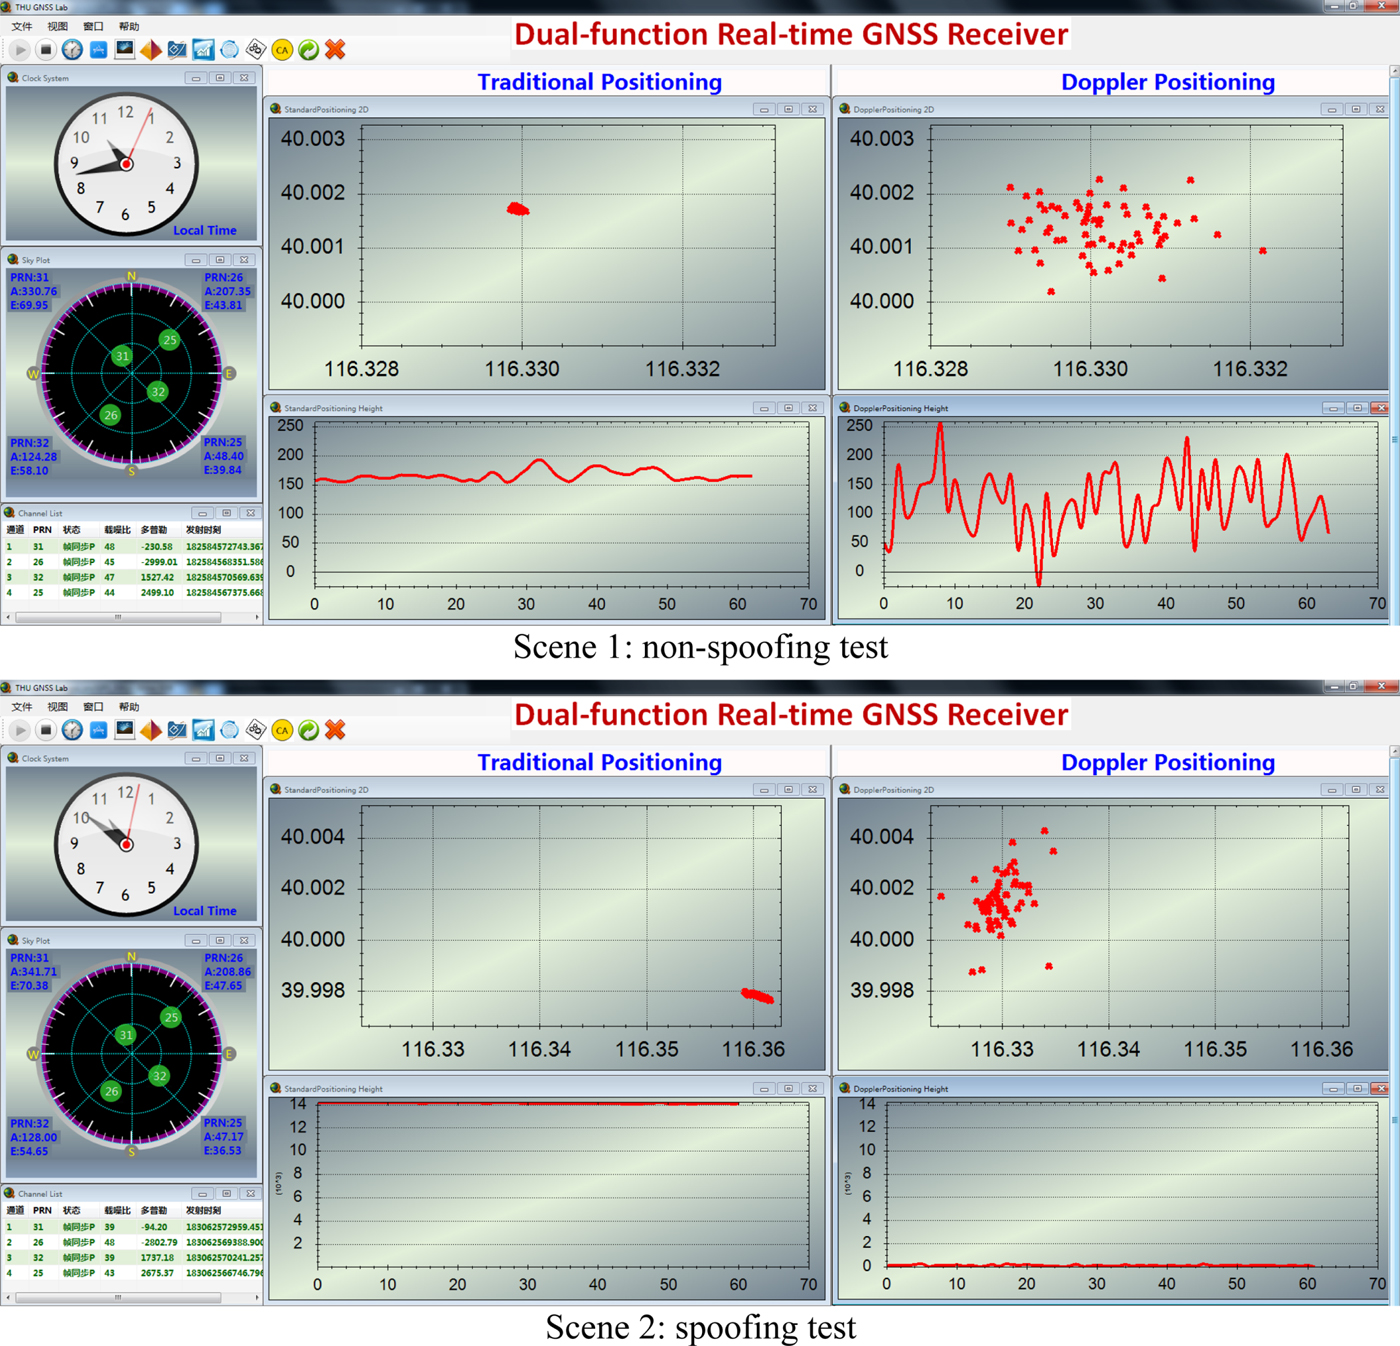
Positioning results of the real-time receiver (field test 2).
Environment for field test 1.

Environment for field test 2.

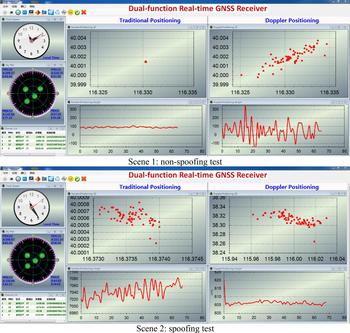
Experimental results of field test 1 are shown in Figures 14 and 15. Figure 14 shows the positioning results of the two methods. In the non-spoofing scenario, the real-time distance between the Doppler positioning and the traditional fixes is under 300 metres, and they are both around the true reference position. However, under the spoofing scenario, the target receiver re-captures the four satellites' signals among which PRN 5 and 13 are successfully controlled by the spoofer. As scene 2 of Figure 14 shows, the positions of traditional methods are reasonably spoofed away by around several kilometres under a 10 μs delay, while the spoofed Doppler positioning results are deviated by hundreds of kilometres. This is because the RF module error of the spoofer is around 200 Hz, which leads to false Doppler shifts of PRN 5 and 13. Thus by adopting these false Doppler shifts, the Doppler positioning fixes are dramatically changed.
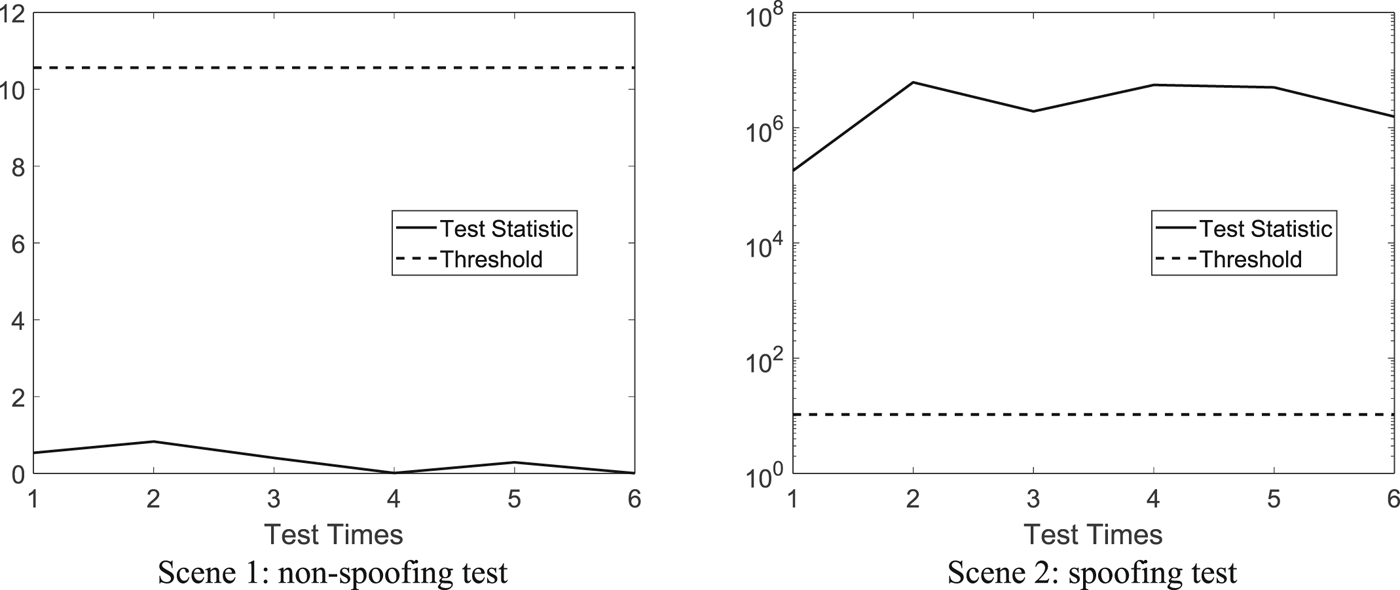
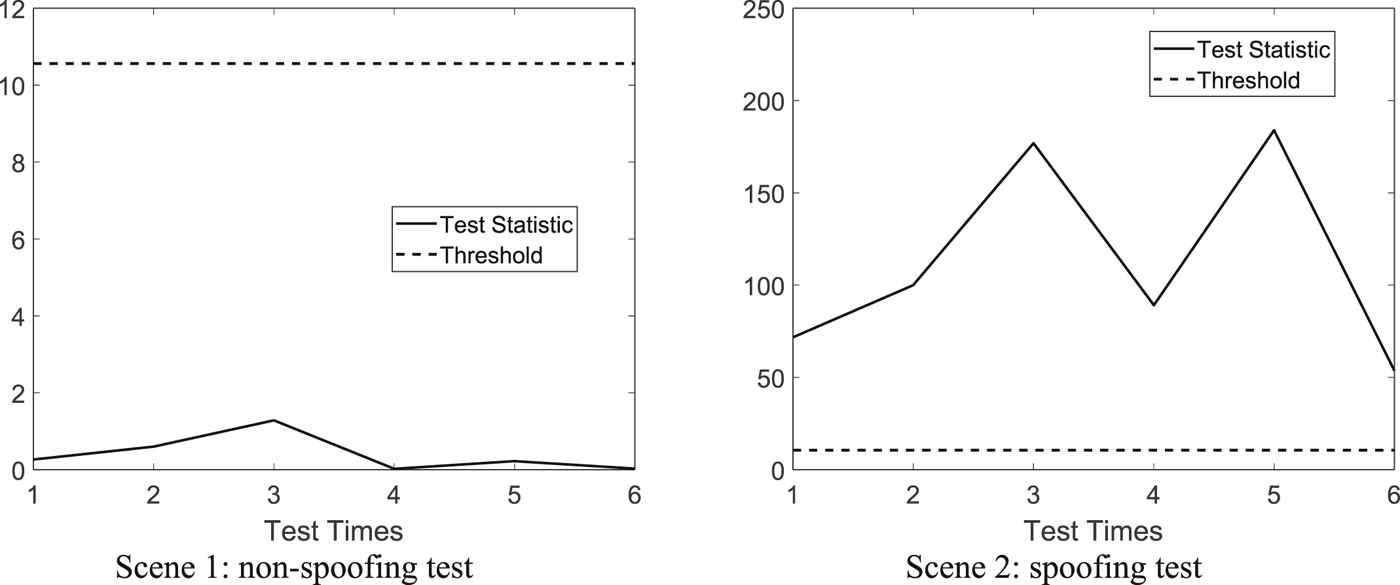
Figure 15 demonstrates the detection results. In the non-spoofing scenario, the Test Statistic shown in scene 1 of Figure 15 is below the threshold during all six tests. Then, in the presence of a spoofing signal, the Test Statistic is remarkably above the threshold at every test time as shown in scene 2 of Figure 15. Compared with Figure 12 and Figure 17, this actual part-channel spoofing attack results in more significant changes of the test statistic because of the spoofer's RF error.
Detection results of the real-time receiver (field test 2).

Experimental results of field test 2 (the RF error-calibrated test) are shown in Figures 16 and 17. Figure 16 shows the positioning results of the two methods. In the non-spoofing scenario, they are both around the true reference position, while they are inconsistent under the spoofing scenario. The traditional positioning fixes are spoofed around 14 kilometres away from the authentic position. Doppler positioning fixes are also spoofed but still near the genuine position. This is because the RF error of the spoofer is calibrated and Doppler shifts changed little during the short time delay, so the replayed signals have almost the same Doppler shifts as the authentic ones. Therefore, the Doppler positioning results are still near the authentic position in this case. Figure 17 demonstrates the detection results. In the non-spoofing scenario, the Test Statistic is below the threshold as shown in scene 1 of Figure 17 and above the threshold under the spoofing scenario as shown in scene 2 of Figure 17. All in all, the feasibility and effectiveness of the statistical detection model for a real-time receiver are validated through field tests 1 and 2.
6. CONCLUSION
This paper has presented a spoofing detection method based on the consistency of Doppler-based and pseudorange-based positioning results. It extended research in two main areas. First, a GLRT-based statistical spoofing detection model has been established which helps to theoretically analyse the performance of the spoofing detection method. Based on Monte Carlo simulation, detection performance has been evaluated. Applying the model, a practical consistency check module with an a priori-information-free threshold has been realised in both dual-function software defined and real-time GNSS receivers. In addition, a Doppler smoothing technique was proposed to efficiently improve the accuracy of the Doppler positioning method, hence improving the spoofing detection performance. Experiments verified the effectiveness of the proposed Doppler smoothing technique and the statistical detection model. As a result, the modified α -filter-based Doppler smoothing technique improved the accuracy of the Doppler positioning results to approximately 100 metres in terms of standard deviation without extra time burdens. Also, the proposed statistical detection model was proved to be functioning well in part-channel replay spoofing tests with several microseconds delay.
ACKNOWLEDGMENTS
This work was supported by the National Natural Science Foundation of China (Grant No. 61571255).