INTRODUCTION
There is abundant evidence that ontogenetic changes, i.e. changes with life history, in spectral sensitivity occur in fish that undergo developmentally related changes in habitat, from both larvae to juvenile, and juvenile to adult (reviewed in Beaudet & Hawryshyn, Reference Beaudet, Hawryshyn, Archer, Djamgoz, Loew, Partridge and Vellerga1999; Shand et al., Reference Shand, Hart, Thomas and Partridge2002). While a variety of deep-sea crustacean species also have shallow-living larval or juvenile forms, only one study has examined differences in spectral sensitivity between different life stages that are found at substantially different depths (Jinks et al., Reference Jinks, Markley, Taylor, Perovich, Dittel, Epifanio and Cronin2002). In that study, it was shown that the zoeal stage of the deep-sea vent crab Bythograea thermydron possesses a visual pigment with an absorption maximum (λmax) of 447 nm, shifting to 479 nm in the megalopa, and to 489 nm in the adult. Differences in spectral sensitivity among adult crustaceans occupying different habitats suggest that such an ontogenetic shift might routinely occur in species whose juvenile stages occupy different habitats than the adults. Shallow-water species from near-shore environments, such as crabs and lobsters, have rhodopsin absorption or spectral sensitivity maxima between 485–530 nm (reviewed in Marshall et al., Reference Marshall, Cronin, Frank, Collin and Marshall2003), while those of open water deep-living species, where light transmits best at 470–500 nm (Jerlov, Reference Jerlov1976—Jerlov's Type 1-111 water), are between 470–500 nm. This suggests that the peak spectral sensitivity of shallow-living juveniles may be at different wavelengths than those of deep-living adults.
There is often a strong relationship between postlarval/juvenile abundance and subsequent stock size (reviewed in Ehrhardt et al., Reference Ehrhardt, Legault and Restrepo2001; Wahle, Reference Wahle2003). In order to model the effects of environmental perturbations to the ambient light field on the survival of a population, it is important to know if the photosensitivity of the adults, upon which all previous studies have been conducted, is the same as that of the juveniles. To this end, we examined the photoreceptors of the ontogenetically migrating lophogastrid Gnathophausia ingens (Dohrn, 1870). An earlier study on the spectral sensitivity of the adults suggested that they possess an unusual complement of visual pigments, which may be a holdover from their shallow water juvenile stage (Frank & Case, Reference Frank and Case1988b). For the current study, the visual systems of young, shallower-living juveniles and older, deeper-living adults were examined with electrophysiology, molecular biology and microspectrophotometry. The results suggest that while there is a difference between the spectral sensitivity of adults and juveniles, these differences arise from the presence of different densities of screening pigment. Remarkably, the deep-living adults, in a photon-limited environment, still appear to possess migrating screening pigments.
MATERIALS AND METHODS
Animal collection and maintenance
Live Gnathophausia ingens (Crustacea: Lophogastrida) were collected from San Clemente Basin (32°25N 117°56W) on research cruises aboard the RV ‘New Horizon’ in June 2005 and the RV ‘Wecoma’ in September 2006. Specimens were collected with a 3 m × 3 m opening/closing Tucker Trawl, equipped with a thermally insulated, light-tight cod-end that could be closed at depth. After each trawl, the closed cod-end was removed from the net and transported to a light-tight room, where live specimens were sorted under dim red light. Specimens were maintained in the dark at 5°C for a minimum of 24 hours before being used in experiments. Deep trawls (600–800 m) were conducted to collect instars 6–10 (carapace lengths of 19–43 mm; hereafter referred to as adult Gnathophausia), and shallow trawls (100–300 m) were conducted to collect instars 3–4 (carapace lengths of 9–14.5 mm; hereafter referred to as juvenile Gnathophausia).
Electrophysiology
Electrophysiological recordings were made on board ship as well as in a land-based laboratory using the same equipment. All experimental preparations were carried out under dim red light. Animals were attached dorsally to a plastic mounting post using cyanoacrylic glue (Loctite Corp), and suspended in a recording chamber containing chilled seawater (5–7°C). With this configuration, electroretinograms (ERGs) were recorded with subcorneal metal microelectrodes (FHC Inc) from live animals for 2–3 days. These AC recordings were digitized and stored for later analysis using a data acquisition program written in LabView (National Instruments, Inc).
A stimulus light from an Instruments SA monochromator (Model H-20) was transmitted to the eye through one branch of a bifurcated light guide composed of randomized fused silica fibres (EXFO). Stimulus duration of 100 ms was controlled with a Uniblitz shutter (Model VS25) under computer control. Irradiance was controlled with a neutral density wheel under computer control, and calibrated in units of photons cm−2 s−1 with a UDT Optometer (Model S370) and radiometric probe placed 3 mm from the tip of the light guide.
Spectral sensitivity measurements were initiated when the amplitude of the response to a standard flash of set wavelength and intensity remained constant for an hour. Although all preparations were conducted under dim red light, it took 4–5 hours before the test subjects were fully dark-adapted. The irradiance of the stimulus light at each test wavelength (350–600 nm, every 10–20 nm) was adjusted such that a defined criterion response was obtained. The criterion was set at 20 µV above background noise for each preparation, and was never above 100 µV, which is less than 5% of the potential maximum ERG voltage (3–5 mV) that can be recorded under these conditions. Stimulus flashes were given at 1 minute intervals, with a standard test flash given every 5 flashes to ensure that the physiological state of the eye had not changed.
For chromatic adaptation experiments, accessory illumination was provided through the other branch of the light guide by an Ocean Optics LS-1 lamp, ensuring that both the adapting light and stimulus light impinged on the same receptor cells. The white adapting light was filtered with one of three filters: a 400 nm bandpass filter (ESCO S914000, FWHM = 10 nm), a 488 nm bandpass filter (Melles Griot 03FIR022, FWHM = 10 nm), or a 570 nm cutoff filter (Melles Griot OG570). Irradiance was adjusted with neutral density filters such that the adapting light reduced the sensitivity of the eye by 1–2 log units. A spectral sensitivity curve under chromatic adaptation was recorded once the response amplitude to a standard test flash had not changed for 1 hour in the presence of the adapting light.
Spectral sensitivity curves were generated by plotting the inverse of irradiance (in photons cm−2 s−1) required to produce the criterion response at each wavelength. Data from different animals were normalized before being combined to produce the final curve. These averaged data were best-fit to an A1-based visual pigment absorbance template (Govardovskii et al., Reference Govardovskii, Fyhrquist, Reuter, Kuzmin and Donner2000), using the Solver function of Excel (Microsoft) to determine the lowest residual sum of squares fit to the data (Stavenga et al., Reference Stavenga, Smits and Hoenders1993).
Age group (adult versus juveniles) and treatment group (dark adapted versus chromatically adapted) differences in spectral sensitivity were determined by comparing the inverse irradiances required to generate a criterion response at different parts of the spectral sensitivity curve. The curve was split into 4 categories: UV (mean of inverse irradiances required to generate criterion responses to test flashes from 350–400 nm), blue (mean 410–460 nm), sensitivity max or SensMax (mean 480–530 nm), and red (mean 550–600 nm). Ratios were determined for UV: SensMax, blue:SensMax and red:SensMax, for both dark-adapted and chromatically adapted eyes. The Shapiro–Wilk test was used to determine if the data were from a normal distribution. Data were statistically analysed using a one-way ANOVA for parametric data sets and the Kruskal–Wallis test for non-parametric data sets (Zar, Reference Zar1999).
Microspectrophotometry
Live Gnathophausia ingens collected on the research cruises were shipped in light-tight containers to a land-based laboratory for microspectrophotometry (MSP). Eyes were removed and quick-frozen with a cryogenic spray (SHUR/Freeze, Triangle Biomedical Sciences, Durham, NC), and sectioned at 14 µm on a cryostat. Sections were transferred to microscope slide cover slips, wetted with a drop of marine crustacean Ringer's containing 1.25% gluteraldehyde, and placed in a single-beam microspectrophotometer. Photoreceptors selected under dim, far-red light were scanned using a beam placed in each rhabdom, from 400 to 700 nm at 1-nm intervals. Rhabdoms were scanned when fully dark-adapted and after full photobleaching using bright white light (2 minutes' treatment). Absorbance spectra of the rhodopsin in the dark-adapted receptor were taken as difference spectra between the appropriate scans and the scan of the bleached receptor. Approximately 30 rhabdoms were scanned, bleached and averaged for both juveniles and adults. These difference spectra were fitted mathematically with standard rhodopsin templates, using a least-squares procedure (see Cronin & Frank, Reference Cronin and Frank1996 and Cronin et al., Reference Cronin, Caldwell and Erdmann2002 for details).
Scans were also taken through the ommochrome distal screening pigment between the crystalline cones as well as the basal red pigment below the basement membrane. The effects of varying densities of the proximal pigment screen on the spectral sensitivities of the main rhabdoms were calculated using the following formula, the derivation of which is described in Snyder et al. (Reference Snyder, Menzel and Laughlin1973); see also Jordão et al. (Reference Jordão, Cronin and Oliveira2007).

where ξ(λ) is the absorbance/unit length of the rhabdom, α(λ) is the absorbance coefficient at wavelength λ, and A is area; the subscripts F and R represent the lateral filter and rhodopsin, respectively.
For this modelling, we used the Stavenga et al. (Reference Stavenga, Smits and Hoenders1993) template for a rhodopsin with peak absorption at 495 nm and the absorption spectrum for the ommochrome pigments measured in the adult retina. The rhabdom length was taken to be 100 µm, with the peak absorbance of the visual pigment taken to be 0.008 OD per µm (total OD = 0.8). The density of the screening pigment varied as described in the Results section.
Opsin sequences
Eyes were removed from dark-collected adult and juvenile specimens and transferred to RNAlater stabilization reagent (Qiagen) for storage at −80°C until use. Total RNA was isolated from whole retina using Trizol (Invitrogen) and used to generate cDNA using 3′RACE methods.
First-strand cDNA synthesis was performed using a poly (T) primer with an added adaptor sequence (Oakley & Huber, Reference Oakley and Huber2004) with Superscript III Reverse Transcriptase (Invitrogen) according to the manufacturer's instructions. Second strand sequences were generated using a primer for the adaptor sequence and a degenerate primer designed for crustacean middle-wavelength opsins, LWF1a (5′–TGG TAY CAR TWY CCI CCI ATG AA–3′; Porter et al., Reference Porter, Cronin, McClellan and Crandall2007). PCR products were then purified using the MinElute Gel extraction kit (Qiagen) and cloned into the pCR2.1-TOPO vector using the TA Cloning kit (Invitrogen) to screen for the possibility of multiple opsin gene expression or for allelic sequence differences. Colonies were screened for inserts by PCR using vector primers, and amplified clone products of the expected size were purified using a QIAquick PCR purification kit (Qiagen). In order to sequence the entire insert, purified products were sequenced using the ABI Big dye Ready Reaction kit with the LWF1a primer and an internal degenerate opsin primer, 1080_mod2F (5′–GAI CAR GCI AAR AAR ATG GG–3′; modified from Oakley & Huber, Reference Oakley and Huber2004), on an ABI 3100 Genetic Analyzer 16 capillary automated sequencer. Between two and eight clones were sequenced from two adult and two juvenile specimens. Nucleotide sequences from adults and juveniles were translated to amino acid sequences and aligned with a selection of other crustacean and insect middle wavelength opsins using ProbCons v1.08 (Do et al., Reference Do, Mahabhashyam, Brudno and Batzoglou2005). To root the tree, a range of outgroups were used, including vertebrate (bovine rhodopsin; human melanopsin—6693700), cephalopod (Sepia officinalis—AF000947), and insect short wavelength sensitive (Drosophila melanogaster Rh3—M17718, Rh4—AH001040, and Rh5—U67905; Manduca sexta—L78081, AD001674; Apis mellifera—AF004169, AF004168) opsin sequences. The best-fit model of protein evolution was determined using ProtTest v1.4 (Abascal et al., Reference Abascal, Zardoya and Posada2005) and an amino acid maximum likelihood tree was reconstructed using PhyML (Guindon & Gascuel, Reference Guindon and Gascuel2003; Guindon et al., Reference Guindon, Lethiec, Duroux and Gascuel2005). Branch support values were estimated from 100 PhyML bootstrap replicates as bootstrap proportions (BP). BP values greater than or equal to 70% were considered strong support for a clade (Hillis & Bull, Reference Hillis and Bull1993).
RESULTS
Electrophysiology
SPECTRAL SENSITIVITY
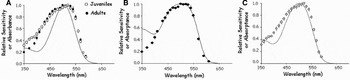
Dark-adapted spectral sensitivity curves were calculated for 11 juvenile Gnathophausia ingens, normalized to the maximum value, and combined into an average dark-adapted spectral sensitivity curve. These data were similar to the dark-adapted spectral sensitivity curve measured from 21 adult Gnathophausia (Figure 1A). The latter includes data from an earlier publication (Frank & Case, Reference Frank and Case1988b), together with additional data (N = 4) obtained in the current study. The two data sets are virtually superimposable at wavelengths greater than 410 nm, but there is a substantial deviation between adult and juvenile spectral sensitivity at the lower wavelengths. The UV:SensMax ratio was significantly higher for the juveniles compared to the adults (Kruskal–Wallis test, P = 0.0003), indicating that in the dark-adapted eye, juveniles have significantly higher sensitivity to ultraviolet (UV) wavelengths than the adults. The dark-adapted spectral sensitivities of both adults and juveniles were best fit with a 505 nm rhodopsin visual pigment absorbance template (Figure 1A). The spectral sensitivities of both life history stages are considerably broader than the absorbance template, which may be due to self-screening by the visual pigment.
In order to examine the potential effects of self-screening on spectral sensitivity, the best-fit absorptance functions (Govardovskii et al., Reference Govardovskii, Fyhrquist, Reuter, Kuzmin and Donner2000) were calculated for the spectral sensitivity data assuming a specific absorbance of approximately 0.008/μm (Cronin & Forward, Reference Cronin and Forward1988) and mean rhabdom lengths of 165 µm for the adult stages (Whitehill, Reference Whitehill2007), and 71 µm for the juvenile stages (Figure 1B, C). A rhodopsin visual pigment with a 502-nm λmax provided the best fit in both cases.
Spectral sensitivity in dark-adapted juvenile and adult Gnathophausia ingens. Data points represent mean values±SE for 21 adults (•) and 11 juveniles (□). (A) A rhodopsin with a relative absorbance peak at 505 nm (solid line) provided the best fit for both data sets; (B) relative absorptance was calculated using an optical density of visual pigment of 0.008/μ and mean rhabdom length of 165 µ for the adults. A rhodopsin with an absorbance maximum at 502 nm provided the best fit to the ERG data; (C) relative absorptance was calculated using an optical density of 0.008/μ and a rhabdom length of 71 µm for the juveniles. A rhodopsin with an absorbance maximum at 502 nm provided the best fit to the ERG data.

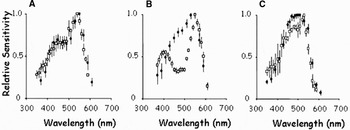
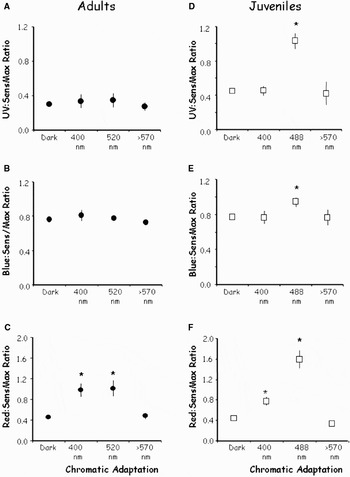
Chromatic adaptation with a 400 nm adapting light converted the original single-peaked sensitivity functions of dark-adapted individuals to a bimodal curve in both juveniles and adults, with a shoulder at 450 nm, and a sensitivity peak at 550 nm (Figure 2A). Only the red:SensMax ratio was significantly different from the ratio in the dark-adapted eye in both juveniles and adults (Figure 3C, F), indicating that both the adults and juveniles had significantly greater relative red sensitivity under 400 nm chromatic adaptation than in the dark-adapted eye. Under 488 nm chromatic adaptation, the spectral sensitivity of the juveniles exhibited two pronounced peaks, at 410 nm and 550 nm (Figure 2B). The UV:SensMax, blue:SensMax and red:SensMax ratios were significantly greater under 488 chromatic adaptation than in the dark-adapted eye (Figure 3D–F). The effect of 520 nm chromatic adaptation on the adults, reported in an earlier study, and superimposed here on the juvenile spectral sensitivity data (Figure 2B), was substantially less. While peak sensitivity has shifted to 550 nm as in the juveniles, there is no significant effect at the shorter wavelengths, as indicated by a significant difference in only the red:SensMax ratio between the dark-adapted and chromatically-adapted eyes (Figure 3A–C). Red (>570 nm) chromatic adaptation (Figure 2C) had no statistically significant effect on the spectral sensitivity of either the adults or the juveniles (Figure 3A–F).
Effects of chromatic adaptation on adult (•) and juvenile (□) Gnathophausia ingens. Data points represent mean values±SE. (A) Spectral sensitivity under violet chromatic adaptation for 7 adult and 3 juvenile specimens; (B) spectral sensitivity under blue/green chromatic adaptation for 4 adult and 4 juvenile specimens; (C) spectral sensitivity under red chromatic adaptation for 7 adult and 3 juvenile specimens.

Ratios of inverse criterion irradiances as a quantifier of differential spectral sensitivity in adult and juvenile Gnathophausia ingens. Data are means±SE. Ratios under each adapting light were compared to the ratios during dark-adaptation. Asterisks (*) indicate ratios that are significantly different from those measured in the dark-adapted eye. UV range = 350–400 nm; blue range = 410–460 nm; SensMax (sensitivity max) range = 480–530 nm; red range = 550–590 nm. (A–C) Ratio of UV:SensMax, blue:SensMax and red:SensMax in adults in dark-adapted eyes (N = 23) and photoreceptors undergoing 400 nm (N = 7), 520 nm (N = 3) or >570 nm (N = 7) chromatic adaptation. Under 400 nm and 520 nm chromatic adaptation, the red:SensMax ratios were significantly greater than in the dark-adapted eye (P < 0.001, one-way ANOVA). Long wavelength (>570 nm) chromatic adaptation had no significant effect on spectral sensitivity; (D–F) UV:SensMax, blue:SensMax and red:SensMax ratios in juvenile dark-adapted photoreceptors (N = 10) and photoreceptors undergoing 400 nm (N = 3), 488 nm (N = 4) or <570 nm (N = 3) chromatic adaptation. Under 488 nm chromatic adaptation, all the ratios were significantly greater than in the dark-adapted eye (P < 0.001, one-way ANOVA). Under 400 nm chromatic adaptation, only the red:SensMax ratio was significantly greater than in the dark-adapted eye (P < 0.001, one-way ANOVA). Red chromatic adaptation had no significant effect on spectral sensitivity.

RESPONSE WAVEFORMS
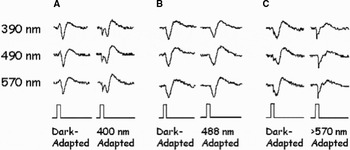
In the dark-adapted eyes of the juvenile stages, the response waveform is a simple, monophasic corneal-negative signal (Figure 4). Under 488-nm chromatic adaptation (Figure 4B), the waveforms remain virtually identical to the dark-adapted waveform, while under a 400-nm adapting light, the waveform becomes biphasic, with a small rapid downward deflection followed by the large corneal negative wave (Figure 4A). Under red chromatic adaptation (Figure 4C), a corneal negative wave with much more rapid kinetics than in the dark-adapted eye now dominates the waveform, followed by the slower positive wave.
Representative examples of response waveforms from Gnathophausia ingens juveniles in dark-adapted and chromatically adapted eyes. Data are from 3 animals. Waveforms are shown for flashes at 390, 490 and 570 nm that evoked a 50 µ criterion response. (A) Response waveforms from the dark-adapted eye, and under 400 nm chromatic adaptation in the same specimen. Under chromatic adaptation, a small secondary wave with a faster latency is visible at all wavelengths; (B) dark-adapted and 488 nm adapted waveforms from another specimen. Blue chromatic adaptation had no effect on waveform; (C) dark-adapted and >570 nm adapted waveforms from another specimen. Under this long wavelength adaptation, the secondary wave visible at under 400 nm chromatic adaptation now dominates the response waveform.

Microspectrophotometry
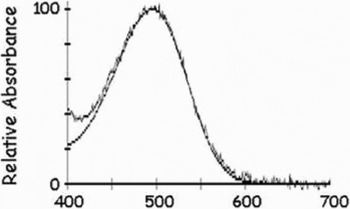
The average difference spectra for photobleaching from 19 adult rhabdoms were best fit by a rhodopsin template peaking at 493 nm, while those from 14 juvenile rhabdoms were best fit by a rhodopsin template at 498 nm, but these differences are not statistically significant (t-test, P > 0.05). When the two data sets are combined, the average difference spectra from 30 rhabdoms are well fit by a 495-nm rhodopsin template (Figure 5). The difference between the peak absorbance of the MSP generated rhodopsin absorbance template (495 nm) and the peak of the best-fit absorptance template (calculated using a least sum of squares fit to the spectral sensitivity data, the presumed optical density of visual pigment, and the measured average rhabdom length) is small enough to be attributed to differences in methodology, but may also be due to the presence of screening pigments (see below and Discussion).
Microspectrophotometry data on visual pigment absorbance. Jagged line shows the average difference spectra from juvenile and adult rhabdoms (N = 30). The data were best fit by a 495 nm rhodopsin absorbance template (smooth line).

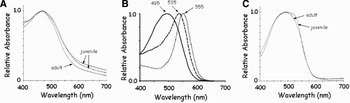
The absorbances of ommochrome screening pigments that were present between the crystalline cones in both adult and juvenile eyes were also measured (Figure 6A), and these pigments were found to have relatively low absorbance at the red end of the spectrum. These data were used to model how the movements of these pigments in position over the rhabdoms would affect spectral sensitivity at several densities, based on the methods of Snyder et al. (Reference Snyder, Menzel and Laughlin1973) as described in Materials and Methods. The calculated spectral sensitivities of the eye without screening pigment, and then in the presence of filtering pigments of optical densities of 1.0 and 2.0 are shown in Figure 6B. The peak spectral sensitivity was shifted from 495 nm in the dark-adapted eye to 535 with a screen OD of 1.0, and 555 with a screen OD of 2.0.
(A) Absorbance spectra from ommochrome screening pigments present at the base of the rhabdoms; (B) effect of different densities of screening pigment on spectral sensitivity. Solid line—calculated spectral sensitivity of a photoreceptor containing a rhodopsin visual pigment with a 495 λmax. Dashed line—calculated spectral sensitivity of the same photoreceptor with the ommochrome screening pigment filtering the light at an optical density of 1.0. The calculated peak spectral sensitivity is now at 535 nm. Dotted line—calculated spectral sensitivity with the ommochrome screening pigment present at an optical density of 2.0. The calculated peak spectral sensitivity is at 555 nm; (C) absorbance spectra from red basal pigment below the basement membrane.

In addition to the distal screening pigment, the absorbance of a red pigment, found below the basement membrane in fresh eyes of both adults and juveniles, was measured and found to have lower absorbance at both the short and long ends of the spectrum (Figure 6C).
Opsin sequences
Opsin sequences were isolated from two juvenile and two adult Gnathophausia ingens, and representative sequences were deposited in Genbank (accession numbers EU729701–EU729704). The isolated retinal opsin transcripts extended from the end of transmembrane helix I through the end of the gene and the 3′ untranslated region (UTR). Because the C-terminus of the opsin protein and the 3′ UTR are highly variable and therefore unalignable, only the 254 AA residues encompassing transmembrane helix I through helix VII were included in subsequent phylogenetic analyses. All of the recovered opsin sequences contained sequence features typical of invertebrate opsins, including a tyrosine at the vertebrate counterion site (bovine site 113) and a glutamic acid at bovine site 181.
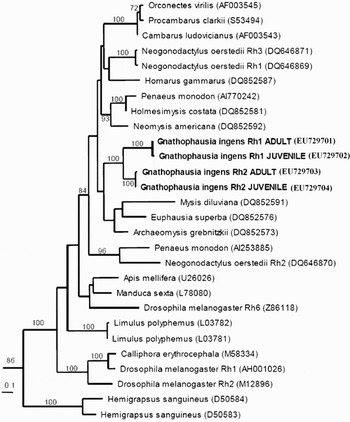
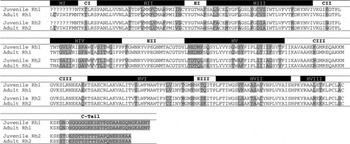
Two different opsin transcripts, here named Rh1 and Rh2, were retrieved from both juvenile and adult G. ingens (Table 1). Within each of the Rh1 and Rh2 sequence groups, amino acid similarity (including allelic and inter-individual variation) ranged between 94–100%, while between group similarities were 66–78%. A single sequence was chosen to represent adult and juvenile Rh1 and Rh2 transcripts for phylogenetic analysis, where all of the G. ingens sequences clustered with other crustacean (Mysida, Decapoda, Euphausiacea and Stomatopoda) middle-wavelength opsins (Figure 7). The G. ingens Rh1 and Rh2 sequence types also clustered with each other with strong support (BP = 100).
Maximum likelihood amino acid phylogeny of crustacean and insect middle wavelength opsin sequences. Genbank accession numbers are in parentheses following each species name. The tree was rooted using vertebrate (bovine rhodopsin; human melanopsin—6693700), cephalopod (Sepia officinalis—AF000947), and insect short wavelength sensitive (Drosophila melanogaster Rh3—M17718, Rh4—AH001040, and Rh5—U67905; Manduca sexta—L78081, AD001674; Apis mellifera—AF004169, AF004168) opsin sequences (not shown). Numbers above branches indicate bootstrap support from 100 replicates.

Comparison of adult and juvenile Gnathophausia ingens Rh1 and Rh2 opsin amino acid sequences. Residues where the Rh1 and Rh2 sequences differ are coloured grey. The major opsin domains (transmembrane helices, HI–VIII; cytoplasmic loops, CI–III; extracellular loops, EI–III) are indicated above the sequences.

DISCUSSION
The spectral sensitivity of deep-living adult Gnathophausia ingens was first examined in 1988 (Frank & Case, Reference Frank and Case1988b), and the unusual results left some questions concerning how many visual pigments were present in this species. Those data, together with more recent evidence for ontogenetic changes in visual pigment complements in fish (see Beaudet & Hawryshyn, Reference Beaudet, Hawryshyn, Archer, Djamgoz, Loew, Partridge and Vellerga1999; Shand et al., Reference Shand, Hart, Thomas and Partridge2002 for review) and a vent crab (Jinks et al., Reference Jinks, Markley, Taylor, Perovich, Dittel, Epifanio and Cronin2002), led to the suggestion that the anomalous data were due to the retention of a small amount of ‘juvenile’ visual pigment (with a longer absorption maximum) in the adult eye, which had its own visual pigment with a shorter absorption maximum.
The results presented here show that the spectral sensitivities of the dark-adapted juvenile and adult photoreceptors are identical at longer wavelengths, but the spectral sensitivity of the juveniles is significantly higher than that of the adults at wavelengths between 350–400 nm. However, chromatic adaptation does not shift the spectral sensitivity in a manner consistent with the presence of both long and short wavelength sensitive visual pigments in the juvenile stages. The effects of 488 nm chromatic adaptation suggest that two visual pigments are present in the juveniles, with a sensitivity maximum appearing at 550 nm and a secondary peak appearing at 410 nm. However, long-wavelength (570 nm) chromatic adaptation, which should have suppressed the response to a long wavelength (550 nm) pigment and enhanced the response to a short wavelength pigment if these two pigments were present (Goldsmith & Fernandez, Reference Goldsmith and Fernandez1968; Wald, Reference Wald1968; Frank & Case, Reference Frank and Case1988a), had no significant effect on the shape of the spectral sensitivity curve, similar to what had been found in the adults in the earlier study (Frank & Case, Reference Frank and Case1988b).
Additional data inconsistent with the presence of both long and short wavelength visual pigments come from MSP measurements of the main rhabdom in juveniles and adults, which revealed the presence of a single, 495-nm λmax, pigment. While some crustaceans possess UV-sensitive visual pigments in a distal rhabdom formed by a small 8th retinula cell (Cummins et al., Reference Cummins, Chen and Goldsmith1984; Frank & Case, Reference Frank and Case1988a; Cronin & Frank, Reference Cronin and Frank1996), and the presence of this secondary pigment has been missed by MSP measurements in the past (Cummins & Goldsmith, Reference Cummins and Goldsmith1981; Cummins et al., Reference Cummins, Chen and Goldsmith1984), electron microscopy of the photoreceptors of both juveniles and adult Gnathophausia ingens demonstrate that neither an 8th retinula cell or a distal rhabdom is present in either life history stage (Whitehill, Reference Whitehill2007).
Within each class (e.g. Rh1 and Rh2), the opsin sequences from adults and juveniles were nearly identical and support the conclusion that both the juveniles and adults have the same set of visual pigments with long wavelength absorption maxima. As Gnathophausia does not have a distal rhabdom, the two transcripts found in both juvenile and adult retinas must be expressed in the main rhabdoms. This is similar to what was found in the retinal photoreceptors of the crab Hemigrapsus sanguineus, which have a single sensitivity peak near 480 nm, suggesting the presence of one spectral class of visual pigment, yet two opsin transcripts are expressed in the main rhabdom (Sakamoto et al., Reference Sakamoto, Hisatomi, Tokunaga and Eguchi1996). (Crabs in general, in fact, show no spectral evidence of multiple visual pigments (Cronin & Forward, Reference Cronin and Forward1988).) The amino acid similarity is also comparable between the two G. ingens opsins (66–78%; Table 1) and the two H. sanguineus opsins (75%). The recovery of the same two opsin transcripts from both adult and juvenile G. ingens indicates that there is no ontogenetic change in visual pigment complement between life history stages. Future studies will be aimed at determining if there is a change in levels of expression of the two opsins between adult and juvenile G. ingens that may contribute to the observed spectral differences of the ERG data. However, a more viable explanation for these differences is that some type of pre-retinal filtering is occurring.
Histological sections show that distal (probably ommochrome based) screening pigments are present in both the juvenile and adult photoreceptors (Whitehill, Reference Whitehill2007), and MSP measurements of the absorbance characteristics show that these pigments have very low absorbance at the red end of the spectrum (Figure 6A). The anomalous changes in spectral sensitivity under three different adapting lights may result from the presence of varying densities of this red-leaky screening pigment, which may migrate upon light adaptation and serve to filter the light entering the rhabdoms. The MSP data indicate that the visual pigment of Gnathophausia ingens is best fit by a 495 nm rhodopsin template. If we assume that the ommochromes in the distal screening pigment act as filter pigments with an optical density of 1.0, filtering the light before it reaches the rhabdoms during light-adaptation, the modelled effect on spectral sensitivity would be to shift the spectral sensitivity peak to 535 nm (Figure 6B). Increasing the optical density to 2.0 results in a further shift in spectral sensitivity to 555 nm. Looking at the ERG data, the peak sensitivity shifted to 540–550 nm in both juveniles and adults under violet and blue adaptation (Figure 2A, B), suggesting that migrating red-leaky screening pigments are responsible for the spectral sensitivity shift in the light-adapted eyes. This is similar to what has been found in several shallow living crayfish, crab and mysid species (Kennedy & Bruno, Reference Kennedy and Bruno1961; Goldsmith & Fernandez, Reference Goldsmith and Fernandez1968; Wald, Reference Wald1968; Goldsmith, Reference Goldsmith1978; Stowe, Reference Stowe1980; Bryceson, Reference Bryceson1986; Cronin & Forward, Reference Cronin and Forward1988; Jokela-Määttä et al., Reference Jokela-Määttä, Pahlberg, Lindström, Zak, Porter, Ostrovsky, Cronin and Donner2005).
Ommochrome screening pigments have been shown to have antioxidant properties, which appear to reduce the susceptibility to light damage (Lindström & Nilsson, Reference Lindström and Nilsson1988; Lindström et al., Reference Lindström, Nilsson and Meyer-Rochow1988; Dontsov et al., Reference Dontsov, Fedorovish, Lindström and Ostrovsky1999). However, their presence also removes 90% or more of the blue light that is best absorbed by the visual pigments (Jokela-Määttä et al., Reference Jokela-Määttä, Pahlberg, Lindström, Zak, Porter, Ostrovsky, Cronin and Donner2005). Since there appears to be no functional reason for the deep-living adult stages to have a screening pigment that would block ambient light in such a photon limited environment, it is likely that this screening pigment is vestigial (presumably a carry-over from the juvenile stages). The daytime depth-range of Gnathophausia ingens juveniles is between 175–250 m, where movement of screening pigment to filter ambient light during the day would be a distinct advantage. The effects of chromatic adaptation on spectral sensitivity were significantly greater in juveniles than in adults, which can be attributed to a greater density of screening pigment/μm of rhabdom in juveniles versus adults, due to the smaller size of the juvenile eye. In addition, the MSP-generated rhodopsin template peak (495 nm) is very close to that of the best-fit absorptance function (based on a 502-nm rhodopsin) calculated for the spectral sensitivity data. Since the peaks of these two curves are so close, and the absorptance template curve is an almost perfect fit to the spectral sensitivity data from the adults, the dark-adapted spectral sensitivity in G. ingens adults appears to be due to rhodopsin alone, without interference by screening pigment. This suggests that the pigment screen remains retracted in the absence of light and therefore would not significantly attenuate light intensity in this position, where it presumably always remains in the adults. This inference is supported by histological data showing that there were no differences in the position of screening pigments between animals (both juvenile and adult stages) collected and fixed under dim red light during the day or at night (Whitehill, Reference Whitehill2007).
Sensitivity to short wavelength light is significantly greater in the juveniles than in the adults in the dark-adapted eye (Figure 1A), suggesting that even in the dark-adapted eye, some form of filtering is already occurring. However, this requires the presence of a screening pigment that had low absorbance at the UV end of the spectrum. The appearance of a secondary UV spectral sensitivity peak under blue chromatic adaptation in the juveniles (as well as the appearance of a short wavelength shoulder under UV chromatic adaptation) also indicates that a migrating screening pigment with low absorbance to UV wavelengths is present. MSP measurements on the distal ommochrome screening pigment did not extend below 400 nm, but here the absorbance was still very high (~80% of the peak absorbance). However, there is a basal red pigment present in the eye beneath the basement membrane, visible in unfixed eyes (Cronin & Frank, personal observation). This pigment has substantially less absorbance (~40%) at 400 nm than at 500 nm, and pre-retinal filtering of light would take place if this pigment migrated over the rhabdoms under light adaptation. Stowe (Reference Stowe1980) found that a red basal pigment, with low absorbance at both violet and red wavelengths, migrated up to one-third of the way along the retinula cells under fairly strong light adaptation in the crab Leptograpsus, and the secondary peak in sensitivity at 380 nm that arose under bright light adaptation was attributed to the migration of this pigment. Unfortunately, the position of this pigment could not be determined in Gnathophausia because it disappeared during fixation (Whitehill, personal communication). A similar dissolution of basal red pigment during fixation was reported for several species of shallow and deep living mysids (Elofsson & Hallberg, Reference Elofsson and Hallberg1977; Hallberg, Reference Hallberg1977; Hallberg et al., Reference Hallberg, Anderson and Nilsson1980), where it was attributed to the possibility that this pigment consists of less stable carotenoids. However, based on the spectral sensitivity data, it appears likely that filtering by this pigment is responsible for the UV peak in juvenile G. ingens under blue light adaptation. No such UV peak is found in the adults under chromatic adaptation, which could be due to a lower density of this screening pigment per unit area than in juveniles, as this would diminish the effects of a UV-leaky screening pigment during chromatic adaptation. We propose that production of screening pigments ceases as the juveniles migrate into deeper waters, such that the increase in eye size as the animals increase in body length would reduce the density of screening pigment in the eye, providing a possible explanation for the differences in spectral sensitivity between the juvenile and adult life history stages.
The differential effects of violet, blue and red chromatic adaptation on spectral sensitivity are more difficult to explain. Both violet and blue adaptation shifted the sensitivity peak from 500 nm to 550 nm, and a secondary peak at 410 nm also appeared under blue chromatic adaptation in juveniles. Red chromatic adaptation, on the other hand, had no significant effect on spectral sensitivity even though the irradiances of all the adapting lights were adjusted to elicit the same decrease in sensitivity (i.e. the irradiance required to elicit a 50 µV test flash at 490 nm increased by 2 log units). Wavelength specificity in controlling screening pigment migration has been described for the moth Deilephila (Hamdorf & Höglund, Reference Hamdorf and Höglund1981), as well as the crayfish Procambarus (Olivo & Chrismer, Reference Olivo and Chrismer1980), and our data suggest that exposure to violet and blue light may elicit greater pigment migration than exposure to red light.
The dark-adapted response waveform in both juveniles and adults is a smooth monophasic response at all wavelengths tested, with a small hitch present occasionally in responses to long wavelength light. Upon chromatic adaptation to violet and red light, a hitch (adults—Frank & Case, Reference Frank and Case1988b) and secondary wave (juveniles—Figure 4A, C) is present at all wavelengths. Under blue chromatic adaptation, the waveforms in the juveniles were identical to those recorded from the dark-adapted eye (Figure 4B). In the adults, a small hitch appeared at all wavelengths under blue chromatic adaptation, similar to what occurred under red adaptation (Frank & Case, Reference Frank and Case1988b). However, the filter used for the experiments with the adults was a 520 nm broadband filter (FWHM = 90 nm), which had substantial output in the red wavelengths, whereas the filter used with the juveniles was a 488 nm interference (FWHM = 10 nm), and this difference in spectral output could be responsible for the hitch visible in the adult waveforms. Regardless, the waveform anomalies described here have not been reported before in crustaceans that possess a single visual pigment (Wald, Reference Wald1968; Goldsmith & Fernandez, Reference Goldsmith and Fernandez1968; Frank & Case, Reference Frank and Case1988b; Frank & Widder, Reference Frank and Widder1999), nor are they consistent with what has been reported for crustaceans with two visual pigments (Chapman & Lall, Reference Chapman and Lall1967; Goldsmith & Fernandez, Reference Goldsmith and Fernandez1968; Wald, Reference Wald1968; Wald & Seldin, Reference Wald and Seldin1968; Frank & Case, Reference Frank and Case1988a). Our data suggest that these waveform anomalies are due to the presence of violet leaky and red leaking screening pigments because: (1) the anomalies are only seen in the presence of violet or red adapting lights; (2) spectral sensitivity data indicate that violet and red leaky screening pigments are migrating during light adaptation; and (3) the effects of chromatic adaptation on the waveforms are greater in juveniles, with a proposed greater density of screening pigment, than in the adults. However, the mechanism that would produce such anomalies is currently unknown. In flies, differences in response waveforms to short and long wavelength light, together with changes in response waveforms under chromatic adaptation were attributed to the effects of a red leaky screening pigment on the off/on response in insect retinal action potentials. In these animals, red sensitivity resulted from an increase in the size of the on/off effects, which are primarily due to contributions from the optic ganglia (Goldsmith, Reference Goldsmith1965). However, in crustaceans, the ERG is nearly a pure receptor response (Naka & Kuwabara, Reference Naka and Kuwabara1956; Goldsmith, Reference Goldsmith1960; Goldsmith & Fernandez, Reference Goldsmith and Fernandez1968), and on/off effects are not visible in near-threshold ERG responses, so this does not provide a suitable explanation for the waveform anomalies.
In summary, the data reported here show an unusual situation in the G. ingens visual system. First, two opsin transcripts were found to be expressed in G. ingens photoreceptors. The recovery of a single MSP absorbance peak suggests that these pigments have similar spectral absorbance characteristics. Second, the spectral sensitivity of this deep-living crustacean is significantly affected by the presence of a migrating screening pigment shield. This has often been reported for shallow water crustaceans, but has not been seen before in a deep-living species. Gnathophausia ingens is an ontogenetic migrator, and it is possible that the screening pigment in the deep-living adults is simply a carry-over from the shallow-living juvenile stages. While spectral sensitivity shifts resulting from screening pigment migrations have not been seen in the adults of other ontogenetically migrating species that have been studied to date (Frank & Case, Reference Frank and Case1988b; Frank & Widder, Reference Frank and Widder1999, Myslinski et al., Reference Myslinski, Frank and Widder2005), G. ingens has an unusually long lifespan for a pelagic crustacean. The females live approximately 8.1 years (Childress & Price, Reference Childress and Price1978), compared to 1–3 years for euphausiids (Mauchline & Fisher, Reference Mauchline and Fisher1969; Smiles & Pearcy, Reference Smiles and Pearcy1971; Mauchline, Reference Mauchline, Anderson and Zhuranec1977; Lindley, Reference Lindley1982), 60–400 days for shallow-living mysids (Clutter & Theilacker, Reference Clutter and Theilacker1971; Mauchline, Reference Mauchline1972), 12–15 months for sergestids (Pearcy & Forss, Reference Pearcy and Forss1969; Omori, Reference Omori1974) and 1–4 years for oplophorids (Aizawa, Reference Aizawa1974; Omori, Reference Omori1974; Ziemann, Reference Ziemann1975). The shallow living juveniles spend approximately 188 days between 175 and 250 m, and while there is sparse data for pelagic crustaceans in general, in the few species that have been studied to date, the juvenile stages last less than 3 months (Clutter & Theilacker, Reference Clutter and Theilacker1971; Omori, Reference Omori1974). Therefore, it may be that in this long-living species, the juveniles spend significant amounts of time in brighter surface waters, where the possession of screening pigments provides a benefit for survival.
As mentioned above, adults of other species of ontogenetically migrating crustaceans that have been studied to date do not appear to have migrating screening pigments, but the juveniles of these species have not been studied. It may be that they also possess some migrating screening pigments, which either disappear in the adults or are present in such low densities that they do not have a significant effect on spectral sensitivity in adult stages. Resolving this question will be required in order to predict the effects that changes in the ambient light field, such as an increase in turbidity due to pollution, will have on juvenile survivorship and hence the size of the stock population of these species.
ACKNOWLEDGEMENTS
We thank the captains and crews of the RV ‘New Horizon’ and RV ‘Wecoma’ for their invaluable help with animal collections. This work was supported by grants from the National Science Foundation to T. Frank (IBN-0343871) and T. Cronin (IBN-0235820). This study is Harbor Branch Oceanographic Institution Contribution No. 1699.