In President Obama's words, the Democratic Party experienced a “shellacking” in the 2010 elections. In particular, the net loss of 63 House seats was the biggest midterm loss suffered by a party since 1938—the largest in the lifetimes of approximately 93% of the American population.Footnote 1
But while many pundits and commentators outside the academy saw the “wave” coming, predicting the loss of 60 or more seats, political science forecasters erred badly on the low side of predictions.Footnote 2 In a symposium published in the October 2010 issue of PS, a number of prominent scholars reported the results of five forecasting models estimated in the summer of 2010. Their forecasts appear in table 1.
Forecasters' Predictions of 2010 Democratic Seat Losses

Campbell and the Bafumi-Erikson-Wlezien team came the closest to reality, underpredicting the actual seat loss by about 20%. Abramowitz underpredicted by nearly half, and Cuzan and the Lewis-Beck–Tien tandem did even worse. (We discuss the independent Hibbs model, published as a working paper, later.) Of course, the estimates from these models were based on a small number of observations and had relatively large standard errors, but all were underestimates and appear to have exceeded the prediction errors in previous elections.
Moreover, it is clear from the commentary accompanying the forecasts that most of the authors were more concerned about overpredicting the Democratic losses than underpredicting them. Abramowitz wrote that “in what might be considered a worst-case scenario for Democrats, if President Obama's net approval rating was to fall 20 points and Republicans were to gain a 10-point lead on the generic ballot, Democratic losses would be expected to reach 54 seats in the House” (Reference Abramowitz2010, 632). Obama's approval rating did not drop 20 points and the Republican lead on the generic ballot did not reach 10 points, but the actual November losses still exceeded Abramowitz's worst-case scenario by nine seats.
Similarly, the Bafumi-Erikson-Wlezien team discussed reasons why their predictions might have been too high, but not too low:
The tilting toward the out-party may thus have been realized earlier than in the past. It also is possible that an unusually conservative Republican campaign could dampen the expected shift toward the Republicans. If either of these possibilities is true and the polls remained unchanged through November, the Democrats actually could have the edge come Election Day.
(Reference Bafumi, Erikson and Wlezien2010, 635)Not to be outdone in underpredicting the outcome, Lewis-Beck and Tien reported the prediction errors of their forecasts in previous elections and concluded:
The average error over this series equals 13. Let us take the extreme possibility and posit that our model underestimated Democratic losses by the full 13. In that case, Democratic losses would climb to 35 seats, still short of a Republican takeover. We believe this extreme scenario to be very unlikely to occur. In sum, the Democrats should keep their House majority.
(Reference Lewis-Beck and Tien2010, 638)Thus, the 63-seat loss in the House exceeded even the “worst-case scenarios” and “extreme possibilities” conjured up by the forecasters. The situation is reminiscent of the forecasters' failure in 2000 when the consensus prediction of a comfortable victory for Al Gore went awry (Campbell Reference Campbell2001, 36). In this article, we report some simple analyses that shed light on the 2010 Democratic shellacking and why the forecasters missed it.
Election Specific Factors
We agree with Lewis-Beck and Tien's contention (Reference Lewis-Beck and Tien2010, 637) that many forecasting models opt for prediction over explanation by including variables that track the evolving campaign without explaining it. Reliance on the generic ballot is the clearest example of this tendency: it should not be terribly surprising that vote intention is a fairly good predictor of vote.Footnote 3 Hibbs' (Reference Hibbs2010) position is even purer than that of Lewis-Beck and Tien. He rejects not only “trend and time-coded variables,” which lack theoretical foundation (8), but also any variables based on survey data, on the grounds that they are endogeneous to the fundamental factors that shape the campaign. Hibbs' model includes three variables—a weighted average of the growth in real disposable income per capita during the eight quarters that Congress sits, the presidential vote two years earlier (to capture “balancing” notions), and House seats won in the previous election (to capture incumbency effects). Hibbs interprets his estimates as measures of the political climate that faces any Democrat and Republican in that election. Departures from the estimate suggest that election-specific factors are at work (e.g., Bill Clinton's personal ratings in 2000).Footnote 4 Given the prediction of a 45-seat loss, Hibbs' model suggested that other factors operating in the 2010 election might have generated a loss that was almost 50% greater than would have been expected, had only the fundamental factors been at work.
What other factors might have been operating in the 2010 election? One obvious candidate is the behavior of individual incumbents. In the 1970s and 1980s, some scholars argued that diligent constituency service had created an incumbency advantage that enabled members to partially insulate themselves from national tides. But while such behavior can explain an overprediction of seat losses, it does not help to explain an underprediction of the kind that occurred in 2010.
Another less-studied factor is the roll-call voting behavior of members. Postmortems of the 1994 Congressional elections—another instance of seat underprediction—found that in contrast to earlier research, roll-call voting records had a significant impact on members' electoral fortunes. Jacobson (Reference Jacobson1996) reported that votes in favor of the Clinton budget and NAFTA had a significant negative impact on Democrats' electoral margins, as did an index of support for the administration on key votes. Ferejohn (Reference Ferejohn and Weir1998) showed that support for the crime bill (which included “midnight basketball” and an assault weapons ban) and the 1993 Clinton budget hurt Democratic incumbents, while opposition to Clinton's proposal to allow gays to serve in the military helped the same candidates. In a more comprehensive study, Canes-Wrone, Brady, and Cogan (Reference Canes-Wrone, Brady and Cogan2002) revisited the electoral record from 1956 to 1996 and found that in each of 20 elections, roll-call extremity had a negative effect on House incumbent electoral margins.
Given the huge amount of media coverage of several key votes in the 111th Congress and the importance played by two in particular—health care and cap and trade—we have built on earlier studies to conduct an analysis of the effects of roll-call votes on the 2010 electoral fortunes of members of Congress. The results suggest that the forecasting models would have been considerably closer to the mark if Democrats had voted differently on these two key votes, or, perhaps more realistically, had those votes never been scheduled.Footnote 5
The Perils of Position Taking
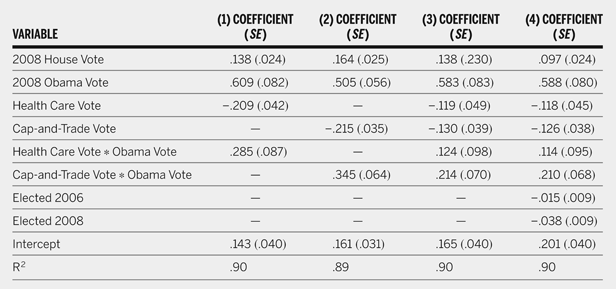
Table 2 reports estimates of a series of regressions based on 231 Democrats who sought reelection in 2010 and faced a challenger (four unopposed incumbents were omitted). Each equation includes the member's percentage of the two-party vote in 2008 as a measurement of his or her personal electoral situation, as well as the percentage of the vote that Obama received in the district in 2008 as a measurement of constituents' support for Obama. Because support for Obama's agenda should vary positively with the partisan composition of a district, we include not only dummy variables for the final votes on health care and cap and trade, but also interactions between the votes and Obama's 2008 percentage.Footnote 6
Impact of Key Roll Call Votes on House Democrats' 2010 Electoral Margins (OLS)

Note. For all, N = 231.
Given the correlation between the two votes, we enter each separately in the regressions reported in the first two columns of the table.Footnote 7 The coefficients on the roll calls and their interactions with Obama's 2008 vote are easily significant at conventional levels. Coefficients on the interactions indicate that support for the two bills did not have a positive electoral effect until Obama's 2008 vote in a district reached 72% for health care and 62% for cap and trade. Thus, a positive vote on health care appears to have had a negative impact on members' vote shares in all but the most heavily Democratic districts. The third column of table 2 reports a specification that includes both the health care and cap and trade votes. Given the rarity of members who voted for one bill but not the other, the resulting estimates are less precise, and the health care vote interaction term loses significance. However, taking these votes into account simultaneously suggests that the health care vote was at least slightly harmful for all Democrats, regardless of Obama's 2008 vote percentage in their districts, whereas the point at which the cap and trade vote had a positive rather than negative effect for Democrats remained about the same, at a 2008 Obama vote percentage of 60%.Footnote 8
Despite the noteworthy defeats of several long-serving members, newer members suffered disproportionately in the 2010 elections, with 21 of 24 members of the class of 2008 being defeated at the polls and 11 of 21 members of the class of 2006 losing as well. Thus, an additional hypothesis is that newer members were particularly vulnerable in the 2010 elections. These individuals may have been more likely to be targeted by the opposition than more senior members, with other things being equal. It is also possible that their votes per se did not hurt them as much as their lack of time to build up solid bases of support in their districts. The fourth column of table 2 includes dummy variables for the two most recently elected classes. The coefficients indicate that members elected in 2008 suffered an almost 4% sophomore slump over and above their roll-call votes, but the coefficients on the latter scarcely change. In sum, the health care and cap and trade votes were electorally damaging to less senior and more senior members alike, but freshmen were particularly vulnerable to the Republican tide.Footnote 9
How damaging? We simulated a counterfactual Congress in which all Democrats had perfect foresight. Based on the fourth specification in table 2, all those Democrats who came from districts with 2008 Obama votes of less than 60% should have voted against cap and trade and health care. All of those Democrats who came from districts with 2008 Obama votes of 60% or more (i.e., all remaining Democrats) should have voted for cap and trade and against health care. The results suggest that about 40 of these incumbents would have increased their margins from losing to winning, easily enough to save the Democratic majority.
As a check on these results, we estimated the same equations using dichotomous probit (win, lose) rather than OLS. These results are displayed in table 3. The coefficient patterns are very similar to those in table 2, although with both votes entered simultaneously (columns 3 and 4), the probit estimates are less precise than the OLS ones. Again, using the specification outlined in the fourth column to simulate a Congress in which Democrats voted with foresight, we estimate that the Democrats would have lost 22 fewer seats, not quite enough to save their majority but producing an overall number very close to Hibbs' estimate.
Impact of Key Roll Call Votes on House Democrats' 2010 Probability of Reelection (Probit)

Note. For all, N = 231.
Finally, we also inserted a preprocessing with matching step before estimating the regressions and probits.Footnote 10 Simulations based on the resulting estimations reduce the hypothetical seats-saved figure from 40 to 31 in the regression analysis and increase it from 22 to 26 seats in the probit analysis.Footnote 11 In sum, four alternative simulations of a Democratic majority that voted differently on health care and cap and trade produce estimates of the number of seats saved between 22 and 40, strongly suggesting that the votes in question cost the Democrats their majority.
Interpreted literally, these results suggest that had House Democrats voted down health care and cap and trade legislation, then their 2010 seat loss would have been much closer to the numbers predicted by the forecasting models. The problem with conclusions based on counterfactuals, of course, is that the ceteris paribus assumptions underlying such exercises are implausible. Voting nay on these bills would have created a different electoral environment with its own risks. We must also consider why members might cast highly damaging votes. One possibility is that these members miscalculated, believing that votes for health care and cap and trade would be electorally helpful or at least not sufficiently damaging to imperil their reelections. A second possibility is that these individuals understood the likely consequences of their votes but believed strongly enough in the rightness of their actions to become willing to accept the electoral consequences. A third possibility is that these votes were the best options available to them. Members who voted against these key party issues might have provoked a primary challenge or enough defection from the Democratic base to defeat them. Additionally, the dramatic failure of core Democratic priorities might have resulted in diminished support for President Obama in particular and the Democratic Party in general, again resulting in defeats. Casting highly visible, controversial votes may have been the best of a number of bad options facing vulnerable Democrats.
Discussion
In retrospect, the real problem for many House Democrats was most likely the Democratic agenda. Numerous commentators, including some Democrats, claimed that the Obama administration should have focused exclusively on jobs and the economy, the two problems that polls indicated were of most concern to the larger electorate, although not to the Democratic base (Gorenstein Reference Gorenstein2010). To be sure, putting health care and energy on the back burner would have frustrated strong Democrats, but possibly no more than the defeat of cap and trade and the passage of a compromise health care bill did.Footnote 12 Furthermore, a laser-like focus on the economy might have produced smaller losses among independents.
We believe that the reason that presidential forecasting models perform as well as they do is that candidates generally run optimal campaigns, given the fundamentals. Both parties have adequate funding and talent; thus, they do about as well as the fundamentals indicate. For example, Bob Dole did not lose because he ran a poor campaign in 1996; rather, he ran a poor campaign because the fundamentals of peace and prosperity indicated that he was going to lose. When candidates fail to behave optimally given the political context, they perform worse than the models predict (Vavreck Reference Vavreck2009).
When applied to forecasting models of Congressional races, the analogous assumption is that 435 House members will run campaigns that are, on average, optimal (i.e., some Democrats will run poor campaigns, but so will some Republicans). It may be that in 2010, the decisions of the House Democratic leadership shaped a national campaign that, at least ex post, was far from optimal, leading to the significant underpredictions of most forecasting models.