Introduction
The traditional delineation of biogeographical regions in terms of their environmental features, vegetation physiognomies and floristics (Ladle & Whittaker Reference Ladle and Whittaker2011) has increasingly incorporated the perspective of species functional traits, now known as functional biogeography (Kreft & Jetz Reference Kreft and Jetz2010, Violle et al. Reference Violle, Reich, Pacala, Enquist and Kattge2014, Butler et al. Reference Butler, Datta, Flores-Moreno, Chen, Wythers and Fazayeli2017). The rise of global efforts to retrieve open trait data has aided in the development of an important venue for the visualization of macro-structures (i.e., natural biogeographical regions and zones) at both the regional and global scales (Bruelheide et al. Reference Bruelheide, Dengler, Purschke, Lenoir, Jiménez-Alfaro and Hennekens2018, Kattge et al. Reference Kattge, Bönisch, Díaz, Lavorel, Prentice and Leadley2020). For example, a previous study used large databases to estimate community-level trait variation in the global context (Bruelheide et al. Reference Bruelheide, Dengler, Purschke, Lenoir, Jiménez-Alfaro and Hennekens2018). This mapping of trait distribution and dominance over land surfaces has valuable implications for modelling variations in life history, establishing trait–environment relationships and also for shedding light on how ecosystems in distinct regions function in terms of nutrient cycling, carbon storage and climate regulation (Ter Steege et al. Reference Ter Steege, Pitman, Phillips, Chave, Sabatier and Duque2006, Violle et al. Reference Violle, Reich, Pacala, Enquist and Kattge2014, Butler et al. Reference Butler, Datta, Flores-Moreno, Chen, Wythers and Fazayeli2017). The consideration of traits may reveal another complementary dimension in regionalization schemes, as two or more regions with similar floristic or phylogenetic diversities can diverge in trait composition patterns and functioning due to distinct environmental responses (Cardoso et al. Reference Cardoso, Moonlight, Ramos, Oatley, Dudley and Gagnon2021). Functional regionalizations are also important for conservation biology because the effective design of protected areas intended to fully represent a biome’s heterogeneity also depends on the spatial identification of smaller units with distinct functional contents (Ladle & Whittaker Reference Ladle and Whittaker2011, Rickbeil et al. Reference Rickbeil, Coops, Andrew, Bolton, Mahony and Nelson2014). In fact, conservation priorities based on one biodiversity dimension (taxonomy, phylogeny or functioning), often the floristic, may not match the priorities for other dimensions (Mazel et al. Reference Mazel, Pennell, Cadotte, Diaz, Dalla Riva and Grenyer2018, Burbano-Girón et al. Reference Burbano-Girón, Jantke, Molina-Berbeo, Buriticá-Mejía, Urbina-Cardona, Sánchez-Clavijo and Etter2022).
While biological conservation aims at maintaining species diversity and ecosystem functioning, the variation of species richness and endemism has long been emphasized in the establishment of priority areas (Ladle & Whittaker Reference Ladle and Whittaker2011). However, taxonomic features such as species composition and endemism are only indirectly linked to ecosystem functioning, which is in fact sustained by species functional traits (Violle et al. Reference Violle, Reich, Pacala, Enquist and Kattge2014). The Convention on Biological Diversity’s Aichi Target 11 establishes that protected areas should cover 17% of the Earth’s terrestrial surface (CBD 2017). In Brazil, the coverage of protected areas ranges from c. 2.8% in the Pampa to 28% in the Amazon (Pacheco et al. Reference Pacheco, Neves and Fernandes2018). The Brazilian biome with the highest historical deforestation rate is the Atlantic Forest, with only c. 10% of its area protected, despite its status as one of the 34 global biodiversity hotspots (Mittermeier et al. Reference Mittermeier, Turner, Larsen, Brooks, Gascon, Zachos and Habel2011) and one of the three global hotspots most vulnerable to climate change (Bellard et al. Reference Bellard, Leclerc, Leroy, Bakkenes, Veloz, Thuiller and Courchamp2014). Most of these protected areas were created when there was no large knowledge base on the evolutionary history, species functionality and community and ecosystem stability of the biome (Pacheco et al. Reference Pacheco, Neves and Fernandes2018, Sobral-Souza et al. Reference Sobral-Souza, Vancine, Ribeiro and Lima-Ribeiro2018). In addition, more than 70% of protected areas in the Atlantic Forest belong to the sustainable use category, with few restrictions on human activities (Pacheco et al. Reference Pacheco, Neves and Fernandes2018). This has resulted in reduced efficiency for maintaining local biodiversity and an elevated and ongoing loss of biomass, suitable habitats and taxonomic and functional diversity, processes that are expected to intensify in conjunction with climate change (Esser & Neves Reference Esser and Neves2019, Lima et al. Reference Lima, Oliveira, Pitta, Gasper, Vibrans and Chave2020). However, protected areas in Brazil and their surrounding areas are four times less vulnerable to vegetation conversion than unprotected ones (Gonçalves-Souza et al. Reference Gonçalves-Souza, Vilela, Phalan and Dobrovolski2021).
Although these figures indicate challenges for the maintenance of biome biodiversity, important advances in understanding have resulted from investigations into the floristic and phylogenetic macro-structures of the Atlantic Forest (Thomas 2008, Cantidio & Souza Reference Cantidio and Souza2019, Rezende et al. Reference Rezende, Pontara, Bueno, van den Berg, Silva de Miranda, de Oliveira-Filho and Dexter2020). However, although functional macro-structure mapping would help identify natural regions where multiple conservation efforts are either more or less needed, along with taxonomic and phylogenetic structures, such functional mapping is still lacking (Vitória et al. Reference Vitória, Alves and Santiago2019, Brown et al. Reference Brown, Paz, Reginato, Renata, Assis and Lyra2020, Silva et al. Reference Silva, Souza and Vitória2021b). This study investigates the functional regions of the Atlantic Forest, evaluates the degree to which current conservation efforts – represented by the system of protected areas – cover the functional heterogeneity of the biome and discusses where and how further efforts should be directed. Specifically, we address the following questions: (1) what is the diversity and spatial structure of the biome in terms of functional regions and zones (clusters of regions)? And (2) how much heterogeneity in trait functionality is left in forest remnants and protected areas?
Methods
Functional trait data
This study used seven interpolated maps of leaf, wood, seed and plant size variation across the entire Atlantic Forest generated by Silva et al. (Reference Silva, Souza and Vitória2021b), which represent spatially contiguous surfaces of community-level traits weighted by species abundances, hereafter referred to as ‘CWM traits’. The CWM traits of specific leaf area (mm2 mg–1), leaf dry matter content (g g–1), leaf nitrogen content (mg g–1), leaf thickness (mm), wood density (g cm–3), seed dry mass (mg) and maximum plant height (m) were computed based on abundance data regarding 2122 species distributed across 281 local communities. Community data were compiled from bibliographic sources and organized into the Caaporã database, which has been used in a number of recent publications on macroecological patterns of Brazilian and South American biomes (Cantidio & Souza Reference Cantidio and Souza2019, Silva-Souza & Souza Reference Silva-Souza and Souza2020, Silva et al. Reference Silva, Souza and Vitória2021b). Further details on the use of this database in the Atlantic Forest can be found in Cantidio and Souza (Reference Cantidio and Souza2019) and Silva et al. (Reference Silva, Souza and Vitória2021b). Only studies that carried out floristic surveys in well-conserved areas free of long-term human impacts were chosen to create interpolated trait maps by Silva et al. (Reference Silva, Souza and Vitória2021b), which were used in this study to create functional regions and zones.
We also highlight that functional trait data were compiled from public sources such as original papers, doctoral and master’s dissertations and open data from trait databases (TRY, BIEN and DRYAD). In addition, maps of trait variation were produced with the Ordinary Kriging interpolation approach at a cell resolution of 2.5 arc-min (c. 5 km2). It is worth noting that we did not use the CWM trait values computed for 281 communities by Silva et al. (Reference Silva, Souza and Vitória2021b). Instead, we used the interpolated trait maps and the pixel-level information contained in these maps because we were interested in the continuous variation of traits across the biome representing the potential (or theoretical) functional composition of the original Atlantic Forest in its entirety, including deforested areas (see ‘Data analyses’ section). We used trait maps within a regionalization framework, while the pixel-level values obtained from these maps were used for the principal component analysis (PCA). Further details related to the source and collection of trait data, data preparation and methodological procedures were described in Silva et al. (Reference Silva, Souza and Vitória2021b) and stored in the Zenodo repository (Silva et al. Reference Silva, Souza and Vitória2021a).
Data analyses
To identify the functional regions of the Atlantic Forest, we performed a regionalization analysis through the iterative self-organizing data analysis technique (ISODATA), one of the most popular unsupervised classifications in the geosciences (Memarsadeghi et al. Reference Memarsadeghi, Mount, Netanyahu and Moigne2007), using the contiguous surfaces of CWM traits as input bands in ArcGIS version 10.1 (ESRI 2012). The ISODATA algorithm works by clustering n groups of pixels with similar spectral characteristics in the input bands from two until the maximum number of clusters is reached in order to find the best solution for the clusters (Memarsadeghi et al. Reference Memarsadeghi, Mount, Netanyahu and Moigne2007). This requires the suggestion of an initial maximum number of clusters, which was determined using the L-method with 1000 iterations (Salvador & Chan Reference Salvador and Chan2004) following previous studies (Moura et al. Reference Moura, Argôlo and Costa2016, Cantidio & Souza Reference Cantidio and Souza2019, Silva-Souza & Souza Reference Silva-Souza and Souza2020). The L-method is a Euclidean-based procedure running piecewise regressions on repeated k-means partitions applied on a dissimilarity matrix of CWM traits (Salvador & Chan Reference Salvador and Chan2004). This method was performed using the vegan package and the kmeans function of the stats base package (R Core Team 2020). The L-method suggested the existence of 18 regions, and this value was entered in the ISODATA classification while keeping the other parameters as default (minimum class size = 20 and sample interval = 10).
Then, to investigate the relationships between functional regions identified by the ISODATA and thus identify functional zones (clusters of regions), we performed a hierarchical clustering unweighted pair group method with arithmetic mean (UPGMA) analysis on the average CWM traits (average pixel values) of the regions (Kreft & Jetz Reference Kreft and Jetz2010). Cells’ values from each interpolated map were obtained using the extract function of the tidyr package (Hadley Reference Hadley2020). UPGMA analyses with the average, ward, single and complete agglomerative linkage methods were run as alternative analyses, and the linkage method with the highest cophenetic correlation was chosen (Borcard et al. Reference Borcard, Gillet and Legendre2011). This was performed using the hclust and cophenetic functions of the stats package (R Core Team 2020). The significant number of clusters in the UPGMA tree was determined using the Mantel test with the grpdist function (Borcard et al. Reference Borcard, Gillet and Legendre2011).
To assess the conservation status of functional regions, we obtained the delimitation of protected areas in the shapefile format from the World Database on Protected Areas (www.protectedplanet.net) and the Brazilian Environmental Ministry (http://mapas.mma.gov.br/i3geo/datadownload.htm). Based on the Brazilian system of protected areas (National System of Protected Areas Management (SNUC), Law 9985, 18 July 2000) and the International Union for Conservation of Nature (IUCN) classification, we investigated five types of strict protection areas (Biological Reserve, equivalent to IUCN category Ia, Ecological Station (Ia), National Park (II), Natural Monument (III) and Wildlife Refuge (III)) and seven sustainable use areas (Area of Relevant Ecological Interest (IV), Private Natural Heritage Reserve (IV), Environmental Protection Area (V), Extractive Reserve (VI), National Forest (VI), Sustainable Development Reserve (VI) and Wildlife Reserve (VI)). Any overlapping between protected areas was reclassified to the most protective category. Remnants of natural vegetation were obtained from the MapBiomas Project, collection 5.0 from 2019, at a spatial resolution of 30 × 30 m (http://mapbiomas.org). While natural savannahs were considered along with forests due to their importance in this threatened biome, they represented less than 3% of its natural vegetation. The map resolution of forest remnants was upscaled to c. 5 km2 in order to match the resolution of the CWM trait maps. The total coverage of forest remnants by functional region was analysed using the Zonal Histogram Tool in ArcGIS (ESRI 2012). Finally, we used the pixel-level information of CWM trait maps to perform PCAs in order to project the functional space of the Atlantic Forest and then characterize remaining forest remnants and protected areas. The functional space captured by the PCA axes covers the entirety of the biome’s original area and therefore refers to the potential (or theoretical) functional composition of the biome, including current deforested areas, which was estimated using the interpolation method of observed data, as described above. Statistical analyses were performed using the stats package from the R Core Team (2020), and maps were produced in ArcGIS.
Results
Functional regions at different scales
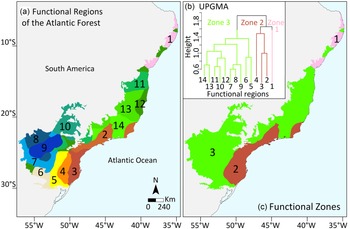
The ISODATA classification based on interpolated maps of CWM traits produced 14 functional regions as the best solution (Fig. 1a). These regions were then grouped according to their resemblances in three functional zones by the UPGMA classification (Fig. 1b,c). Region 1 remained as an independent functional zone in the northernmost Atlantic Forest. Regions 2, 3 and 4 were pooled in functional zone 2 in the south-eastern part of the biome, while the remaining regions were pooled in functional zone 3 (Fig. 1b,c). These regions mostly represented specific combinations of CWM traits rather than being characterized by extremely high or low values of a single CWM trait. For example, whereas region 1 displayed the highest values of leaf dry matter content and wood density, it had the lowest maximum plant height (Supplementary Fig. S1, available online). The highest values of specific leaf area and leaf nitrogen content, along with the lowest leaf thickness, were found across regions pooled in zone 3 (Fig. S1). Leaf thickness was high across regions pooled in zone 2, which also had the lowest leaf dry matter content and wood density. Maximum plant height and seed dry mass had a very similar pattern of variation across the regions, with regions 4, 5, 6 and 9 showing the highest values for these traits.
(a) Maps of functional regions and (b,c) functional zones representing the relationships between regions in the Atlantic Forest. The colours have no absolute meaning; only their differences are meaningful. UPGMA = unweighted pair group method with arithmetic mean.

Protection coverage
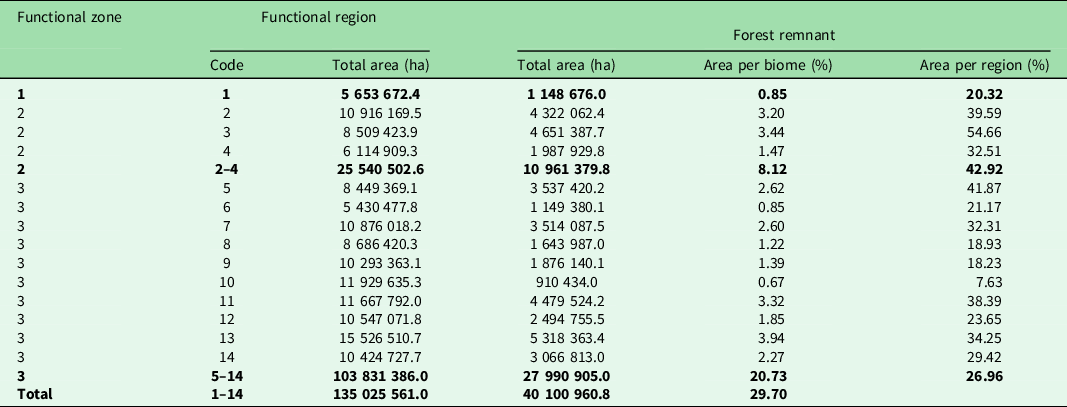
The largest extents of forest remnants were found in functional regions 2, 3, 11 and 13, with values ranging from 3.20% to 3.94% relative to the entire biome (from a total of 29.70%; Table 1). These regions also had high quantities of forest remnants relative to each functional region’s area (34.25–54.66%). Regions 6 and 10 presented the lowest proportions of forest remnants relative to the entire biome (0.67–0.85%) as well as relative to the region’s area (7.63–21.17%). At the functional zone scale, we found that zone 2 encompassed the largest extent of forest remnants (42.92%), whereas zone 1 held the smallest extent (20.32%; Table 1).
Extent of forest remnants in the Atlantic Forest per functional region, grouped by functional zones. Boldface values refer to zone subtotals.

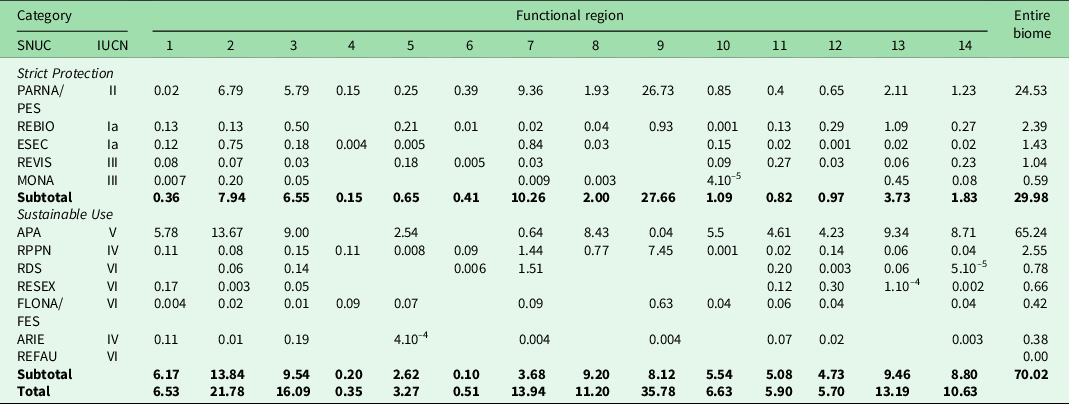
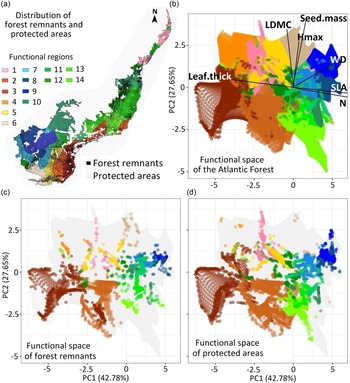
The extent of functional regions covered by protected areas varied 10-fold across regions, ranging from 0.35% in region 4 of zone 2 to 35.78% in region 9 of zone 3 (Table 2). Only half of the functional regions had at least 10% of their area covered by protected areas (Table 2). However, most regions were mainly covered by Environmental Protected Areas (IUCN category V), the least protective class of protected area (Table 2). The National/State Parks (IUCN category II) were the strict protection class with the highest coverage. In addition to the low forest coverage and low protection in the Atlantic Forest (Fig. 2a), we found that large parts of the potential functional space occupied by all regions (Fig. 2b) were covered by neither forest remnants nor protected areas (Fig. 2c,d), and that even the most represented regions in the functional space had serious deficits in coverage by protected areas. The contributions of traits to the functional space are shown in Table S1.
Proportion of area (%) across the 12 types of protected areas per functional region of the Atlantic Forest. Boldface values refer to subtotals of the two main categories of protected areas (Strict Protection and Sustainable Use) and the overall total. Categories are consistent with the Brazilian system of protected areas (National System of Protected Areas Management (SNUC), Law 9985, 18 July 2000: PARNA/PES = Park; REBIO = Biological Reserve; ESEC = Ecological Station; REVIS = Wildlife Refuge; MONA = Natural Monument; APA = Environmental Protection Area; RPPN = Natural Heritage Private Reserve; RDS = Sustainable Development Reserve; RESEX = Extractive Reserve; FLONA/FES = Forest; ARIE = Area of Relevant Ecological Interest; REFAU = Wildlife Reserve) and equivalent International Union for Conservation of Nature (IUCN) categories (Ia = Strict Nature Reserve; II = National Park; III = Natural Monument or Feature; IV = Habitat/Species Management Area; V = Protected Landscape/Seascape; VI = protected area with sustainable use of natural resources).

(a) Spatial distribution of forest remnants and protected areas in the Atlantic Forest, (b) the theoretical functional space estimated for the entire biome based on seven traits and the functional space left in (c) forest remnants and (d) protected areas. Grey dots in (c) and (d) depict the lost functional space. LDMC = leaf dry matter content; Hmax = maximum plant height; Leaf.thick = leaf thickness; N = leaf nitrogen content; PC1 = principal component 1; PC2 = principal component 2; Seed.mass = seed dry mass; SLA = specific leaf area; WD = wood density.

Discussion
In addition to allowing the identification of biodiversity patterns, efforts to map the different facets of biodiversity provide a baseline for protected area frameworks (Kreft & Jetz Reference Kreft and Jetz2010, Ladle & Whittaker Reference Ladle and Whittaker2011, Rickbeil et al. Reference Rickbeil, Coops, Andrew, Bolton, Mahony and Nelson2014). Many biomes still lack an overall view of their functional macro-structures (Violle et al. Reference Violle, Reich, Pacala, Enquist and Kattge2014), and, in this respect, efforts towards the conservation of the Atlantic Forest could benefit from the functional regionalization provided here. The biome’s current area corresponds to only 12–28% of its original extent (Rezende et al. Reference Rezende, Scarano, Assad, Joly, Metzger and Strassburg2018, Ribeiro et al. 2019), so the functional regions and zones explored here are approximations of what could potentially be found in deforested areas based on observed data from forest remnants.
Functional regions of the Atlantic Forest
Some functional regions we found were very similar to some of the 14 floristic regions identified for the Atlantic Forest based on species abundance (Cantidio & Souza Reference Cantidio and Souza2019) and major phylogenetic turnover (Rezende et al. Reference Rezende, Pontara, Bueno, van den Berg, Silva de Miranda, de Oliveira-Filho and Dexter2020). It is worth noting that the interpolated trait maps used in our study were produced based on the same species abundance information used by Cantidio and Souza (Reference Cantidio and Souza2019) and, therefore, an overall spatial similarity between CWM traits and floristic regions would be expected, despite the mismatching present when downscaling (Fig. S2). For example, functional regions 2 and 3 largely overlap with floristic regions 11 and 13 identified by Cantideo and Souza (Reference Cantidio and Souza2019), both corresponding to the Serra do Mar mountain range (Fig. S2). This portion of the biome shows a particular functional trait dominance and phylogenetic composition (Rezende et al. Reference Rezende, Pontara, Bueno, van den Berg, Silva de Miranda, de Oliveira-Filho and Dexter2020, Silva et al. Reference Silva, Souza and Vitória2021b). Tree communities located in the Serra do Mar mountain range are dominated by species that invest in small, thick leaves in combination with tall, light-dense woods in order to deal with shade tolerance in the dense canopy of productive forests (Silva et al. Reference Silva, Souza and Vitória2021b).
Other correspondences occurred between functional regions 1 and 12 and floristic regions 1 and 2 in the northernmost Atlantic Forest (Fig. S2). Tree communities in these areas are dominated by species that invest in short-lived acquisitive leaves and short, hard woods to deal with high temperature, rainfall seasonality and sandy soils (Silva et al. Reference Silva, Souza and Vitória2021b). This is consistent with findings that in seasonal forests in the northernmost Atlantic Forest the prevalence of nitrogen-rich leaves across species is associated with enhanced carbon acquisition (Ribeiro et al. Reference Ribeiro, Silva, Nascimento and Vitória2021). There were also cases of limited correspondence, such as in floristic region 12, which is functionally structured over seven regions while showing a less variable phylogenetic structure (Cantidio & Souza Reference Cantidio and Souza2019, Rezende et al. Reference Rezende, Pontara, Bueno, van den Berg, Silva de Miranda, de Oliveira-Filho and Dexter2020). Although the limits of functional, phylogenetic and floristic regions do not coincide exactly, their overall similarity suggests that broad patterns of species dominance correspond to a considerable degree with particular trait and lineage dominances and probably particular ecosystem functions, mostly because dominant species contribute disproportionally to ecosystem functioning (Lohbeck et al. Reference Lohbeck, Bongers, Martinez-Ramos and Poorter2016).
It has been asserted that the Atlantic Forest structure reflects the high complexity of climates, soils, topographies and the historical expansions and contractions of forests during glaciation cycles, as well as much older evolutionary processes of speciation and the formation of communities through diversification and the migration of lineages (Joly et al. Reference Joly, Metzger and Tabarelli2014, Neves et al. Reference Neves, Dexter, Pennington, Valente, Bueno and Eisenlohr2017, Rezende et al. Reference Rezende, Pontara, Bueno, van den Berg, Silva de Miranda, de Oliveira-Filho and Dexter2020, Silva et al. Reference Silva, Souza and Vitória2021b). In addition, the variation in trait dominance, and possibly distinct trait combinations that occur successfully within functional regions, may reflect the signatures of microenvironments, historical disturbance and successional forest stages as well as short- and long-term human influences (Joly et al. Reference Joly, Metzger and Tabarelli2014, Cantidio & Souza Reference Cantidio and Souza2019). It is important to acknowledge that part of the variation within and across regions has also resulted from analytical limitations, because some parts of the interpolated maps have scarce community data and thus provided less robust estimates (Silva et al. Reference Silva, Souza and Vitória2021b). One should be cautious in assuming that there is continuous variation in trait dominance over the space. In this regard, our results should be seen as a potential pattern, because trait composition may change abruptly within geographical space and is not always well detected in macroecological studies due to uneven sampling efforts and knowledge gaps (Díaz et al. Reference Díaz, Kattge, Cornelissen, Wright, Lavorel and Dray2016, Bruelheide et al. Reference Bruelheide, Dengler, Purschke, Lenoir, Jiménez-Alfaro and Hennekens2018). In fact, our results remain limited by the relatively low availability of functional trait data for most species in a biome as rich as the Atlantic Forest. A more complex structure may be revealed when anatomical, biochemical, hydraulic and belowground traits become more widely available.
Conservation status and priorities
Functional regions retained an average of c. 30% of forest cover (7.6–54.6%) and 10.8% of protected areas (0.35–35.8%). The most extensive conservation areas in the Atlantic Forest were concentrated in functional zone 2, corresponding to the topographically complex Serra do Mar mountain range, which has made human occupation particularly difficult (Joly et al. Reference Joly, Metzger and Tabarelli2014, Pacheco et al. Reference Pacheco, Neves and Fernandes2018, Rezende et al. Reference Rezende, Scarano, Assad, Joly, Metzger and Strassburg2018). Despite the relevance of this functional zone as a centre of endemism and high species richness (Murray-Smith et al. Reference Murray-Smith, Brummitt, Oliveira-Filho, Bachman, Moat, Lughadha and Lucas2009), our results indicate that it does not fully encompass the functional biodiversity of the entire biome. Many other regions in the biome with unique functioning have been subject to a more intense history of forest fragmentation, such as those in the north-east Atlantic Forest (Ranta et al. Reference Ranta, Blom, Niemelā, Joensuu and Siitonen1998, Silva & Tabarelli Reference Silva and Tabarelli2000), and now retain low levels of forest coverage. These critical regions should receive more attention in order to improve their conservation status, especially because the total forest cover itself may not be the best indicator of conservation priority for functional regions, since it does not reveal important aspects such as the area, shape and connectivity of individual forest fragments (Ribeiro et al. Reference Ribeiro, Metzger, Martensen, Ponzoni and Hirota2009). Forest remnants tend to be few, small, irregular in shape and isolated, particularly in the north-east Atlantic Forest (Ranta et al. Reference Ranta, Blom, Niemelā, Joensuu and Siitonen1998, Silva & Tabarelli Reference Silva and Tabarelli2000), and these features intensify changes in local biodiversity.
Tree species occurrences and abundances, as well as the structure of forest remnants, respond in different ways to distinct types of human impacts such as fire, livestock production, road construction, logging, hunting and increased population density, particularly those that affect key ecological process such as seed dispersal (Villela et al. Reference Villela, Nascimento, Aragão and Da Gama2006, Pereira et al. Reference Pereira, Oliveira-Filho, Eisenlohr, Miranda and Filho2014). Such impacts have been ongoing in the Atlantic Forest over the five centuries since colonization by European settlers began (Joly et al. Reference Joly, Metzger and Tabarelli2014), and these historical processes have impacted forest remnants (Lima et al. Reference Lima, Oliveira, Pitta, Gasper, Vibrans and Chave2020). For instance, forest remnants in the Atlantic Forest have lost nearly 25–32% of biomass and 23–31% of species richness, mostly through losses of late-successional, large-seeded and endemic species (Lima et al. Reference Lima, Oliveira, Pitta, Gasper, Vibrans and Chave2020). Population depletion of large-seeded trees is an ongoing process, one that will become more pronounced over the long term as defaunation and the collapse of large-bodied animal populations are intensified in the few older, larger and best-conserved areas, potentially leading to functional impoverishment (Bogoni et al. Reference Bogoni, Pires, Graipel, Peroni and Peres2018, Galetti et al. Reference Galetti, Gonçalves, Villar, Zipparro, Paz, Mendes, Marques and Grelle2021).
More than half of the Brazilian flora (58%) on the list of threatened species occur in the Atlantic Forest (1544 species; Martinelli et al. Reference Martinelli, Valente, Maurenza, Kutschenko, Judice, Silva, Martinelli and Moraes2013). In addition, it has been estimated that nearly 40% of tree species in the north-east Atlantic Forest may become extinct in this highly fragmented landscape in the near future (Silva & Tabarelli Reference Silva and Tabarelli2000). Trees are more vulnerable to extinction than shrubs, and those species geographically restricted to rocky outcrops and sandy coastal plains are at a higher risk of extinction than species of other vegetation types in the Atlantic Forest (Leão et al. Reference Leão, Fonseca, Peres and Tabarelli2014). It is likely that the current dominance of functional traits in many forest remnants reflects the extinction of several species as well as the shift towards more competitive plant strategies due to the cumulative anthropogenic disturbance of the abundance of heliophilous species. In the functional regions located in the north, which were deforested, fragmented and have been hunted in for longer periods of time (Silva & Tabarelli Reference Silva and Tabarelli2000), functional degradation is probably at a more advanced stage. Our estimate of the functional structure of the Atlantic Forest is not a snapshot of the current situation of the biome because the sampling sites included in our analyses had a strong bias in favour of relatively well-conserved areas, as it was common for researchers to prioritize areas representative of the original vegetation. Our estimate, therefore, reflects the potential functional space of the Atlantic Forest based on relatively well-conserved areas. Nevertheless, this potential is conservative, since an unknown part of these areas has suffered, albeit to a lesser extent, the effects of degradation mentioned above.
The impact of climate change on the loss of suitable forest habitats has been estimated to be less pronounced in rainforests and high-elevation/high-latitude forests (Esser & Neves Reference Esser and Neves2019), where conservation status is comparatively better. With regards to Brazilian coastal vegetation, biotic homogenization may be a pervasive process caused by changes in the distribution of taxonomic and functional diversity (Inague et al. Reference Inague, Zwiener and Marques2021). Another important implication of functional regions in the Atlantic Forest is linked to efforts aimed at restoration. As the most extensively deforested and fragmented biome in Brazil, policies and projects have been designed to promote the restoration of the Atlantic Forest (Joly et al. Reference Joly, Metzger and Tabarelli2014, Rezende et al. Reference Rezende, Scarano, Assad, Joly, Metzger and Strassburg2018). Based on our results, it is imperative that these efforts employ sets of species that are specific to each functional region. Otherwise, there is a risk of functional homogenization of the biome, with consequences for the ecosystem services provided by its communities.
In conclusion, the functional heterogeneity identified in this study and the critically low coverage in many regions highlight the importance of expanding protection coverage and restoration beyond the south-eastern part of the Atlantic Forest to encompass the irreplaceable functional biodiversity of the biome in its northern, southern and western regions. As the biodiversity of a biome is composed of its composition, structure and function (Noss Reference Noss1990), we believe that this new emphasis on the functional macro-structure of the Atlantic Forest will help to fill current knowledge gaps, enhance understanding of floristic and phylogeographical patterns (Thomas 2008, Cantidio & Souza Reference Cantidio and Souza2019, Rezende et al. Reference Rezende, Pontara, Bueno, van den Berg, Silva de Miranda, de Oliveira-Filho and Dexter2020), provide a more complete framework for achieving conservation goals and serve as a baseline for revisiting functional patterns in the face of climate change. In addition, while a comprehensive view of a given biome in its entirety can reveal great correspondence between floristic, phylogenetic and functional macro-structures, a downscaled view can reveal mismatching related to these structures.
Supplementary material
To view supplementary material for this article, please visit https://doi.org/10.1017/S0376892922000212.
Acknowledgements
We are grateful to many lab colleagues for helping with the digitalization of species abundance and trait data. We sincerely thank Luciana Alves for helpful comments on the manuscript.
Financial support
This work was supported by Fundação de Amparo à Pesquisa do Estado do Rio de Janeiro (FAPERJ) through a post-doctoral fellowship and scientific grant to JLAS (E-26/204.257/2021) and by the Conselho Nacional de Desenvolvimento Científico e Tecnológico through a grant to APV (nº 302330/2019-4).
Competing interests
The authors declare none.
Ethical standards
None.