Introduction
Emergency Medical Services (EMS) must match limited resources to unpredictable demand. Response time is a determinant of survival in cardiac arrest, stroke, and major trauma. Reference Pons, Haukoos, Bludworth, Cribley, Pons and Markovchick1,Reference Blanchard, Doig and Hagel2 Prehospital demand continues to rise world-wide Reference Cantwell, Dietze, Morgans and Smith3 and data-informed workforce scheduling has gained priority. Call volumes follow reproducible temporal patterns shaped by endogenous circadian physiology Reference Crnko, Du Pre, Sluijter and Van Laake4,Reference Neves, Albuquerque, Quintela and Costa5 and exogenous social rhythms, including occupational activity and traffic flow. Reference Cantwell, Dietze, Morgans and Smith3,Reference Protopapas, Mamais and Constantinou6 These patterns operate across circadian, weekly, and seasonal timescales and vary by diagnostic category.
However, most studies have relied on descriptive distributions by hour, day, or month. Reference Cantwell, Dietze, Morgans and Smith3,Reference Sariyer, Ataman, Akay, Sofuoglu and Sofuoglu7,Reference Møller, Ersbøll and Tolstrup8 Cosinor rhythmometry, the standard parametric method in chronobiology, Reference Halberg, Tong, Johnson and von Mayersbach9,Reference Cornelissen10 remains uncommon in prehospital research. Helander, et al Reference Helander, Formica and Bergen-Cico11 fitted sinusoidal models to 311 million United States EMS activations, and Cantwell, et al Reference Cantwell, Morgans, Smith, Livingston, Spelman and Dietze12 used trigonometric regression in 1.2 million Melbourne, Australia cases, identifying medical-trauma differences. Seasonal autoregressive integrated moving average (ARIMA) models have been tested for ambulance demand prediction Reference Channouf, L’Ecuyer, Ingolfsson and Avramidis13–Reference Al-Azzani, Davari and England15 but generally modeled undifferentiated call volumes. Studies combining cosinor, regression, and out-of-sample forecasting remain scarce.
In Türkiye, the 112 EMS system serves as the sole prehospital emergency access point. Sariyer, et al Reference Sariyer, Ataman, Akay, Sofuoglu and Sofuoglu7 used t-tests and correlation to identify temporal and spatial demand patterns in İzmir, Türkiye; Pakdemirli, et al Reference Pakdemirli, Bayram, Güvenç and Ellidokuz16 applied logistic regression to factors affecting hospital transfer among elderly EMS patients; and Şimşek, et al Reference Şimşek, Yadigaroğlu, Katipoğlu, Şahin, Topbaş and Gündüz17 reported Ramadan-associated changes in emergency department attendances. None has combined diagnosis-stratified cosinor rhythmometry, multivariable regression, and full-year out-of-sample forecasting in a unified framework.
The primary objective of this study was to characterize circadian patterns in overall EMS case-record volume and across seven pre-specified clinical groups using two-component cosinor rhythmometry, as well as hourly, weekly, and seasonal variation in diagnostic composition across eight categories. Secondary objectives were to estimate adjusted temporal associations and evaluate frozen transfer of aggregate daily forecasts from 2024 to the immediately subsequent 2025 holdout.
Methods
Study Design and Setting
This retrospective observational study analyzed routinely collected EMS records from Karaman Province, Türkiye, from January 1, 2024 through December 31, 2025. Karaman, an inland Central Anatolian province with approximately 260,000 inhabitants and one central and five rural sub-districts, operates a 112 EMS system with physician- and paramedic-staffed ambulances from 18 stations and a single provincial command and dispatch center.
The study was approved by the Local Ethics Committee for Scientific Medical Research, Karamanoğlu Mehmetbey University Faculty of Medicine (Karaman, Türkiye; Decision No. 04-2026/21; May 5, 2026). Because the study retrospectively used de-identified routinely collected EMS records, the requirement for written informed consent was waived. The study was conducted in accordance with the Declaration of Helsinki and is reported according to the STROBE and RECORD statements.
Data Source and Study Population
Data came from the 112 Emergency Operation Management System (ARMAKOM) and included call-receipt time, incident/protocol and case-record identifiers, team and vehicle fields, task reason, demographics, urban/rural location, field triage, preliminary International Classification of Diseases - Tenth Revision (ICD-10) codes, and disposition. Permission covered provincial health-authority EMS records; the all-contact 112 call-taking log, administered in Karaman by a separate authority within the Ministry of Interior, was outside the study’s permission and unavailable. The ARMAKOM system contained no independently verified identifier for all inbound contacts; repeated contacts concerning one incident and contacts closed without EMS resource assignment therefore could not be enumerated. Observations were case-record rows linked to command-center incidents, not a census of all 112 contacts.
In routine operations, the command center receives the call, opens an incident/protocol, and transmits the task to the assigned EMS team. Demographic information, field triage, and preliminary ICD-10 codes are generally entered later during field/clinical documentation after patient assessment; they were not interpreted as call-taker assessments or dispatch-priority variables.
Variables and Definitions
Temporal Variables—All temporal analyses were indexed to the recorded call-receipt timestamp; linked field-triage and preliminary ICD-10 categories classified records but did not determine temporal assignment. Variables were hour (0-23), day of week, month, and meteorological season (winter: December-February; spring: March-May; summer: June-August; and autumn: September-November); descriptive time-of-day periods were daytime (08:00-16:59), evening (17:00-23:59), and night (00:00-07:59).
Diagnostic Classification—Preliminary ICD-10 codes from the linked field/clinical record were grouped into eight mutually exclusive categories: Cardiovascular; Respiratory; Trauma and Injury; Psychiatric; Musculoskeletal; Neurological; Symptoms and Signs; and Other. Records without a valid ICD-10 code were retained in overall temporal analyses but were treated as missing diagnostic information rather than as a ninth category.
When multiple comma-separated ICD-10 codes were recorded, an investigator-defined deterministic chapter-score rule from the original analytic pipeline retained one for mutually exclusive classification. The rule was a reproducible, study-specific resolver, not a clinically validated primary-diagnosis or acuity hierarchy. Although the preliminary EMS diagnosis field was not a formal main-condition record, two features of the ordering broadly paralleled World Health Organization (WHO; Geneva, Switzerland) morbidity-coding guidance in specific contexts: R/Z entries ranked below co-recorded specific diagnoses, and S/T nature-of-injury codes ranked above V–Y external-cause codes. 18 This limited correspondence does not validate the remaining between-chapter ordering. An Emergency Medicine specialist on the study team developed the mapping at study outset before temporal results were examined; a second physician investigator reviewed it, and the initial-submission dictionary remained unchanged. Ties retained the first-listed code; missing codes remained missing; unrecognized chapter letters scored zero. The Supplementary Material (6) provides the complete dictionary, resolution algorithm, and eight-category mapping.
Of 60,811 case-record rows, 58,116 contained a valid ICD-10 code and 2,695 did not. Multiple ICD-10 codes were recorded in 17,382 coded rows (29.9%); the selected code differed from the first-listed code in 5,106 rows and changed the eight-category assignment in 2,928. Seven pre-specified clinical groups received group-specific cosinor estimates; all eight categories, including Other, were included in diagnostic-composition and diagnosis-by-time interaction models. The study-unit and analytic-cohort flow is shown in the Supplementary Material (5).
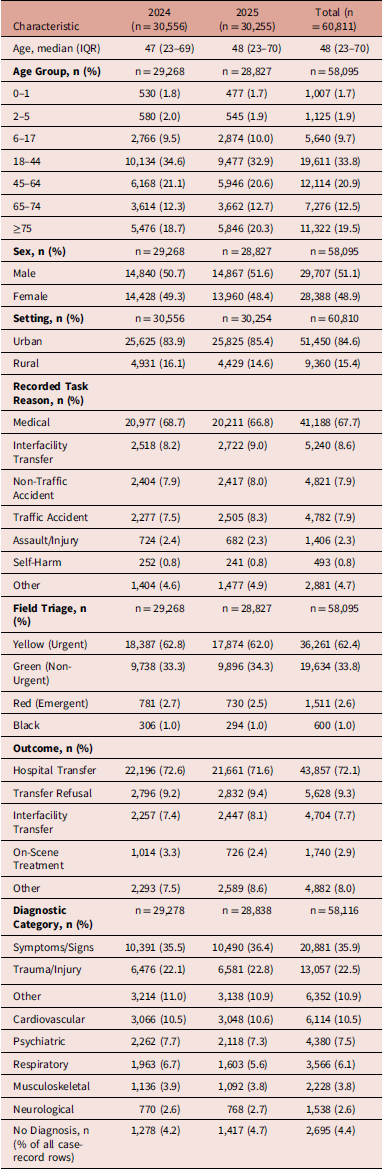
Demographic and Field-Triage Variables—Age was analyzed continuously and in seven groups (Table 1). Setting was classified as urban or rural from the recorded dispatch address. Field triage was analyzed as recorded in four categories: green, yellow, red, and black. It was treated as a field-level clinical classification, not as a call-taking acuity or dispatch priority. For black-coded records, the call-receipt timestamp was not interpreted as the time of death.
Characteristics of Emergency Medical Service Case-Record Rows by Study Year, Karaman Province, Türkiye, 2024-2025

Table 1. Long description
The table presents demographic and field-triage variables for emergency medical service case-record rows by study year in Karaman Province, Türkiye, for the years 2024 and 2025, along with the total. It includes data on age, age group, sex, setting, recorded task reason, field triage, outcome, and diagnostic category. The table has 18 rows and 10 columns. Column headers include Characteristic, 2024 (n = 30,556), 2025 (n = 30,255), and Total (n = 60,811). Row labels include Age, Age Group, Sex, Setting, Recorded Task Reason, Field Triage, Outcome, and Diagnostic Category. Each row provides specific data points for the respective categories and years.
Note: Percentages for age group and sex were calculated among 58,095 patient-contact case-record rows (29,268 in 2024 and 28,827 in 2025). Setting was missing for one case-record row in 2025. Field-triage percentages use the same patient-contact denominators; standard green, yellow, red, or black categories were available for 58,006 rows, with 89 missing or nonstandard values. Diagnostic-category percentages were calculated among 58,116 case-record rows with a recorded ICD-10 code (29,278 in 2024 and 28,838 in 2025); the No Diagnosis row uses all 60,811 case-record rows as its denominator. Percentages may not total 100 because of rounding.
Diagnostic categories were assigned from ICD-10 codes using the deterministic hierarchy described in Methods.
Year-specific values are descriptive; no between-year hypothesis tests were performed. Table 1 classifies every case-record row by its row-level recorded task reason. Supplementary Material 10 instead pools the 145 rows from 64 incidents with multiple recorded reasons into one audit row; totals are identical, but category counts therefore differ.
Statistical Analysis
Analyses were performed in Python 3.12.10 (Python Software Foundation; Wilmington, Delaware USA) using NumPy 1.26.4, pandas 2.2.3, SciPy 1.14.1, statsmodels 0.14.4, PyArrow 17.0.0, and Matplotlib 3.9.2.
Descriptive Statistics—Continuous variables were summarized using median and interquartile range (IQR), and categorical variables using counts and percentages. Table 1 presents year-specific characteristics descriptively, without hypothesis tests. Missing diagnostic or triage information was not imputed. Inferential procedures, significance thresholds, confidence intervals, and multiplicity adjustments were specified separately for each model.
Cosinor Analysis—Average circadian profiles were estimated from the mean case-record count at each of 24 clock hours across the 731 study dates. Following standard harmonic-regression formulations, Reference Cornelissen10 a two-component cosinor model included the 24-hour fundamental and 12-hour harmonic and estimated the midline estimating statistic of rhythm (MESOR), fundamental amplitude, relative amplitude, and acrophase. The 12-hour harmonic phase was interpreted on its 12-hour cycle as two recurring daily peak times separated by 12 hours.
Point estimates came from pooled 24-hour profiles; primary 95% confidence intervals (CI) used 10,000 nonparametric bootstrap resamples of the 731 complete date profiles with replacement. Within-date centering, equivalent to date fixed effects, was applied to all 17,544 hour-date cells. Joint rhythmicity used date-cluster-robust covariance and a four-parameter Wald F test for the sine and cosine terms of both harmonics; the 12-hour harmonic used a separate two-parameter test. The Bonferroni threshold for the overall series and seven pre-specified clinical groups was 0.00625; heteroscedasticity- and autocorrelation-consistent [HAC(7)] covariance was a sensitivity analysis. Pooled-profile R² described fit to the 24 mean hourly values; full-cell R² described variation across the complete hour-date panel. Harmonic and HAC results are reported in the Supplementary Material (1).
Diagnosis-by-Time Interactions—Among 58,116 coded rows, diagnostic composition was modeled using eight-category multinomial logit with categorical hour, day of week, meteorological season, and year. Primary inference used call-date-clustered CR1 (cluster-robust variance estimator) covariance and Holm-adjusted block Wald tests; effects were summarized using standardized shares and Cramér V. Reference levels, the Poisson log-linear equivalence, partial McFadden R², peak-to-trough contrasts with Bonferroni simultaneous 95% confidence intervals, and the two-component harmonic sensitivity analysis are detailed in the Supplementary Material (7).
Classification and Inclusion Sensitivities—The key classification sensitivity analysis used the first-listed code; a second analysis included only single-code rows (n = 40,734; 70.1% of coded rows). Inclusion scenarios separately excluded disposition-defined transfers, task-reason-defined transfers, or no-contact-proxy rows; a combined scenario excluded disposition-defined transfers and no-contact-proxy rows. Cosinor and diagnosis-by-time analyses were repeated in these scenarios. An incident-level cosinor analysis counted each incident once overall and at most once per diagnostic category. Cosinor sensitivities retained the date-level bootstrap; all inferential models retained date-cluster-robust covariance (Supplementary Material 1).
Field-Triage-by-Time Analysis—Among 58,006 patient-contact rows with standard green, yellow, red, or black categories, temporal composition was modeled using four-category multinomial logit; model details and results are reported in the Supplementary Material (8). Field triage was generally recorded after patient assessment; its temporal associations were not interpreted as dispatch-priority effects or as evidence for staffing or resource allocation.
Negative Binomial (NB) Regression—Hourly case-record volume across 17,544 hour-date cells was modeled using NB2 regression to accommodate over-dispersion, with categorical hour, day of week, month, and year; reference levels were 06:00, Saturday, November, and 2024. Dispersion was estimated by maximum likelihood. Mutually adjusted incidence rate ratios (IRRs) and 95% confidence intervals (CI) were reported. Complete specification details, all 42 coefficients and four reference rows, the multiplicity caveat, and Poisson, quasi-Poisson, and Newey–West/HAC(12) sensitivity analyses are reported in the Supplementary Materials (2–3).
Forecasting—Aggregate daily EMS case-record volume was modeled by dynamic harmonic regression with weekly Fourier terms and ARIMA errors. Seven eligible candidates combined ARIMA(1,0,1) errors with K = 1-3 or ARIMA(2,0,1)/ARIMA(1,0,2) errors with K = 1-2; at daily resolution, K = 3 is the full weekly Fourier basis and represents an unrestricted day-of-week pattern. Candidates were compared at six expanding-window 2024 origins with 28-day validation horizons. Eligibility required convergence, finite standard errors, and AR/MA root moduli >1.001; the lowest mean validation root mean square error (RMSE) determined selection. The selected K = 2/ARIMA(1,0,1) model was refitted to all 366 training days and generated one frozen-origin forecast for all 365 days of 2025 without updating (Supplementary Material 9).
Accuracy metrics were RMSE, mean absolute error (MAE), mean absolute percentage error (MAPE), mean absolute scaled error (MASE) scaled by the seven-day naive training error, mean observed-minus-forecast error, and 95% prediction-interval coverage and mean width. Frozen benchmarks were the 2024 overall mean as a no-temporal-structure reference, the weekly-naive sequence, the prior-year ordinal-day profile, and 2024 day-of-week means; constructions are detailed in the Supplementary Material (9). The ARMA-adjusted Ljung–Box tests at lags 7, 14, and 21 assessed residual autocorrelation. Forecasting targeted aggregate recorded EMS workload and retained interfacility transfers by design; no transfer-excluded forecast was estimated. All-contact demand and deployment-, station-, shift-, acuity-, or diagnosis-specific performance were outside the study scope; diagnosis-specific inference used cosinor and interaction analyses.
Selected holiday and Ramadan forecast residuals in held-out 2025 were summarized descriptively, without P values or causal interpretation (Supplementary Material 4).
Results
Study Population Characteristics
The analytic dataset comprised 60,811 case-record rows (30,556 in 2024; 30,255 in 2025) over 731 consecutive days, corresponding to 58,520 unique command-center incidents/protocols because incidents could have multiple rows. Thus, 60,811 was not interpreted as unique calls, incidents, patients, or ambulance assignments. Annual exports were schema-harmonized and checked for row counts, incident-identifier completeness, and timestamp validity. All supplied rows were analyzed without sample-size calculation. Direct identifiers were removed, leaving no linkable patient key. The Supplementary Materials (1–10) provide detailed definitions, analyses, and operational reconciliation.
Among 1,634 multi-record incidents, only 13 had multiple recorded teams and 14 multiple recorded vehicles; all linked rows shared the same call-receipt timestamp. Thus, additional rows generally represented case records within the same incident, not additional ambulance assignments or crews. Row-level volume was retained because the primary construct was case-level operational and documentation workload, whereas incident-level counts quantified event frequency (Supplementary Material 10).
An operational rule identified 2,716 case-record rows with no recorded patient-identity entry, age, or sex (“no-contact-proxy rows”). This analytic shorthand did not verify contact status, and diagnosis was not part of the rule. Of these, 43 had a preliminary ICD-10 code and entered the primary coded diagnosis analyses; 2,673 did not. All 2,716 (4.5%) were retained in primary temporal-volume analyses as recorded workload, with exclusion assessed in sensitivity analyses (Supplementary Material 1; analytic-cohort flow in Supplementary Material 5). Interfacility transfers were likewise retained because they used ambulance and crew capacity, but were excluded under the disposition- and task-reason-based definitions in sensitivity analyses because their timing may reflect referral rather than acute community events.
Median age was 48 years (IQR, 23–70), 51.1% were male, and 84.6% were urban. Year-specific characteristics were broadly similar in absolute terms and are presented descriptively in Table 1 without between-year hypothesis tests.
Among 58,116 case-record rows with a recorded ICD-10 code, Symptoms and Signs was the largest diagnostic category (n = 20,881; 35.9%), followed by Trauma and Injury (22.5%), Other Diagnoses (10.9%), and Cardiovascular Conditions (10.5%). Psychiatric, Respiratory, Musculoskeletal, and Neurological categories accounted for 7.5%, 6.1%, 3.8%, and 2.6%, respectively. Descriptively, Trauma-category case-record rows had the lowest median age (29 years) and were 62.6% male; Cardiovascular-category rows had the highest median age (68 years), and Psychiatric-category rows were 64.8% female (Supplementary Material 1; Table S1D).
Temporal Distribution Patterns
Volume of EMS peaked at 21:00 and was lowest at 06:00 (ratio 3.5); daytime, evening, and night represented 44.4%, 36.7%, and 19.0% of case-record rows (Figure 1a). Diagnostic composition varied modestly by hour (robust χ²(161) = 1,498.5; Holm P < 0.001; Cramér V = 0.061). Nevertheless, model-standardized shares among coded case-record rows ranged from 11.2% to 28.6% for Trauma and from 2.9% to 11.7% for the Psychiatric category (Supplementary Material 7).
Circadian Patterns in EMS Case-Record Volume.
Note: Shaded regions in both panels show pointwise 95% bootstrap intervals for the fitted mean curves, based on 10,000 whole-date resamples. (a) Observed mean hourly volume across 60,811 case-record rows over 731 days and the fitted two-component cosinor curve. The raw hourly maximum occurred at 21:00 and the minimum at 06:00 (ratio, 3.5); the estimated 24-hour acrophase was 16:27 because the model also included a 12-hour harmonic. Overall pooled-profile R² was 0.983, whereas R² across all hour-date cells was 0.234. (b) Observed hourly profiles and fitted two-component cosinor curves for seven prespecified clinical groups: cardiovascular (Ba), respiratory (Bb), trauma/injury (Bc), psychiatric (Bd), musculoskeletal (Be), neurological (Bf), and symptoms/signs (Bg). Estimated 24-hour acrophases ranged from 14:41 to 19:14, and relative amplitudes ranged from 28.6% to 67.9% of the MESOR. Joint 24- and 12-hour rhythmicity was detected in all seven groups after Bonferroni correction (all P <0.00625). Panel B contains seven clinical groups; the separate diagnostic-composition analyses used eight mutually exclusive categories, including Other. Clinical-group panels use independent y-axis scales, all in mean case-record rows/hour, to show within-group temporal shape; absolute bar heights should not be compared across panels. Abbreviations: EMS, Emergency Medical Services; MESOR, midline estimating statistic of rhythm.

Monday had the highest volume (n = 9,186; 15.1%) and Saturday the lowest (n = 8,222; 13.5%). Diagnostic composition varied only slightly by day of week (robust χ²(42) = 66.1; Holm P = 0.0103; Cramér V = 0.016; Supplementary Material 7).
Seasonal volume was highest in summer (n = 16,503; 27.1%) and lowest in winter (n = 14,258; 23.4%). Diagnostic composition varied modestly by season (robust χ²(21) = 514.1; Holm P < 0.001; Cramér V = 0.069). Model-standardized shares among coded case-record rows ranged from 3.6% in summer to 9.7% in winter for the Respiratory category and from 18.1% in winter to 25.7% in summer for the Trauma category (Supplementary Material 7).
Circadian Rhythm Analysis
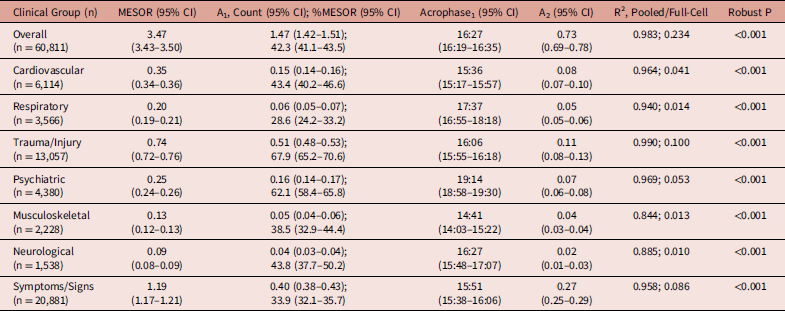
The 12-hour harmonic contributed to the overall two-component cosinor model (date-cluster-robust F(2,730) = 522.4; P < 0.001) and was significant in each of the seven clinical groups. Joint 24- and 12-hour rhythmicity remained significant after Bonferroni correction (all P < 0.00625). For overall case-record volume, pooled-profile R² was 0.983, whereas full-cell R² was 0.234 overall and ranged from 0.010 to 0.100 across the seven clinical groups, leaving most variation across individual hour-date observations unexplained. Table 2 reports pooled-profile estimates with date-bootstrap 95% CIs; fitted curves appear in Figure 1b.
Two-Component Cosinor Parameters for Circadian Variation in EMS Case-Record Volume by Clinical Group (Pooled 2024–2025)

Table 2. Long description
A table comparing circadian variation in EMS case-record volume by clinical group. The table has 8 rows and 7 columns. Column headers are Clinical Group (n), MESOR (95% CI), A1, Count (95% CI); %MESOR (95% CI), Acrophase (95% CI), A2 (95% CI), R-squared, Pooled/Full-Cell, and Robust P. Row 1: Overall (n = 60,811), 3.47 (3.43-3.50), 1.47 (1.42-1.51); 42.3 (41.1-43.5), 16:27 (16:19-16:35), 0.73 (0.69-0.78), 0.983; 0.234, <0.001. Row 2: Cardiovascular (n = 6,114), 0.35 (0.34-0.36), 0.15 (0.14-0.16); 43.4 (40.2-46.6), 15:36 (15:17-15:57), 0.08 (0.07-0.10), 0.964; 0.041, <0.001. Row 3: Respiratory (n = 3,566), 0.20 (0.19-0.21), 0.06 (0.05-0.07); 28.6 (24.2-33.2), 17:37 (16:55-18:18), 0.05 (0.05-0.06), 0.940; 0.014, <0.001. Row 4: Trauma/Injury (n = 13,057), 0.74 (0.72-0.76), 0.51 (0.48-0.53); 67.9 (65.2-70.6), 16:06 (15:55-16:18), 0.11 (0.08-0.13), 0.990; 0.100, <0.001. Row 5: Psychiatric (n = 4,380), 0.25 (0.24-0.26), 0.16 (0.14-0.17); 62.1 (58.4-65.8), 19:14 (18:58-19:30), 0.07 (0.06-0.08), 0.969; 0.053, <0.001. Row 6: Musculoskeletal (n = 2,228), 0.13 (0.12-0.13), 0.05 (0.04-0.06); 38.5 (32.9-44.4), 14:41 (14:03-15:22), 0.04 (0.03-0.04), 0.844; 0.013, <0.001. Row 7: Neurological (n = 1,538), 0.09 (0.08-0.09), 0.04 (0.03-0.04); 43.8 (37.7-50.2), 16:27 (15:48-17:07), 0.02 (0.01-0.03), 0.885; 0.010, <0.001. Row 8: Symptoms/Signs (n = 20,881), 1.19 (1.17-1.21), 0.40 (0.38-0.43); 33.9 (32.1-35.7), 15:51 (15:38-16:06), 0.27 (0.25-0.29), 0.958; 0.086, <0.001.
Note: Values are point estimates with 95% confidence intervals unless otherwise indicated. MESOR and absolute amplitudes are expressed as mean case-record rows per hour. A1 is the amplitude of the 24-hour fundamental component, and its relative value is expressed as a percentage of the MESOR. A2 is the amplitude of the 12-hour harmonic. Component-specific second-harmonic peak times are reported in Supplementary Table S1A. Acrophase1 is the phase of the 24-hour fundamental component and need not coincide with the clock hour of maximum observed or fitted total volume when the 12-hour harmonic is included.
Confidence intervals were derived from 10,000 nonparametric whole-date bootstrap samples that resampled the 731 complete 24-hour profiles. P values are from a joint four-parameter Wald test of the 24- and 12-hour sine and cosine terms across all 17,544 hour-date cells, with covariance clustered by date. The Bonferroni-adjusted threshold was 0.00625; all P values were < 0.001.
Pooled-profile R² describes fit to the 24 averaged hourly values. Full-cell R² describes variation across all 17,544 hour-date cells. Seven prespecified clinical groups received group-specific cosinor estimates. Other (n = 6,352) remained in the eight-category composition and interaction analyses but was not modeled as a separate cosinor group. The overall series includes all 60,811 case-record rows. A high pooled-profile R² does not indicate accurate prediction of volume in any individual hour or day.
Abbreviations: EMS, Emergency Medical Services; MESOR, midline estimating statistic of rhythm.
Overall case-record volume had a MESOR of 3.47 case-record rows per hour, a 24-hour amplitude of 1.47 (42.3% of MESOR; 95% CI, 41.1%–43.5%), and a 24-hour acrophase at 16:27 (95% CI, 16:19–16:35). Across the seven clinical groups, 24-hour acrophases ranged from 14:41 in the Musculoskeletal group to 19:14 in the Psychiatric group. Relative 24-hour amplitude was largest in the Trauma group (67.9%; 95% CI, 65.2%–70.6%) and smallest in the Respiratory group (28.6%; 95% CI, 24.2%–33.2%; Table 2).
First-listed-code classification, the key classification sensitivity analysis, changed 24-hour acrophases and relative amplitudes by at most 8.2 minutes and 3.35 percentage points, respectively, across the seven clinical groups; single-code subset maxima (n = 40,734) were 45.9 minutes and 11.2 percentage points. For the incident-level sensitivity analysis, corresponding maxima were 8.0 minutes and 0.94 percentage points. Excluding all no-contact-proxy rows changed overall acrophase and relative amplitude by 4.5 minutes and 0.55 percentage points, respectively; maxima across the eight diagnostic categories were 0.6 minutes and 0.15 percentage points. Joint rhythmicity remained P < 0.001 in all seven pre-specified clinical groups. After excluding interfacility transfers under either operational definition, the maximum absolute changes across the seven clinical groups were 40.9 minutes for acrophase and 4.80 percentage points for relative amplitude; joint rhythmicity remained P < 0.001 in every group. Diagnosis-by-hour and diagnosis-by-season associations remained P < 0.001, whereas the diagnosis-by-day-of-week association remained small (Cramér V = 0.016 under both definitions; Holm P = 0.009 and 0.03; Supplementary Material 1).
Temporal Predictors of Case-Record Volume
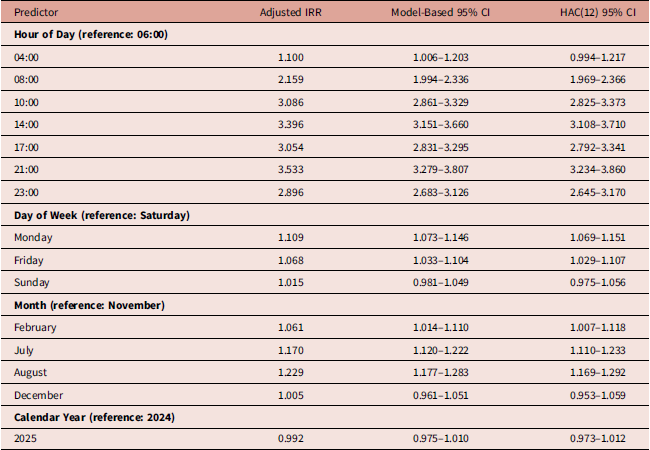
In the mutually adjusted NB model, hour showed the largest temporal variation in hourly case-record volume (Table 3). At 21:00, adjusted volume was 3.53-times the 06:00 reference (IRR = 3.53; 95% CI, 3.28–3.81); IRRs exceeded 3.0 from 10:00 through 22:00. The HAC(12) sensitivity analysis yielded a 95% CI of 3.23–3.86 for the 21:00 contrast (Supplementary Material 3).
Selected Adjusted Estimates from the Multivariable Negative Binomial Regression of Hourly EMS Case-Record Volume on Temporal Factors (n = 17,544 hour-date cells)

Table 3. Long description
The table presents adjusted incident rate ratios (IRR) for hourly EMS case-record volume, with a focus on temporal variations. It includes data for different hours of the day, days of the week, months, and calendar years. The table has 18 rows and 4 columns. Column headers are Predictor, Adjusted IRR, Model-Based 95% CI, and HAC(12) 95% CI. Row labels include specific times, days, months, and years. Notable trends include higher IRRs during later hours of the day, particularly at 21:00, and variations across different days of the week and months.
Note: IRRs were mutually adjusted for categorical hour of day, day of week, month, and calendar year. The table presents selected adjusted estimates from the primary NB2 model.
Complete results for all 42 estimated coefficients and four reference rows, together with model-based and Newey–West/HAC(12) 95% confidence intervals, are provided in Supplementary Material 3. The estimated dispersion parameter was α = 0.057816, and Pearson χ²/df = 1.036.
The HAC(12) sensitivity analysis yielded the same interpretation except for 04:00 versus 06:00, whose interval included 1.00 (95% CI, 0.994–1.217). Poisson and quasi-Poisson model-form sensitivity analyses are reported in Supplementary Material 2. The widths of the 95% confidence intervals were not adjusted for multiplicity and should not be used in place of hypothesis testing.
Abbreviations: EMS, Emergency Medical Services; IRR, incidence rate ratio; CI, confidence interval; HAC, heteroscedasticity- and autocorrelation-consistent.
Relative to Saturday, adjusted volume was 10.9% higher on Monday (IRR = 1.11; 95% CI, 1.07–1.15), whereas Sunday was similar (IRR = 1.01; 95% CI, 0.98–1.05). August exceeded November by 22.9% (IRR = 1.23; 95% CI, 1.18–1.28), while adjusted volume was similar in 2025 and 2024 (IRR = 0.99; 95% CI, 0.97–1.01); HAC(12) intervals led to the same interpretation except for 04:00 versus 06:00, whose interval included 1.00 (95% CI, 0.99–1.22) (Supplementary Material 3).
Demand Forecasting
Training-only rolling-origin validation across seven eligible candidates selected dynamic harmonic regression with weekly Fourier K = 2 and ARIMA(1,0,1) errors (mean 2024 validation RMSE, 14.15 case-record rows/day; Supplementary Material 9). Convergence and pre-specified stability criteria were met. After refitting to all 366 training days, the model was frozen before forecasting all 365 days of 2025. Testing with ARMA-adjusted Ljung–Box indicated residual autocorrelation at lag 7 (P = 0.030) but not at lag 14 or lag 21.
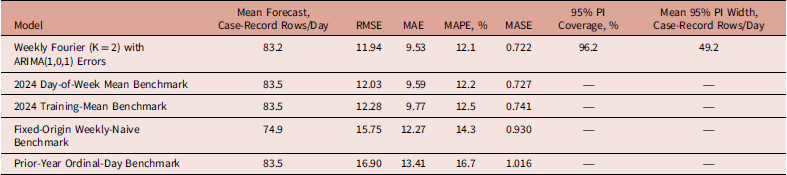
During frozen-origin evaluation of all 365 days of 2025, the selected model achieved RMSE = 11.94 and MAE = 9.53 case-record rows/day, MAPE = 12.1%, MASE = 0.722, 95% prediction-interval coverage of 96.2%, and mean 95% prediction-interval width of 49.2 case-record rows/day (Table 4; Figure 2). Mean observed-minus-forecast error was −0.29 case-record rows/day. Benchmark RMSEs were 12.03 (2024 day-of-week mean), 12.28 (2024 overall-mean reference), 15.75 (fixed-origin weekly-naive), and 16.90 (prior-year ordinal-day). Diagnosis-specific forecasts were not retained because the target was aggregate daily case-record volume.
Frozen-Origin Forecasting Performance for Aggregate Daily EMS Case-Record Volume: 2024 Training and 2025 Holdout

Table 4. Long description
The table compares the performance of different models and benchmarks for forecasting case-record rows per day. It has six rows and eight columns. The columns are labeled Model, Mean Forecast (Case-Record Rows/Day), RMSE, MAE, MAPE (%), MASE, 95% PI Coverage (%), and Mean 95% PI Width (Case-Record Rows/Day). The rows are labeled with different models and benchmarks. Row 1: Weekly Fourier (K = 2) with ARIMA(1,0,1) Errors, 83.2, 11.94, 9.53, 12.1, 0.722, 96.2, 49.2. Row 2: 2024 Day-of-Week Mean Benchmark, 83.5, 12.03, 9.59, 12.2, 0.727, --, --. Row 3: 2024 Training-Mean Benchmark, 83.5, 12.28, 9.77, 12.5, 0.741, --, --. Row 4: Fixed-Origin Weekly-Naive Benchmark, 74.9, 15.75, 12.27, 14.3, 0.930, --, --. Row 5: Prior-Year Ordinal-Day Benchmark, 83.5, 16.90, 13.41, 16.7, 1.016, --, --.
Note: Values were evaluated on the frozen-origin 2025 holdout (n = 365 days); the observed mean was 82.9 case-record rows/day. Observed daily volume was nonzero throughout the holdout (minimum, 45 case-record rows/day), so MAPE included all 365 days. Mean forecast, RMSE, and MAE are expressed in case-record rows/day.
The selected model was chosen using six expanding-window validation origins within 2024, refitted to all 366 training days, and used to forecast all 365 days of 2025 without updating. MASE was scaled by the mean absolute same-day-of-prior-week difference in the 2024 training series.
The 2024 day-of-week mean benchmark mapped the seven weekday-specific means estimated from the 366 training days to corresponding weekdays in 2025. The fixed-origin weekly-naive benchmark repeated the final seven observed training days, whereas the prior-year ordinal-day benchmark mapped the first 365 days of 2024 to 2025. Mean 95% PI width is the average daily difference between the upper and lower prediction limits across the 365-day holdout. Prediction-interval metrics apply only to the selected probabilistic model; the benchmark models were evaluated as point forecasts.
Abbreviations: EMS, Emergency Medical Services; RMSE, root mean squared error; MAE, mean absolute error; MAPE, mean absolute percentage error; MASE, mean absolute scaled error; PI, prediction interval.
Frozen-Origin Validation of Aggregate Daily EMS Case-Record Volume during the 2025 Holdout.
Note: The model, selected using 2024 training data only, combined two weekly Fourier harmonics (K = 2) with ARIMA(1,0,1) errors and was refitted to all 366 days of 2024 before forecasting all 365 days of 2025 without updating. The dark-blue line shows observed daily volume, the red line shows forecasts, and the light-blue band shows the 95% prediction interval. Holdout performance was RMSE = 11.94 and MAE = 9.53 case-record rows/day, MAPE = 12.1%, MASE = 0.722, and 95% prediction-interval coverage = 96.2%. The lower panel shows daily residuals, defined as observed minus forecast, with a horizontal reference line at zero. Abbreviations: EMS, Emergency Medical Services; ARIMA, autoregressive integrated moving average; MAPE, mean absolute percentage error; MASE, mean absolute scaled error; RMSE, root mean square error; MAE, mean absolute error.

Discussion
This integrated analysis combined diagnostic composition, clinical-group rhythms, adjusted case-record volume, sensitivity analyses, and frozen-origin forecasting in the Turkish 112 EMS context. Composition differences were modest, but selected categories showed larger hourly and seasonal shifts. Circadian acrophases spanned afternoon and evening; relative amplitude was highest in Trauma and lowest in Respiratory case-record rows.
These patterns describe recorded case-level EMS workload, an operational proxy for population demand rather than a direct measure of it. Requests for assistance closed without resource assignment could not be enumerated; accordingly, the reported volumes quantify the recorded workload generated by demand that resulted in EMS resource deployment.
Because the temporal anchor was call receipt rather than symptom onset, the observed profiles may reflect a mixture of biological onset, patient recognition, help-seeking, social activity, transport and referral processes, and documentation practices.
Overall case-record volume followed a broad daytime-evening plateau peaking at 21:00. Helander, et al Reference Helander, Formica and Bergen-Cico11 reported a dominant mid-afternoon peak across 311 million United States activations, with three exception patterns—assault, overdose/poisoning/ingestion, and penetrating trauma—peaking after 18:00. Protopapas, et al Reference Protopapas, Mamais and Constantinou6 reported the highest Cyprus ambulance-call volume between 08:01 and 12:00, whereas case-record volume in the present study remained elevated into the evening. The Musculoskeletal group had the earliest 24-hour acrophase (14:41) and the Psychiatric group the latest (19:14). The Trauma acrophase (16:06) was close in clock time to the 17:08 Ferrara trauma-call peak reported by Manfredini, et al. Reference Manfredini, La Cecilia and Boari19 The 4.5-hour spread indicates diagnosis-specific timing, but these data cannot identify its causes.
Cohen, et al Reference Cohen, Rohtla, Lavery, Muller and Mittleman20 pooled 30 myocardial infarction and 19 sudden cardiac death studies and reported a morning excess; Crnko, et al Reference Crnko, Du Pre, Sluijter and Van Laake4 discussed circadian sympathetic activation, hemostatic shifts, and reduced fibrinolysis as potential contributors. The cardiovascular acrophase (15:36) was estimated from call-receipt time, whereas cited clinical studies used event or symptom onset and narrower cardiovascular outcomes. The later acrophase may partly reflect these differences, but the present data cannot determine its cause.
The Psychiatric group in the present study had the latest acrophase (19:14), later than the 14:45 acrophase in Ferrara. Reference Manfredini, La Cecilia and Boari19 Manfredini, et al discussed this pattern alongside aggressive-behavior reports but called the serotonergic explanation speculative. Because this category did not separate aggression or self-harm, the contrast suggests that psychiatric timing is sensitive to setting and case mix, not a universal clock time. Women comprised 64.8% of Psychiatric case-record rows; sex-specific timing was not estimated.
The Respiratory group had the lowest circadian amplitude (28.6% of MESOR) and a small midnight elevation. Neves, et al Reference Neves, Albuquerque, Quintela and Costa5 reviewed nocturnal and early-morning worsening of asthma symptoms, whereas Buff, et al Reference Buff, Bavli, Bloch, Serebryansky and Aman21 found age-specific presentation peaks; symptom and presentation timing may differ. The model fitted the pooled profile closely (R² = 0.940), but the midnight elevation was not tested separately.
Overall case-record volume was highest in summer and lowest in winter, unlike the winter maximum reported by Protopapas, et al. Reference Protopapas, Mamais and Constantinou6 Model-standardized Trauma shares were 25.7% in summer versus 18.1% in winter; Respiratory shares were 9.7% in winter versus 3.6% in summer, resembling TORCH’s winter chronic obstructive pulmonary disease (COPD) exacerbation pattern. Reference Jenkins, Celli and Anderson22 These contrasts can inform seasonal readiness through monitoring of summer trauma and winter respiratory case mix.
Monday was the busiest day (IRR = 1.11), Saturday the quietest. Protopapas, et al Reference Protopapas, Mamais and Constantinou6 termed this “Monday Syndrome,” attributing it to deferred weekend calls, return-to-work stress, and occupational injuries. Cantwell, et al Reference Cantwell, Morgans, Smith, Livingston, Spelman and Dietze12 likewise reported a Monday peak for medical demand in Melbourne, Australia.
Frozen-origin evaluation across all 365 held-out 2025 days yielded MASE = 0.722 and 96.2% interval coverage for the selected weekly Fourier model with ARIMA errors. Its RMSE was slightly lower than that of the frozen 2024 day-of-week mean benchmark (11.94 versus 12.03 case-record rows/day); incremental point-forecast improvement was modest. The MASE was numerically close to the 0.68 internal and the 0.73 external values reported by Monks, et al Reference Monks, Harper, Allen, Collins and Mayne14 but was not directly equivalent. They evaluated rolling 7-84-day forecasts of calls resulting in ambulance dispatches across multiple United Kingdom ambulance-service series, whereas this study evaluated one frozen 365-day forecast of case-record rows in a lower-volume provincial system. After the training-only candidate comparison, residual autocorrelation at lag 7 remained a diagnostic warning that weekly dependence was not fully captured. The forecasting model represented weekly periodicity only; seasonal and diagnosis-specific patterns were estimated in separate analyses rather than included as forecast predictors. Thus, the holdout quantifies transfer from 2024 to the immediately subsequent 2025 within one provincial series, not general forecasting validity.
Significant group rhythms describe average temporal structure rather than precise prediction of individual hours or days. They do not by themselves justify separate staffing models; forecasting remains proof of concept, not deployment validation.
Strengths include the province-wide routine 112 dataset, integration of diagnostic composition and circadian analyses with adjusted-volume modeling, and a full-year chronological holdout forecast. The 2024-2025 split follows the temporal evaluation principle used in earlier EMS forecasting studies. Reference Channouf, L’Ecuyer, Ingolfsson and Avramidis13,Reference Monks, Harper, Allen, Collins and Mayne14
Limitations
This study has several limitations. Single-province findings may not generalize to metropolitan or other climatic settings. Because the separate all-contact 112 log was outside the data permission, the difference between total inbound contacts and EMS case-record volume could not be quantified; forecasts therefore targeted aggregate daily recorded EMS case-record volume, not total all-contact 112 demand. Anonymization left no linkable patient key, so recurrent use across incidents could not be assessed, high-frequency users may have contributed multiple records, and the incident-level sensitivity analysis did not resolve such recurrence. The study-specific chapter-score resolver lacked a clinical gold standard; first-listed-code and single-code sensitivity analyses quantified but did not eliminate classification effects. Missing diagnostic and triage fields reduced denominators without imputation. Field triage was generally recorded after patient assessment and was not interpreted as dispatch priority or as evidence for staffing or resource allocation. Unavailable symptom-onset-to-call intervals may shift acrophases relative to clinical onset. Pooled-profile R² describes fit to 24 mean hourly values; low full-cell R² indicates substantial unexplained hour-date variation. Forecast metrics quantify transfer from the 366-day 2024 training cycle to the immediately subsequent frozen 2025 full-year holdout, not annual seasonality, between-year variability, or external validity. Without a formal 2024 influence analysis, disproportionate effects of unusual events cannot be excluded. Weather, air-quality, and complete auditable local-event variables were unavailable; the holiday/Ramadan residual audit was post hoc and descriptive (Supplementary Material 4). These constraints motivate multi-year external validation with environmental and calendar predictors and prospectively captured onset, priority, service-duration, station, and shift data.
Conclusion
The EMS case-record volume in a Turkish provincial system showed distinct clinical-group patterns, with 24-hour acrophases spanning approximately 4.5 hours. In the frozen 2025 holdout, the selected model achieved MASE = 0.722 and only a small RMSE improvement over the 2024 day-of-week mean benchmark. These findings identify candidate temporal patterns for prospective operational evaluation; their value for staffing and resource allocation requires validation using station-, shift-, acuity-, and service-duration-level outcomes.
Supplementary Materials
To view supplementary material for this article, please visit https://doi.org/10.1017/S1049023X26109133
Data Availability
Individual-level Turkish 112 EMS records are not publicly available owing to institutional restrictions on their release. De-identified summary data may be requested from the corresponding author, subject to provincial health authority approval. A data-free analytical code archive covering the classification, cosinor and bootstrap, interaction, regression, sensitivity, and forecasting analyses, together with an input-schema description and software-environment specification, is provided as an accompanying supplementary file. The archive contains no individual-level records or identifiers.
Author Contributions
Sefer Ozkaya: Conceptualization, methodology, software, formal analysis, investigation, data curation, writing — original draft, writing — review and editing, visualization, and project administration. Mehmet Serkan Yurdakul: Validation, writing — review and editing, and supervision. Both authors meet all four International Committee of Medical Journal Editors (ICMJE) criteria for authorship, read and approved the final version of the manuscript, and agree to be accountable for all aspects of the work.
Funding
This research did not receive any specific grant from funding agencies in the public, commercial, or not-for-profit sectors.
Competing Interests
Sefer Ozkaya declares no competing interests. Mehmet Serkan Yurdakul declares no competing interests.
Use of AI Technology
Large language model tools (Anthropic Claude, 2026; Anthropic, San Francisco, California USA) were used to support language editing, structural organization, and consistency checking during manuscript preparation, in accordance with the Cambridge University Press Research Publishing Ethics Guidelines. All scientific content, study design, analytical decisions, interpretation of findings, and final wording remained the sole responsibility of the authors, who reviewed and verified every sentence of the submitted manuscript.