





The emergence of the COVID-19 pandemic caused disruption in the way of living of people from all walks of life, including their access to food. To mitigate the spread of the virus, governments imposed quarantines but the negative effects were still far reaching – ranging from economic, social, environmental, health and nutrition(Reference Mofijur, Fattah and Alam1,Reference Headey, Heidkamp and Osendarp2) . Globally, more people were projected to experience moderate to severe food insecurity, which meant a larger number of hungry people worldwide(3). In Guatemala, for example, the COVID-19 pandemic was reported to affect household income, food security and dietary patterns(Reference Ceballos, Hernandez and Paz4). In rural communities in Bangladesh, a reduction in income was reported together with changes in the amount and type of food eaten during the pandemic(Reference Kundu, Banna and Sayeed5). Food prices of staples increased, and diet diversity was generally lower during the COVID-19 pandemic in Burkina Faso, Ethiopia and Nigeria(Reference Madzorera, Ismail and Hemler6). Dietary habits were also reported to have changed across various population groups – favourable changes such as increases in number of meals eaten, fresh produce and home cooked meals and negative changes such as increases in consumption of processed foods and empty-calorie foods(Reference Bennett, Young and Butler7).
Also for the Philippines, loss of income and reduced job opportunities were reported during the pandemic(8), while 62·1 % of households that participated in a rapid nutrition assessment experienced moderate to severe food insecurity(Reference Angeles-Agdeppa, Javier and Duante9). Although there are data available on the socio-economic consequences of the COVID-19-related quarantine for households, it is unknown how it has affected the food and nutrition security situation of Filipino adolescents. Prior to the pandemic, food insecurity of adolescents was already estimated to be high and associated with poor health and mental health outcomes(Reference Dush10); albeit, it has not been researched as much in comparison to younger children, especially in the context of crises which may further magnify food insecurity.
This study was conducted in response to the call to collect and analyse data related to the impact of COVID-19 on children(11). As such, we aimed to describe the effect of the COVID-19 community quarantine on the food security, food behaviours, dietary diversity and households’ food sources and purchasing among Filipino adolescents. Additionally, we explored which factors, including well-being and mental health, were associated with the household’s FS as perceived by adolescents and meeting recommended minimum dietary diversity scores (MDDS) before and during community quarantine.
Materials and methods
Ethical consideration
Data used for this study came from the larger Ten2Twenty Project, which aimed to investigate the disparity between nutritional intake and micronutrient status of urban (Muntinlupa, Manila) and rural (Nagcarlan, Laguna) Filipino adolescents. The Cardinal Santos Medical Center gave approval for the project protocol (CSMC 2019-030). Informed consent and assent were secured from the parent or caregiver and child, respectively. The Ten2Twenty Project was conducted according to the principles set in the Declaration of Helsinki.
Study area and selection of participants
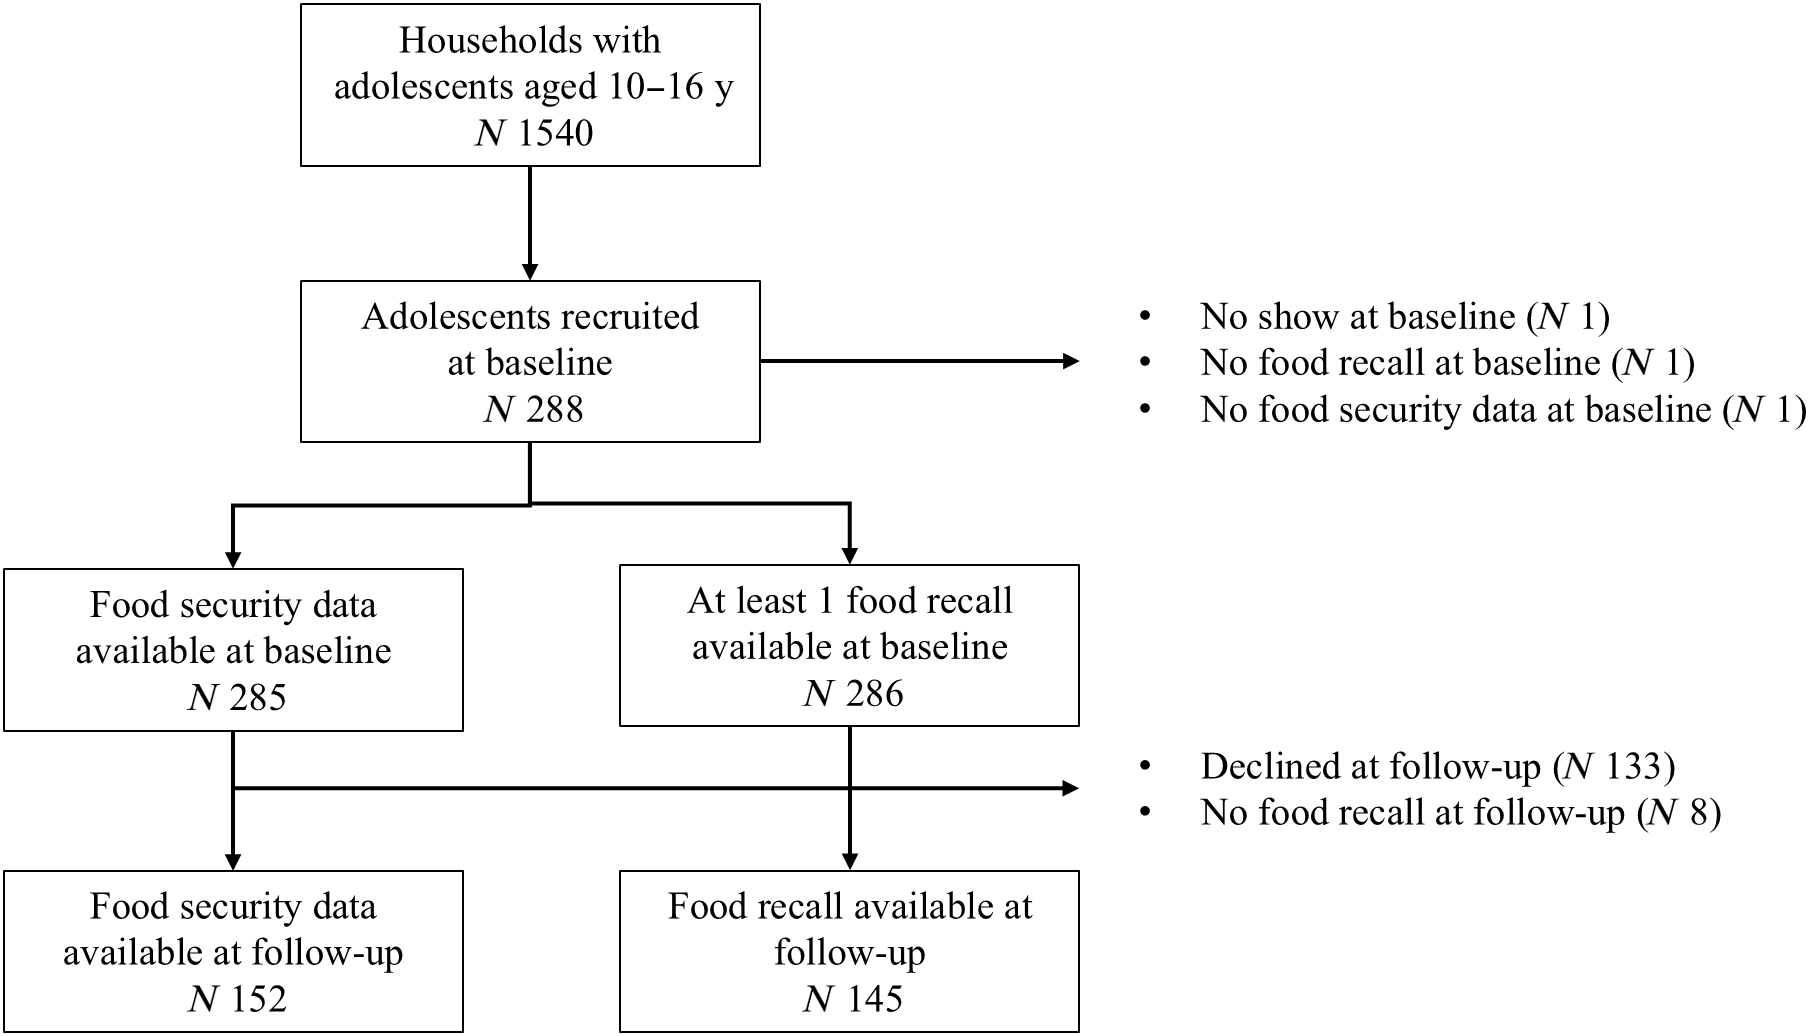
For the purpose of this current study, data were only collected at the rural site, and data analysis was restricted to adolescents who participated both at baseline and at follow-up. Nagcarlan is found South of Manila and has fifty-two barangays (villages). All of the twenty-one lowland barangays were considered for inclusion in the current study. However, the verification of the list of households obtained from the Municipal Planning and Development Office revealed that some barangays only had a few households with children in the target age range, and a few households were registered in certain barangays but actually resided elsewhere. Therefore, the final list included fifteen barangays from which 288 adolescents aged 10–16 years were recruited based on random selection of households. The target number of adolescents recruited per barangay was proportionate to the number of residing households with adolescents. Baseline data collection (T1) took place from October to December 2019, while the subsequent follow-up study (T2) was carried out from August to October 2020, which was 6–8 months after a lockdown due to COVID-19 was first declared. Sample size calculation for this study was not undertaken since target recruitment was based on the objectives of the primary study (an intervention study that was cancelled due to COVID-19). The overview of the participant selection for inclusion in the analyses is shown in Figure 1.
Flow chart of participant recruitment at baseline (T1) and follow-up (T2).

Baseline (T1) data collection
Data were collected on two non-consecutive days at T1. Self-administered questionnaires in Tagalog-English (Taglish) that underwent face validity testing were completed by both the adolescent and their mother or caregiver (henceforth referred to as caregivers) in a central location per cluster of barangays. The clusters were based on proximity of barangays to each other. Household food security was determined in the perspective of the adolescent by administering the scale developed by Blumberg et al.(Reference Blumberg, Bialostosky and Hamilton12) It provides information on ‘food that did not last’, ‘balanced meal’, ‘cut or skipped meals’, ‘ate less than should’, ‘cut or skipped meals often’ and ‘hungry but did not eat’. The total score from the aforementioned was used to classify adolescents and their household as food secure or insecure. A total score of 0–1 is classified as food secure, while a score of 2 or greater is classified as food insecure(Reference Gulliford, Mahabir and Nunes13). Wealth index was determined by principal component analysis based on household assets and source of drinking water(Reference Hjelm, Mathiassen and Miller14). Type of living condition (informal v. formal) was determined using the UN Habitat criteria for informal settlements(Reference Kassim, Jaidka and Kanyinda15). A participant was classified as an informal settler if the household lacked one or more of the following: (1) access to safe water (source of drinking and cooking water); (2) access to adequate sanitation facilities (public or private toilet); (3) sufficient living area wherein no more than three people share the same bedroom (number of bedrooms and number sleeping in the bedroom); (4) durability of materials of dwelling place (roofing, wall and floor materials) and (5) security of tenure of dwelling place (dwelling type, lot and house tenure). We classified improved sources of drinking and cooking water and improved toilet facilities based on the Philippines National Demographic and Health Survey definition(16).
Body weight and height were measured by research assistants using a calibrated digital weighing scale (SECA 813) and microtoise, respectively. Prior to measuring weight, participants were asked to remove footwear and empty their pockets, whereas girls with ponytail or braids were asked to let their hair down prior to measurement of standing height. Both weight and height were measured twice; a third measurement was obtained when the difference between measurements was larger than 0·10. The average of the two closest measurements were used for the analysis. Age at T1 was determined from the date of anthropometric measurements and date of birth whilst age at follow-up was based on date of birth and date of interview of the follow-up survey. Thereafter, nutritional status was classified using the WHO Anthro Plus software(17). A participant was classified as stunted if height-for-age z-score was <−2SD, as thin if BMI-for-age z-score (BAZ) was < −2SD and as overweight or obese if BAZ was ≥1SD. However, this classification was only possible at T1 since we did not obtain height in the follow-up survey. Dietary intake was determined by 24-h food recalls conducted on one or two non-consecutive days. Food pictures, measuring cups and spoons were used to estimate portion sizes of usual foods consumed. For participants with data from two recall days, random selection was used to determine the food recall day for inclusion in the current analysis.
Screening for potential depression was undertaken using the Short Mood and Feelings Questionnaire (SMFQ) which contains thirteen items(Reference Angold, Costello and Messer18). Participants were asked whether the statements were not true, sometimes true or often true for them. An overall score is calculated from the sum of points awarded for each item – the maximum score possible was 26. There is no prescribed cut-off point for the instrument, but those who have higher total scores are more likely to suffer from depression(Reference Thabrew, Stasiak and Bavin19). Perseverance and optimism were determined using the Engagement, Perseverance, Optimism, Connectedness, and Happiness well-being questionnaire(Reference Kern, Benson and Steinberg20). Participants rated statements for frequency that these applied to them, with answer categories ranging from almost never (score = 1) to almost always (score = 5). Thereafter, an average score was calculated from four questions in each domain.
Data collection at follow-up (T2)
All recruited participants at T1 were eligible for the follow-up study (T2), which was undertaken via phone survey, due to the community quarantine imposed by the Filipino government. Data collection took place over 2 days. On day 1, questions on household purchasing and other relevant topics before and during the COVID-19 quarantine period were answered by the caregiver whilst the food security questionnaire, SMFQ and estimated body weight changes were answered by the adolescent. On day 2, a qualitative recall of foods eaten in the past 24 hours was conducted with the adolescent.
To measure diet diversity, we used the Minimum Diet Diversity for Women(21). This method was selected since there is no established method for the assessment of dietary diversity of adolescents. A qualitative assessment of the food intake was undertaken by giving a score of 1 when a participant consumed from the food group without considering the quantity consumed. This method was followed since no food quantities were reported during the follow-up survey because of time restraints. Thereafter, food items from the 24-h food recall were classified into ten food groups detailed in the Minimum Diet Diversity for Women guideline. A dietary diversity score (MDDS) of five is recommended as the minimum number of food groups to meet micronutrient requirements(21). A previous study among Ethiopian adolescents also used the Minimum Diet Diversity for Women (Reference Gonete, Tariku and Wami22).
Statistical analysis
All data were encoded in Excel and exported to IBM SPSS Statistics for Windows(23). The data analyses were only undertaken for those who had complete data for all variables (n 152). Continuous variables were examined for normal distribution using visual inspection of histograms and Q-Q plots. Descriptive percentages were reported with sample weights applied to derive prevalence estimates representative for rural Nagcarlan. Sample weights were also applied for all inferential statistics. We used independent samples t-test to compare continuous variables with normal distribution and Mann–Whitney U for non-normally distributed continuous variables. χ 2 test of independence was used to determine associations between categorical variables. Robust Poisson regression models were built to determine individual factors associated with food security and dietary diversity at baseline and follow-up. Factors considered were sex, age, birth order, number of siblings, nutritional status, well-being scores, SMFQ score, household size, parental structure, educational attainment and employment status of the household head, household members working overseas, wealth index, receiving cash grants, engagement in non-monetary food sourcing and mobility restrictions (T2 only). Initially, univariate analysis was undertaken. Subsequently, multivariate Poisson regression models were run for both time points incorporating all variables investigated from the initial step. Final selection of factors associated with food security and dietary diversity was based on 95 % CI resulting from the multivariate regression analysis.
Results
There were no major differences in characteristics of participants who were only included at T1 (N 285) and those who participated in both surveys and were therefore included in the current analyses (T1 and T2, N 152; Table 1).
Baseline socio-demographic characteristics of Filipino adolescents living in rural areas of Nagcarlan, who participated at baseline, or both at baseline (N 285) and follow-up (N 152)

Table 1. Long description
A table comparing socio-demographic characteristics of Filipino adolescents at baseline and follow-up. The table has 28 rows and 6 columns. Column headers are Characteristics, Baseline (N 285) n, Baseline (N 285) %, Baseline and follow-up (N 152) n, and Baseline and follow-up (N 152) %. Row labels include Profile of adolescents and Profile of households. Row 1: Sex, female, 142, 51.2, 82, 52.9. Row 2: Age, years, Median, 12.0, 12.0. Row 3: Age, years, 25th-75th percentile, 11.0-14.0, 11.0-14.0. Row 4: Birth order, Median, 2.0, 2.0. Row 5: Birth order, 25th-75th percentile, 1.0-3.0, 1.0-3.0. Row 6: Only child, yes, 41, 14.2, 20, 13.4. Row 7: Number of siblings, Median, 2.0, 2.0. Row 8: Number of siblings, 25th-75th percentile, 1.0-3.0, 1.0-3.0. Row 9: Height, cm, Mean, 145.9, 145.9. Row 10: Height, cm, SD, 11.2, 11.5. Row 11: Weight, kg, Median, 36.3, 36.0. Row 12: Weight, kg, 25th-75th percentile, 29.8-44.6, 29.1-45.3. Row 13: Nutritional status, Stunted, 50, 17.7, 24, 15.0. Row 14: Nutritional status, Thin, 31, 11.1, 15, 9.9. Row 15: Nutritional status, Overweight or obese, 26, 9.6, 14, 9.0. Row 16: Nutritional status, No data, 1, 0.3, 0, 0.0. Row 17: Household size, Median, 5.0, 5.0. Row 18: Household size, 25th-75th percentile, 4.0-7.0, 4.0-6.0. Row 19: Household members with income, Median, 2, 2. Row 20: Household members with income, Min-Max, 0-8, 0-5. Row 21: Household members working overseas, No, 254, 88.8, 140, 91.8. Row 22: Household members working overseas, Yes, 26, 9.3, 11, 7.7. Row 23: Household members working overseas, No data, 5, 1.9, 1, 0.4. Row 24: Wealth index, Poor, 90, 30.9, 55, 35.7. Row 25: Wealth index, Middle, 94, 32.3, 51, 30.2. Row 26: Wealth index, Rich, 95, 34.5, 44, 33.0. Row 27: Wealth index, No data, 6, 2.2, 2, 1.1. Row 28: Highest educational attainment of household head, No grade completed, 7, 3.0, 3, 2.0. Row 29: Highest educational attainment of household head, At least pre-elementary level, 78, 26.7, 47, 31.5. Row 30: Highest educational attainment of household head, At least high school level, 77, 26.7, 43, 28.3. Row 31: Highest educational attainment of household head, At least vocational level, 83, 29.0, 43, 28.3. Row 32: Highest educational attainment of household head, At least college level, 33, 11.9, 15, 9.6. Row 33: Highest educational attainment of household head, No data, 7, 2.7, 1, 0.4. Row 34: Household head employment status, With employment, 267, 93.0, 147, 96.5. Row 35: Household head employment status, No data, 4, 1.5, 0, 0.0. Row 36: Work location of at least 1 parent, Local, 258, 89.5, 141, 92.3. Row 37: Work location of at least 1 parent, Abroad, 10, 3.8, 5, 3.8. Row 38: Work location of at least 1 parent, Not working, 12, 4.8, 5, 3.5. Row 39: Work location of at least 1 parent, No data available, 5, 1.9, 1, 0.4.
* All data presented were collected only at baseline, with post-stratification weights applied for reporting prevalence values of categorical data.
† Baseline sample N 284.
‡ Baseline sample N 282.
§ Baseline sample N 280.
¶ Baseline sample N 279.
** Baseline sample N 278.
†† Baseline sample N 281.
Perceived food security and predicting factors
Baseline perceived household food security was 34·7 % (T1), whereas this increased to 46·4 % during the quarantine period (T2). The proportion of girls who perceived their household to be food secure was nearly twice that of boys both at T1 (44·9 % v. 23·4 %, p = 0·002) and at T2 (54·2 % v. 37·6 %, P = .007). Perceived food security followed a u-shape trend in relation to wealth index at both time points, wherein perceived food security was lowest for the middle tertile. At T1, food security was the same for those in the lowest and highest wealth tertiles, but at T2, it was highest for those in the lowest wealth tertile (Table 2).
Perceived household food security of Filipino adolescents living in rural areas of Nagcarlan before (T1) and during community quarantine (T2), according to their household wealth index classification (n 150)

Table 2. Long description
The table presents data on perceived household food security among Filipino adolescents in rural areas of Nagcarlan before (T1) and during community quarantine (T2), categorized by wealth index. The table has four rows and six columns. The columns are labeled as follows: Wealth index, Baseline (T1) Food insecure (n and percent), Baseline (T1) Food secure (n and percent), p-value, Follow-up (T2) Food insecure (n and percent), Follow-up (T2) Food secure (n and percent), and P*. The rows are labeled as Lowest tertile, Middle tertile, and Highest tertile. Row 1: Lowest tertile, Baseline (T1) Food insecure 37 36.7 percent, Baseline (T1) Food secure 18 34.6 percent, p-value 0.60, Follow-up (T2) Food insecure 27 32.1 percent, Follow-up (T2) Food secure 28 41.4 percent, P* 0.08. Row 2: Middle tertile, Baseline (T1) Food insecure 37 32.7 percent, Baseline (T1) Food secure 14 26.9 percent, p-value not provided, Follow-up (T2) Food insecure 34 38.3 percent, Follow-up (T2) Food secure 17 21.4 percent, P* not provided. Row 3: Highest tertile, Baseline (T1) Food insecure 26 30.6 percent, Baseline (T1) Food secure 18 38.5 percent, p-value not provided, Follow-up (T2) Food insecure 21 29.6 percent, Follow-up (T2) Food secure 23 37.1 percent, P* not provided.
* Based on Pearson χ 2 test of independence.
After selection of predictors from univariate analysis (Supplementary Table 1), multivariable regression analysis showed that, at T1, being a girl (PR = 1·98, 95 % CI: 1·26, 3·12), older age (PR = 1·12, CI: 1·02, 1·24) and larger household size (PR = 1·18, CI: 1·03, 1·35) were positively associated with food security while birth order rank (PR = 0·79, CI: 0·65, 0·96) and higher SMFQ score (PR = 0·93, CI: 0·87, 0·99) were negatively associated (Table 3). At T2, being a girl (PR = 1·53, CI: 1·10, 2·14), not being limited in mobility (PR = 1·53, CI: 1·14, 2·06) and engagement in both food barter and edible gardening (PR = 1·78, CI: 1·17, 2·69) were positively associated with food security, whilst SMFQ score (PR = 0·89, CI: 0·83, 0·95) remained inversely associated.
Covariates associated with perceived household food security among Filipino adolescents (N 152) living in rural areas of Nagcarlan at baseline (T1) and during the COVID-19 community quarantine (T2) in multivariable regression analysis*

Table 3. Long description
A table with two main sections, T1: Baseline and T2: Follow-up, comparing various covariates associated with perceived household food security among Filipino adolescents living in rural areas of Nagcarlan. The table has 14 rows and 6 columns. The columns are labeled as Covariates, T1: Baseline N, T1: Baseline Prevalence ratio, T1: Baseline 95% CI, T2: Follow-up N, and T2: Follow-up Prevalence ratio, T2: Follow-up 95% CI. The covariates include Sex (Boys, Girls), Body weight, Age (years), Birth order rank, SMFQ score, Household size, Mobility restrictions (Yes, No), and Engagement in non-monetary food sourcing (Not engaged, Only food barter, Only edible gardening, Both food barter and edible gardening). For T1: Baseline, the prevalence ratios and 95% confidence intervals are provided for each covariate. For T2: Follow-up, the prevalence ratios and 95% confidence intervals are provided for each covariate. Notable trends include the positive association of being a girl, older age, and larger household size with food security at T1, and the positive association of being a girl, not being limited in mobility, and engagement in both food barter and edible gardening with food security at T2. SMFQ score remained inversely associated with food security at both T1 and T2.
SMFQ, Short Mood and Feelings Questionnaire; NA, not assessed.
* Robust Poisson regression model with the food insecure as reference.
† Variables were collected at baseline except for mobility restrictions and engagement in non-monetary food sourcing.
‡ Body weight at T2 was estimated as baseline (T1) body weight adjusted for reported weight change during the follow-up survey.
§ A proxy indicator only; data shown refer to changes in household food purchasing as a result of mobility restrictions.
Food group consumption and dietary diversity
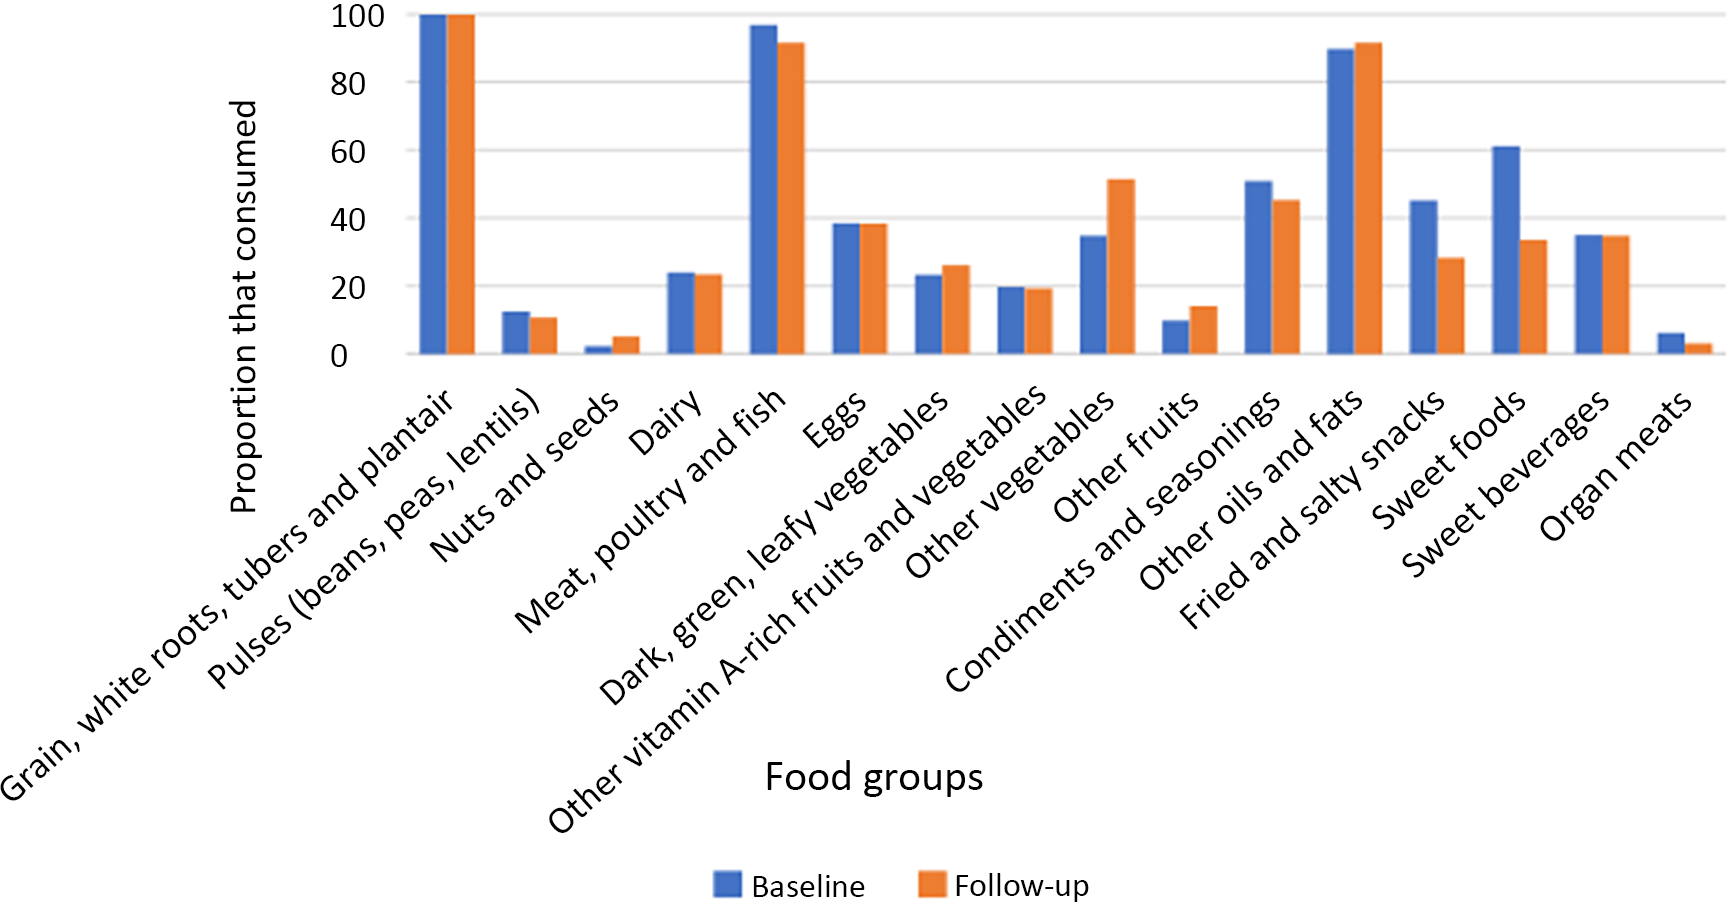
At T1, more than half of the adolescents (52·0 %) perceived their diet as good, 8·6 % as excellent, 37·4 % as fair, and 2·0 % as poor. Among those who perceived their diet quality to be good or excellent, only 20 % actually met the minimum DDS of five food groups consumed in a day. From baseline to follow-up, the proportion of adolescents who consumed nuts and seeds (2·3 % v. 5·1 %), dark green, leafy vegetables (23·3 % v. 26·1 %), other vegetables (34·8 % v. 51·5 %), and other fruits (9·8 % v. 14·1 %) increased (Figure 2). In contrast, food groups of which consumption remarkably decreased from baseline to follow-up were sweet foods (61·2 % v. 33·6 %) and fried and salty snacks (45·2 % v. 28·3 %). Comparison of food group consumption between sexes revealed some disparity. For eggs, pulses and dark, green, leafy vegetables, an increase was observed in girls while a reduction was observed in boys. In contrast, consumption of dairy, vitamin A-rich fruits and vegetables, fats and oils and sweet beverages increased among boys and reduced among girls. Meanwhile, consumption of nuts and seeds, vegetables and fruits increased for both boys and girls. There was a reduction in consumption of fried and salty snacks and sweet foods in both sexes, but the reduction was larger among girls (Supplementary Figure 1).
Dietary food group consumption of Filipino adolescents living in lowland barangays of Nagcarlan, Laguna before and during the COVID-19 quarantine period.

The median DDS was 3 (range: 2 to 7) at T1 and 4 (range: 2 to 8) at T2. Nearly half (46·1 %) of the participants had an improvement in their DDS from baseline to follow-up, while it worsened for 32·5 %, and did not change for 21·4 %. The proportion of adolescents who met the recommended cutoff for dietary diversity of 5 was a bit higher at T2 (26·4 %) than at T1 (23·2 %). For both T1 and T2, there were more girls than boys who met the minimum DDS (T1:23·9 % v. 22·5 %; T2:30·0 % v. 22·5 %). However, there were more boys than girls who had improved on dietary diversity over the two time points (48·1 % v. 44·3 %).
Predictors from univariate analyses (Supplementary Table 2) were selected for multivariable regression models. At T1, the number of siblings was a negative predictor (PR = 0·95, CI: 0·90, 1·00) for meeting the recommended MDDS, whereas educational attainment by the household head of at least high school (PR:1·18, CI:1·01–1·38) or vocational education (PR:1·19; CI:1·01–1·40), and having a household member who works abroad (PR = 1·48, CI:1·07–2·05) were positively associated (Table 4). At T2, household size (PR:0·95, CI:1·07–2·05), belonging to the highest wealth tertile (PR = 0·76; CI:0·64–0·90), and not being restricted in mobility (PR = 0·95, CI: 0·92, 0·98) were negative predictors (Table 4).
Covariates associated with dietary diversity among Filipino adolescents (N 152) living in rural areas of Nagcarlan at baseline (T1) and during the COVID-19 community quarantine (T2) in multivariable regression analysis*

Table 4. Long description
The table presents covariates associated with dietary diversity among Filipino adolescents living in rural areas of Nagcarlan at baseline (T1) and during the COVID-19 community quarantine (T2). It has 11 rows and 6 columns. The columns are labeled as Covariates, T1: Baseline N, T1: Baseline Prevalence ratio, T1: Baseline 95% CI, T2: Follow-up N, and T2: Follow-up Prevalence ratio, T2: Follow-up 95% CI. The rows are labeled as Number of siblings, Highest education of household head, Household members working overseas, Household size, Wealth index, and Mobility restrictions. The table shows the prevalence ratio and 95% confidence interval for each covariate at T1 and T2. For example, at T1, the number of siblings has a prevalence ratio of 0.95 with a 95% CI of 0.90 to 1.00. At T2, household size has a prevalence ratio of 0.95 with a 95% CI of 0.92 to 0.98.
NA, Not Assessed.
* Robust Poisson regression model with the minimum dietary diversity score (MDDS ≥ 5) not met as reference.
† Variables were collected at baseline except for mobility restrictions.
‡ Includes those who attended at least elementary school.
§ A proxy indicator only; data shown refer to changes in household food purchasing as a result of mobility restrictions.
The role of coping mechanisms during the community quarantine period
Several changes in food sources and food purchasing behaviours were reported by caregivers (Supplementary Table 3). Food purchasing from wet markets was halved during the community quarantine period. A reduction in purchasing from groceries and sari-sari stores (small stores selling various items including but not limited to foods) was also reported. In contrast, there was a slight increase in purchasing from talipapas (small public markets found within a community) and food peddlers. Obtaining food from the backyard garden also increased. The reasons given for these changes in food purchasing behaviour during the community quarantine were unavailability of some food items (n 124, 81·3 %), limitations to go to places where food used to be bought (n 145, 95·5 %), loss of income (n 146, 97·2 %) and the pandemic itself (n 144, 94·3 %). Among the households that reported to have lost income, the highest proportion belonged to the lowest wealth tertile (n 54, 36·7 %), followed by the highest wealth tertile (n 42, 33·3 %) and last the middle wealth tertile (n 48, 30·0 %). Reported loss of income was also highest among households whose heads had no or low education (Supplementary Table 4).
The quantity of food items bought was also affected. In general, there was a reduction in the purchasing of fruits, meat and poultry. However, it is notable that vegetables were bought more during the quarantine period (Supplementary Figure 2). There were 7 (4·4 %) participants who reported specific foods they bought less during the pandemic, such as rice (3·4 %), bread (1·3 %), noodles (0·9 %), sugar (0·5 %) and oil (0·5 %). In contrast, forty-nine (33·2 %) of the participants reported to have bought more rice (23·1 %), canned meat or fish (11·2 %), instant noodles (9·6 %), frozen processed foods like sausages (5·1 %), coffee (3·1 %), dried fish (3·1 %), condiments/cooking ingredients such as spices, soy sauce (2·0 %), cooked food (1·1 %), sugar (0·9 %), oil (0·9 %), bread (0·5 %) and biscuits (0·4 %). Meanwhile, 24·9 % of the caregivers reportedly purchased more vitamin-mineral supplements during the quarantine period.
Prior to the pandemic, about a third (35·2 %) of the caregivers reported to be part of the Philippine government’s social safety net program called Pantawid Pamilyang Pilipino Program (4Ps). Households that were part of this program received a cash subsidy and were also priority households to receive cash aid during the COVID-19 community quarantine. Household membership to the program was highest among those in the lowest wealth tertile (Supplementary Table 5). About half (51·1 %) of the participating households received food aid during the community quarantine period. The frequency that food aid was received ranged from 1 to 4 times in the immediate preceding 30 days, wherein most (84 %) reported to have received it only once. The food aid was shared by a range of 2–11 household members and lasted for 1–30 days. According to the eighty-two participants who received food aid, the food items they received were rice (100·0 %), canned sardines (11·1 %), instant noodles (7·3 %), fruits (0·8 %) and vegetables (0·8 %). Households that belonged to the middle and highest wealth tertile (37·5 %) had equal proportions that benefited neither from cash grants nor from membership to the 4Ps or food aid. However, those belonging to the middle wealth tertile benefited least from either cash grants or food aid (Supplementary Table 6).
Before the COVID-19 quarantine period, 68 (42·2 %) of the caregivers reported to obtain food from planted fruits and vegetables in their backyard. During the quarantine period, this increased to 78 (50·0 %). Majority (76·8 %) of caregivers reported that the community quarantine had encouraged them to engage in edible gardening. Those not engaging in edible gardening most frequently reported not to have space, followed by not having agricultural inputs, having pets or other animals or not having time. Interestingly, during the community quarantine period, engagement in edible gardening or food barter was highest among the lowest wealth tertiles, whereas the middle wealth tertile showed the lowest engagement in either edible gardening or food barter (Supplementary Table 7).
Discussion
We found that the first months of the COVID-19 community quarantine did not have negative implications on perceived food security and dietary diversity of Filipino adolescents living in rural areas of Nagcarlan. Being a girl consistently predicted better perceived food security, whereas SMFQ score was a negative predictor. The middle wealth tertile experienced less food security, while at the same time benefiting less from cash grants and engaging less often in edible gardening and food barter. Consumption of healthy foods tended to increase, while consumption of unhealthy foods decreased during the community quarantine. This was also reflected in better DDS over time, although larger household size and a higher number of siblings predicted DDS to be lower.
Our observation that perceived food insecurity decreased during community quarantine contrasts to findings amongst families in the USA wherein food insecurity increased by 20 % from before to during COVID-19(Reference Adams, Caccavale and Smith24). A similar contrast was observed with the rapid nutritional assessment conducted by the Philippines’ Food and Nutrition Research Institute (FNRI), conducted in November–December 2020, which found a 22 percent-point increase in the proportion of households that experienced moderate to severe food insecurity during the pandemic(Reference Angeles-Agdeppa, Javier and Duante9). This may be explainable for different reasons. First, our participants came from rural communities only, whereas two-thirds of participants in the FNRI study came from urban areas. Also, the FNRI study included areas that varied in risk of COVID-19 infection. At the time of our study, Laguna, the province where Nagcarlan is part of, was considered to be an area of high risk for COVID-19 infection. Hence, our data may be reflective of one specific high-risk rural area only. Second, there may be discordance between how an adolescent or his/her parent may perceive and report aspects of food security(Reference Fram, Frongillo and Jones25,Reference Carlos Chavez, Hernandez and Harris26) . Finally, parents may have prioritised children in the allocation of food(Reference Angeles-Agdeppa, Javier and Duante9). As such, impact of a potential reduction in food available to the household may have been buffered by parents for their growing children.
We found a greater proportion of boys than girls who perceived their household as food insecure. A study conducted before the pandemic among rural adolescents in Minnesota had contrasting results, indicating that girls were more food insecure than boys(Reference Shanafelt, Hearst and Wang27). Also, a multi-country study undertaken before the pandemic revealed that among 11–14-year-old children, boys experienced food insecurity more than girls; however, there was no difference between sexes in the age group of 15–18 years(Reference Fram, Nguyen and Frongillo28). Yasmin et al.(23) demonstrated that younger compared with older adolescents and girls compared to boys were more likely to be food insecure(Reference Yasmin, Yasmin and Sultan29). Our results may be partially explained by the higher score for perseverance of our girl participants. A previous study demonstrated that grit – perseverance and determination – was inversely associated with food insecurity(Reference Nikolaus, Schierer and Ellison30). We also found SMFQ score to be inversely associated with perceived food security. This finding aligns with previous studies(Reference Fram, Frongillo and Jones25,Reference Azupogo, Saeed and Wemakor31,Reference Burke, Martini and Cayir32) and is likely bidirectional(Reference Bruening, Dinour and Chavez33). A study conducted in rural areas of the Philippines showed that boys received higher food allocation than girls(Reference Senauer, Garcia and Jacinto34). However, the food distribution specific to sex of adolescents is unknown especially during times of crises. Notably, the equitable access for adolescent girls and boys to information and services has been advocated for(11). In the Philippine setting, the delivery of nutrition-specific interventions for adolescent health and nutrition development has been taken up in the Philippine Plan of Action for Nutrition 2017–2022(35,36) . However, the primary target are girls, whereas our study shows that attention may also need to be shifted to boys.
In our study, dietary diversity was inadequate at both time points although the diet shifted to being healthier during the quarantine period. This was due to a decrease in consumption of sweet foods and fried and salty foods while the consumption of vegetables and fruits increased. These results are in contrast to previous findings among US families wherein consumption of high-calorie snack foods and desserts/sweets increased by about one-third during the pandemic(Reference Adams, Caccavale and Smith24), but extend to findings of a systematic review that revealed an increased fruit and vegetable consumption during the pandemic among children and adolescents(Reference Pourghazi, Eslami and Ehsani37). Our results may be due to the change in locations from where the households obtained their food during the community quarantine period. Whereas food peddlers ranked third at baseline, they ranked first during the follow-up survey. Additionally, the restrictions in mobility could also have led to these findings. With the physical closure of schools, adolescents were confined to their homes; hence, their access to sweet, fried and salty foods may have been less than before school closure. Remarkably, belonging to the highest wealth index and not being restricted in mobility were negatively related to DDS. A large proportion of households from the highest wealth tertile had reported loss of income during the community quarantine period, yet they were less likely to be beneficiaries of social safety net initiatives. This may explain why adolescents belonging to these households were also less likely to meet the MDDS during community quarantine.
Increased consumption of vegetables and fruits may also be related to the desire to increase immunity against COVID-19, since these foods are regarded as good sources of vitamins and minerals needed to ward off sickness. In some areas in the Philippines, it was reported in March 2020 that health authorities in Central Visayas allocated funds for the procurement and distribution of vitamin C supplements to school children as this was thought to be beneficial for increased immunity(38). However, at a later time, a memorandum from the Philippine Department of Health did not recommend the ‘routine use of vitamins and minerals (e.g. vitamin C or ascorbic acid and oral zinc preparations and other combined preparations) for immune boosting purposes due to lack of global public health recommendations’(39). Yet, there was a surge in the purchasing of vitamin-mineral supplements during the COVID-19 pandemic(Reference Royandoyan40). Participating households in our study also reported more purchasing of vitamin-mineral supplements during the community quarantine period, but the specific type was unbeknownst to us.
Whereas household size or number of siblings was not related to perceived food security, it did predict MDDS negatively. Possibly, the focus of larger households is to ensure enough food to be eaten rather than diversifying the diet. In addition, having household members working abroad made an impact on dietary diversity but not on food security. The association of at least a high school attainment by the household head gives an impression of the important role of the household head in ensuring better diet quality of the adolescent children. Moreover, although we were unable to establish that engagement in home gardening was associated with the adolescents’ meeting of the recommended number of food groups to be consumed, a previous study discovered that home gardening was associated with Filipino preschool children’s dietary diversity(Reference Cabalda, Rayco-Solon and Solon41).
The 4Ps, institutionalised by the government, is the Filipino flagship program for national poverty reduction. It is designed to improve health, nutrition and education of poor households. For a maximum period of 7 years, qualified household beneficiaries enrolled in this program receive one-time livelihood assistance via microenterprise development and employment facilitation and once a month training sessions on family development which include social skills and well-being in its core. In addition to these, a conditional cash grant to support education and health and nutrition are also given. The latter is aimed to promote healthy practices and family development, among others(42).
We were unable to demonstrate an association of cash assistance among 4Ps members to perceived food security by adolescents during the quarantine period in the multivariable analysis. It is important to note that our data on cash assistance as a form of safety net during the quarantine period were limited to the assumption that households enrolled to the 4Ps at baseline also received cash assistance during the quarantine period, since they were priority beneficiaries in the Bayanihan to Heal as One Act implemented by the Philippine government during the COVID-19 pandemic(43). We were unable to verify in the follow-up survey whether households indeed received cash assistance. Thus, in reality, the proportion of households that received cash assistance may have been higher, as was also documented in the larger FNRI study.
Food barter, a trading practice, was employed by participating households in our study at both baseline and follow-up. It was an important coping mechanism for the households to which our adolescent participants belonged to. Other studies have documented various coping mechanisms and strategies by households to mitigate food insecurity during the COVID-19 pandemic. These include buying food on loan or credit; begging for food; stealing food from groceries; loan from relatives and non-relatives; shifting to cheaper food options; delayed payment of obligations; reduced expenses; using of savings; and selling of assets(8,Reference Angeles-Agdeppa, Javier and Duante9,Reference Yasmin, Yasmin and Sultan29,Reference Sohel, Shi and Zaman44,45) . Although food barter was not mentioned as a coping mechanism in the literature that we reviewed, it did make an impact on food security of our participating households during the COVID-19 community quarantine. It may have helped to ensure food security without resorting to monetary payments for food despite reported loss of income. Besides this, members of the 4Ps program are urged to keep backyard and community gardens(42). Half of our participants in the follow-up survey reported to obtain food from their fruit or vegetable garden. Households that produce vegetables and/or fruits may also use their harvest for food barter. Neither food barter nor edible gardening by themselves were predictive of food security. Nonetheless, when the household engaged in both, results showed positive food security perception by the adolescents. Hence, the potential effects on food security should not be underestimated. We are constrained to make further inferences since we did not collect information on the implementation and monitoring of 4Ps activities related to edible gardening apart from an anecdote from a former local 4Ps leader that cooperation among members for the upkeep of community gardens proved to be challenging.
With the availability of two time points of data, before as well as during community quarantine, we have provided unique insight into changes in the food security situation and dietary diversity of a sample of Filipino adolescents living in a rural area brought about by a pandemic. Our study highlights an improvement in the perceived household food security by adolescents from impoverished rural communities. Findings from this study may be useful to inform food security responses in other types of crises that impact access to food, such as leveraging food barter and home gardening as coping mechanisms. It also brings the negative impact of school food environments into question, while observing improvement in diet quality of adolescents during school closures. Our study was not free of limitations. First, the study was not designed to answer the questions we addressed and should therefore be regarded as exploratory. Second, we had to resort to data collection via phone survey at follow-up. This methodology led to loss to follow-up of some participants since some households did not have their own mobile phones or some had limited mobile phone coverage. Although baseline food security and dietary diversity were similar for those who participated and did not participate in both surveys, we could have also missed important insights as a result of this. Third, since we did not differentiate between categories of food insecurity, we may not have uncovered potential relationships distinctive to the degree of food insecurity(Reference Maitra46). And the last, our data are not generalisable to Filipino adolescents beyond those that live in rural communities and share similar socio-demographic characteristics.
In conclusion, food security and dietary diversity of adolescents aged 10–16 years, living in a rural area in the Philippines, did not deteriorate during the initial phase of the COVID-19 pandemic. Food barter and edible gardening showed to be successful coping mechanisms for better food security. Lastly, nutrition-sensitive interventions such as food aid, cash assistance, behaviour change communication and ensuring better mental health may help improve food security and/or dietary diversity of Filipino adolescents, especially among those from middle-income households who typically do not benefit from food aid and cash grants during crises.
Supplementary material
For supplementary material/s referred to in this article, please visit https://doi.org/10.1017/S0007114526108265
Data availability statement
The datasets used and/or analysed during the current study are available from the corresponding author on reasonable request.
Acknowledgements
The authors thank the children and the parents/caregivers who took part in the study. We also wish to thank the municipal mayor of Nagcarlan, Laguna and the barangay captains who allowed this study to take place in their locality. Also, we express our gratitude to the barangay nutrition scholars and health workers who assisted the research assistants during the data collection. We also thank the National Nutrition Council (NNC) of the Philippines, Food and Nutrition Research Institute-Department of Science and Technology (FNRI-DOST) of the Philippines for the nutrition education materials given to the study participants. Finally, to the dedicated research assistants who collected and encoded the data for the Ten2Twenty project.
Conceptualization of the study: Lowela Mughal, Alida Melse-Boonstra, Corazon Barba, Angelina Felix; Primary data collection: Lowela Mughal; Statistical Analysis: Lowela Mughal and Alida Melse-Boonstra; Writing of original draft: Lowela Mughal, Alida Melse-Boonstra;
Review and editing: Alida Melse-Boonstra, Edith Feskens, Corazon Barba, Angelina Felix.
All authors have read and approved the final manuscript. This article is our original work and has not been published previously nor is it under consideration for publication elsewhere.
Lowela P. Mughal: Conceptualization-Lead, Data curation-Lead, Formal analysis-Lead, Funding acquisition-Lead, Investigation-Lead, Methodology-Lead, Project administration-Lead, Writing – original draft-Lead, Writing – review & editing-Lead; Angelina dR. Felix: Investigation-Supporting, Methodology-Supporting, Project administration-Supporting, Supervision-Supporting, Writing – review & editing-Supporting; Corazon Veron Cruz Barba: Conceptualization-Supporting, Funding acquisition-Supporting, Investigation-Supporting, Methodology-Supporting, Supervision-Supporting, Writing – review & editing-Supporting; Edith J.M. Feskens: Formal analysis-Supporting, Supervision-Supporting, Writing – review & editing-Supporting; Alida Melse-Boonstra: Conceptualization-Supporting, Funding acquisition-Supporting, Methodology-Supporting, Supervision-Lead, Writing – original draft-Supporting, Writing – review & editing-Supporting.
This work was supported by the Nutricia Research Foundation. The Ten2Twenty Project in Nagcarlan was also supported in kind by Unilab Inc., Gardenia Philippines, Unilever Philippines. Wageningen University & Research gave the PhD fellowship to the first author.
Open access funding provided by Wageningen University & Research.
LP Mughal was a consultant for Unilab Inc. at the time of data collection. This company markets several products including micronutrient supplements. She also received an honorarium from Nutricia Research Foundation during the data collection. None of the funding agencies took part in the study design, analysis or interpretation of the data, writing of the report, or decision to submit the article for publication. All other authors have no competing interest to declare.





 Open access

