Introduction
Durum wheat (Triticum turgidum ssp. durum) is an important crop suitable for cultivation in areas subject to periodic droughts (Lucas et al., Reference Lucas, Salantur, Yazar and Budak2017). Considering the fact that water scarcity is a growing problem in agriculture, and achieving greater water efficiency is an urgency, durum wheat improvement has become a priority for climate-resilient strategies (Subira et al., Reference Subira, Álvaro, García del Moral and Royo2015). This is to the extent that United Nations has adopted the policy of ‘more crop per drop’ (Flexas et al., Reference Flexas, Galmes, Galle, Gulias, Pou, Ribas-Carbo, Tomas and Medrano2010), stressing on the importance of finding more drought-tolerant cultivars (Lopes et al., Reference Lopes, El-Basyoni, Baenziger, Singh, Royo, Ozbek, Aktas, Ozer, Ozdemir, Manickavelu, Ban and Vikram2015). The situation is even worse in countries such as Iran, where it is prone to severe droughts every 5–7 years and need irrigation to prevent crop failure and improve yields during droughts and shortage of rainfall (Mohammadi, Reference Mohammadi2016).
Plant breeders use primary, secondary and tertiary gene pools of wheat to identify important genes for resistance to biotic and abiotic stresses (Mondal et al., Reference Mondal, Rutkoski, Velu, Singh, Crespo-Herrera, Guzman, Bhavani, Lan, He and Singh2016). However, because of the linkage drag and its negative impact on yield and quality, the use of secondary and tertiary gene resources is not preferred and the priorities of breeding programmes is to use the primary gene pool (Sharma et al., Reference Sharma, Upadhyaya, Varshney and Gowda2013). Emmer wheat (Triticum turgidum ssp. dicoccum) is considered one of the primary and very promising gene sources for durum wheat (Lucas et al., Reference Lucas, Salantur, Yazar and Budak2017). Cross-fertilization between emmer and durum wheat is highly successful with strong and fertile progenies (Sheibanirad et al., Reference Sheibanirad, Mirlohi, Mohammadi, Ehsanzadeh and Sayed-Tabatabaei2014). Emmer contains genes for resistance to biotic and abiotic stresses and its high-nutritional qualities, high-tillering capacity coupled with ecological stability of yield has made it suitable for poor and marginal lands, low input and organic farming systems (Peleg et al., Reference Peleg, Fahima, Krugman, Abbo, Yakir, Korol and Saranga2009; Zaharieva et al., Reference Zaharieva, Ayana, Hakimi, Misra and Monneveux2010; Vaghar and Ehsanzadeh, Reference Vaghar and Ehsanzadeh2018).
Production of new and compatible cultivars to different environments requires the basic knowledge on the genetic structure of traits (Mwadzingeni et al., Reference Mwadzingeni, Shimelis, Dube, Laing and Tsilo2016). Breeding strategies such as diallel crosses can be designed to obtain essential information, such as gene function, degree of heritability and the number of genes controlling specific traits through the use of quantitative genetic methods (Christie and Shattuck, Reference Christie and Shattuck1992). The diallel cross is one of the most popular mating schemes used by breeders in plant improvement (Makumbi et al., Reference Makumbi, Alvarado, Crossa and Burgueño2018). Among the various diallel approaches, the Griffing method (Griffing, Reference Griffing1956), provides useful information on the power of parental general combining ability (GCA) and specific combining ability (SCA) which plays an important role in parental selection of crossings. Also, the Hayman method (Hayman, Reference Hayman1954) provides information on the action of genes, allele distribution, genetic components and heritability of traits. These two methods are often used together and provide comprehensive and complementary information on breeding values, parental genetic combining abilities and identification of heterotic groups for use in breeding programmes (Christie and Shattuck, Reference Christie and Shattuck1992).
Genotypes that are genetically classified into separate heterotic groups are more suitable for inter-population improvement. Consequently, with the increasing genetic divergence between heterotic groups, the ratio of GCA/SCA increases, which can help to predict the performance of top hybrids (Reif et al., Reference Reif, Gumpert, Fischer and Melchinger2007). In studying on an F2 population derived from crossing emmer with durum wheat, grain weight was found to be controlled by dominant gene action, and no reciprocal effects were observed (Millet et al., Reference Millet, Levy, Avivi, Zamir and Feldman1984). Researchers observed positive correlations between grain yield and harvest index in a population of recombinant inbred lines (RILs) derived from crossing wild emmer and durum wheat. However, these traits were negatively correlated with days to heading (Peleg et al., Reference Peleg, Fahima, Krugman, Abbo, Yakir, Korol and Saranga2009).
Therefore, to explore emmer genetic potential as the primary gene pool for durum improvement a 12 × 12 full diallel cross was performed using four locally cultivated emmer and eight cultivars of durum wheats to achieve the following objectives: (a) to investigate the combining ability and the mechanisms involved in genetic control of important agronomic traits under different irrigation regimes and (b) to discover possible new gene sources for drought tolerance in emmer wheat that may be used in durum wheat breeding programmes for water use management.
Materials and methods
Plant material and experimental conditions
In this study, 12 tetraploid wheat genotypes were selected as parents of diallel crosses, which included four locally grown emmer wheat and eight durum wheat cultivars selected from a wide range of cultivated varieties (online Supplementary Table S1). Emmer wheats were collected from farmer's field in the central Zagros of Iran and named according to the nearest village in the region (Sheibanirad et al., Reference Sheibanirad, Mirlohi, Mohammadi, Ehsanzadeh and Sayed-Tabatabaei2014). During 2017–2018 growing seasons, the 132 hybrids produced by full diallel mating (12 × 12) along with their 12 parents were field evaluated under two irrigation regimes at the research farm of the Isfahan University of Technology (32°32′N and 51°23′E, 1630 m above sea level). The experimental site has a clay loam soil (pH 7.5) with a mean temperature of 15°C and mean annual rainfall of 140 mm. There is usually little rainfall at this site from late May to mid-October which provides a manageable water stress treatment (online Supplementary Fig. S1). All of the 144 genotypes were planted in mid-November according to a simple lattice design with four replications. Each plot consisted of two 1.5 m rows and at 10 × 20 cm plant to plant and row to row distances. All plots in four blocks were irrigated from the time of planting until the time of wheat flag leaf emergence, Zadoks growth scale Z37 for cereals (Zadoks et al., Reference Zadoks, Chang and Konzak1974). After that, two irrigation regimes were applied on the experimental blocks using a volumetric counter and polyethylene pipes from a pumping station. Half of the blocks were considered for non-stress conditions where irrigation was done when 40% of the total available water around the root zone was depleted. For the water-stressed conditions (environment), block was irrigated at 80% water depletion (Allen et al., Reference Allen, Pereira, Raes and Smith1998). Considering the evapotranspiration rate was variable during the growing season, the distance between the two irrigations was also variable. Thus, the irrigation depth was determined based on the following equation:
 $$I = ( \theta _{{\rm FC}}-\theta _{{\rm irrig}}) \times D \times ( \rho _{\rm b}/\rho _{\rm w}) $$
where I is irrigation depth (cm), θ FC is the gravimetric soil-water content at field capacity (%), θ irrig is the soil gravimetric moisture percent at irrigating time (%), D is the root zone depth (cm), ρ b is the soil bulk density at root zone (1.4 g/cm3) and ρ w is the water density. The blocks were irrigated through a water pumping station by polyethylene pipes, and the amount of water consumed was measured using a volumetric counter. Beside water treatment all other field operations such as spraying, fertilization and weeding were done uniformly for all the blocks.
Measurement of the traits
From each replicate, five samples were randomly selected and the following traits were measured: plant height (PH), peduncle extrusion (PE), peduncle length (PL), number of tillers (NT), number of sterile tillers (NST), Number of productive tillers (NPT), flag leaf width (FLW), flag leaf length (FLL), flag leaf area (FLA), days to maturity (DM), days to anthesis (DA), days to heading (DH), kernel diameter (KD), kernel length (KL), grain weight per spike (GWS), number of kernel per spike (NKS), number of kernel per spikelet (NKSl), number of spikelet per spike (NSLS), spike length (SL), biological yield per plant (BY), harvest index (HI) and grains yield per plant (GY).
The selection indices including tolerance index (TOL), mean productivity (MP), geometric mean productivity (GMP), stress tolerance index (STI), yield index (YI), yield stability index (YSI) and stress susceptibility index (SSI), were calculated based on Mohammadi (Reference Mohammadi2016):
 $${\rm TOL} = Y_{\rm p}-\;Y_{\rm s}\;$$
 $${\rm MP} = \displaystyle{{( {Y_{\rm p}-\;Y_{\rm s}} ) } \over 2}$$
 $${\rm GMP} = \sqrt {( {Y_{\rm p}} ) \;\times ( {Y_{\rm s}} ) } $$
 $${\rm STI} = \displaystyle{{[ {( {Y_{\rm p}} ) \;\times ( {Y_{\rm s}} ) } ] } \over {{( {\bar{Y}}_{\rm p}) }^2}}$$
 $${\rm YI} = \displaystyle{{Y_{\rm s}} \over {{\bar{Y}}_{\rm s}}}$$
 $${\rm YSI} = \displaystyle{{Y_{\rm s}} \over {Y_{\rm p}}}$$
 $${\rm SSI} = \displaystyle{{[ {1-( {Y_{\rm s}/Y_{\rm p}} ) } ] } \over {[ {1-( {{\bar{Y}}_{\rm s}/{\bar{Y}}_{\rm p}} ) } ] }}$$
where Y s and Y p are the yields of a given genotype under stressed and non-stressed conditions, respectively,  $\bar{Y}_{\rm s}$ and
 $\bar{Y}_{\rm p}$ are the mean yields of all genotypes under stressed and non-stressed conditions, respectively.
Data analysis
The principal component analysis (PCA) was performed using Minitab program version 15 (Ryan et al., Reference Ryan, Joiner and Cryer2012), to determine associations among the 22 traits and scattering of tetraploid wheat genotypes and their crosses (Malik and Piepho, Reference Malik and Piepho2018). Before analysis of variance, normality test of data (residuals) and the Bartlett test were performed to check for homogeneity of variance (Kozak and Piepho, Reference Kozak and Piepho2018). The efficiency of the simple lattice design was estimated for all of the studied traits. The efficiency relative compared to randomized complete block design (RCBD) was almost equal for most of the traits, so that allows analysis with the RCBD. Then, combined analysis of variance in two water regimes for all the measured traits was performed by using SAS program version 9.4 (SAS Institute, 2014). Thereby, diallel analysis was performed due to the significant variance of genotypes.
GCA of parents and SCA of crosses as well as their effects on parents and crosses were calculated using model Ι (fixed model) of Griffing's method Ι (parents, F1s and their reciprocals) (Griffing, Reference Griffing1956) by using DIALLEL-SAS05 program (Zhang et al., Reference Zhang, Kang and Lamkey2005). The Griffing diallel was performed according to the following genetic statistical model:
 $$x_{ij} = u + g_i + g_j + s_{ij} + r_{ij} + \displaystyle{1 \over {bc}}\;\mathop \sum \limits_k \mathop \sum \limits_l e_{ijkl\;}\left\{{\matrix{ {i, \;\;j = 1, \;\;\ldots , \;p} \cr {k = 1, \;\;\ldots , \;\;b} \cr {l = 1, \;\;\ldots , \;\;c} \cr } } \right.$$
where u is the population mean, gi and gj are the GCA effects for the ith and jth parents, sij is the SCA effect for the cross between the ith and jth parents such that sij = sji, rij is the reciprocal effect involving the reciprocal crosses between the ith and jth parents such that rij = −rji, eijkl is the environmental error effect associated with the ijklth individual observation and p, b and c are the number of parents, block and sampled plants.
Because the parents were selected from a fixed set of germplasm, the fixed model was used. Also, the Baker ratio was calculated based on the following formula (Baker, Reference Baker1978):
 $${\rm Baker\;ratio} = \displaystyle{{\sigma _{{\rm GCA}}^2 } \over {2\sigma _{{\rm GCA}}^2 + \sigma _{{\rm SCA}}^2 }}$$
Diallel crosses analysis based on Hayman and Jinks model was used to estimate genetic parameters of traits (Hayman, Reference Hayman1954). The adequacy of the additive-dominance model for different traits under drought stress was tested using two tests, t 2 and (Vr/Wr) regression analysis (Mather and Jinks, Reference Mather and Jinks1982). If the additive-dominance model assumptions were correct, the graphical analysis was performed by using the SASHAYDIALL-SAS program (Makumbi et al., Reference Makumbi, Alvarado, Crossa and Burgueño2018), and genetic parameters were estimated. The Hayman diallel was performed according to the following genetic statistical model (Hayman, Reference Hayman1954; Makumbi et al., Reference Makumbi, Alvarado, Crossa and Burgueño2018):
 $$\eqalign{& y_{rs} = m + j_r + j_s + l + l_r + l_s + l_{rs} + k_r-k_s + k_{rs}\;\;\;\;\;{\rm if}\;( {r\ne s} ) \cr & y_r = m + 2j_r-( {n-1} ) l-( {n-2} ) l_r\;\;\;\;\;\;\;{\rm if}\;( {r = s} ) } $$
where yrs is the entry in the rth row (female parents) and sth column (male parents), m is the grand mean of the diallel table, jr is the mean deviation from the grand mean due to the rth parents, lr is the further dominance deviation due to the rth parent, lrs is the remaining discrepancy in the rsth reciprocal sum, kr is the average maternal effect of each parental line and krs is the variation in the rsth reciprocal differences (Hayman, Reference Hayman1954). The parameters in the model measure different source of variation whereby jr = a (variation due to additive genes), l = b 1 (mean dominance deviation), lr = b 2 (further dominance deviation due to the rth parental line), lrs = b 3 (residual dominance variation), kr = c (average maternal effects of each parental line) and krs = d (variation in the reciprocal difference not due to c (Hayman, Reference Hayman1954)).
Results
Analysis on the correlation of traits
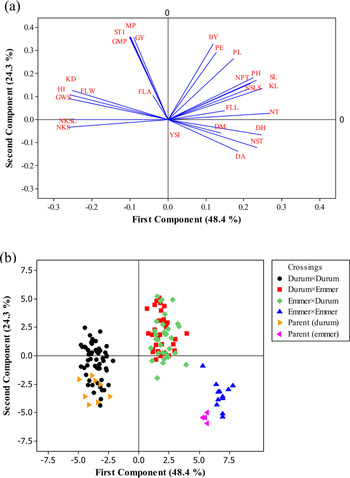
Results of PCA revealed that 74.2% of the total variation was justified by the first two components. In this respect, PCA divided traits into two major groups where DM, DA, DH, NT, NPT, NST, FLL, NSLS, SL, KL, PH, PL, PE and BY were related to emmer parents and NKSL, NKS, FLW, FLA, GWS, KD, HI and GY were associated with durum parents (Fig. 1a and online Supplementary Figs. S2a and S3a). Finally, according to the differences in plant architecture of emmer and durum wheat and the results of PCA and correlation analysis, traits including GY, HI, PH, PL, NP, NPT, DH, DM, SL, NKS, GWS, KL and KD were selected for further focus and analysis. Thereby, all genetic analysis was performed only on the selected traits using Griffing and Hayman diallel analyses.
PCA for the studied traits in 132 crossings and 12 of their parental of tetraploid wheat genotypes: (a) association of all measured traits based on correlation matrix and (b) scattering of the parent and their crosses. BY, biological yield per plant; DA, days to anthesis; DH, day to heading; DM, day to maturity; FLA, flag leaf area; FLL, flag leaf length; FLW, flag leaf width; GMP, geometric mean productivity; GWS, grain weight per spike; GY, grain yield per plant; HI, harvest index; KD, kernel diameter; KL, kernel length; MP, mean productivity; NKS, number of kernels per spike; NKSL, number of kernel per spikelet; NPT, number of productive tillers per plant; NST, number of sterile tillers; NSLS, number of spikelet per spike; NT, number of tillers per plant; PE, peduncle extrusion; PH, plant height; PL, peduncle length; SL, spike length; STI, stress tolerance index; YSI, yield stability index.

Drought stress indices
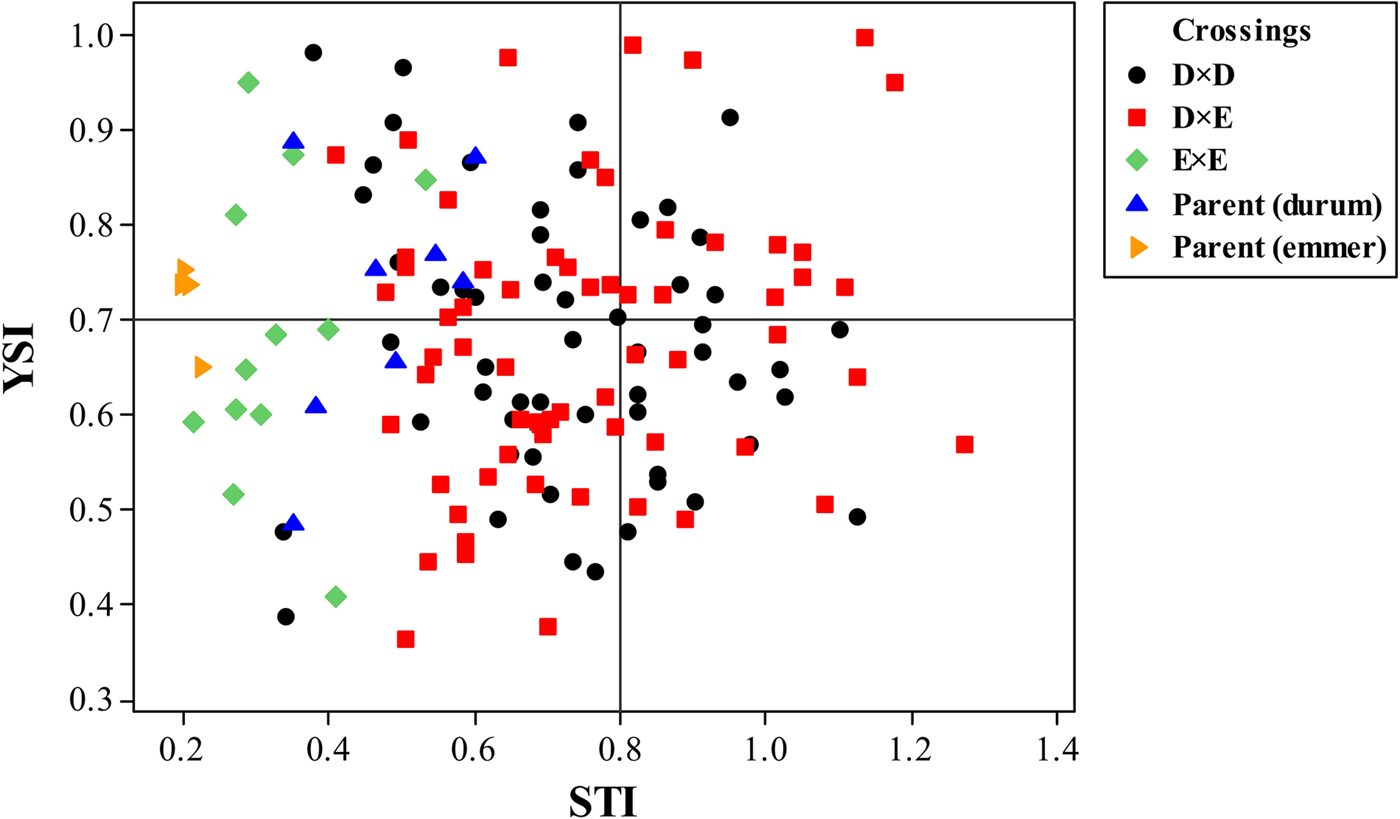
Seven stress tolerance indices were estimated for 132 crosses and their 12 parents (online Supplementary Table S3). The results indicated that indices, GMP, MP, YI and STI were positive and significant correlations with grain yield under both water-stressed and non-stressed conditions. Similarly, under water-stressed conditions, YSI was positive and significantly correlated with grain yield (Fig. 1a). Three hybrids obtained from the crossing of Zarneh × Dena, Shwa × Zarneh and Yavaros × Singerd, had higher STI and YSI indices compared to their parents and the other hybrids (Fig. 2 and online Supplementary Table S3).
Scatter plot based on two the drought-tolerant indices STI (stress tolerance index) versus YSI (yield stability index) for 132 crossings and their 12 parents resulting from a 12 × 12 full diallel mating. Crossings: D × D, cross of durum × durum and its reciprocal; D × E, cross of durum × emmer and its reciprocal; D × E, cross of emmer × emmer and its reciprocal.

Analysis of variance
The results of the combined analysis of variance indicated significant differences (P < 0.01) between all the genotypes (parents and their crosses) for all the measured traits indicating considerable genetic differences between parents and hybrids (online Supplementary Table S2). Analysis of variance showed that under both water treatments the mean squares were significant (P < 0.01) for all the measured traits except for NPT and DH. Interaction effects of irrigation and genotypes were significant (P < 0.05) for traits PH, PL, NPT, DM, NKS, GWS and HI while non-significant for NT, DH, SL, KL, KD and GY.
Distinction between genotypes was obvious on the scatter plot of PCA (Fig. 1b and online Supplementary Figs. S2b and S3b) as they were divided into three groups. The first group included parental durum and durum × durum crosses, the second group consisted of parental emmer and emmer × emmer crosses and the third group included durum by emmer and their reciprocal crosses. Since the variance of genotypes was significant for the studied traits, the performance of diallel analysis using the Griffing and Hayman method to calculate genetic effects was justified.
Diallel analysis
Griffing analysis
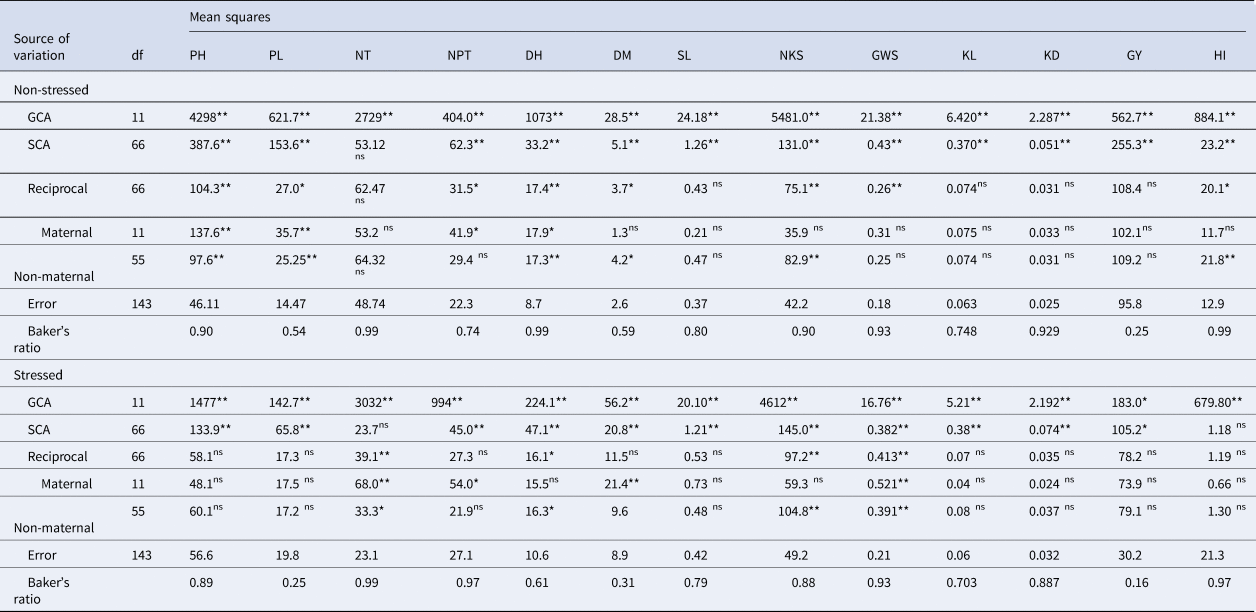
The Griffing analysis of variance indicated that the mean square of the GCA was significant (P < 0.05) for all of the measured traits (Table 1) at both water-deficit and well-watered conditions. Analysis of mean SCA indicated that there was a significant difference between hybrids for all the studied traits except for NT under the two water treatments and HI under the water-stressed conditions. Furthermore, the reciprocal effect was significant for traits PH, PL, NPT, DH, DM, NKS, GWS and HI while non-significant for NT, DH, SL, KL, KD and GY under normal water conditions. Under water-stressed conditions, the reciprocal effect was significant (P < 0.05) for traits NT, DH, NKS and GWS while non-significant for traits PH, PL, NPT, DM, SL, KL, KD, HI and GY. In general, maternal effect was not significant for major yield-related traits such as SL, NKS, KL, KD and HI under water-stressed as well as non-stressed conditions. The Baker's ratios were approaching unity for all the measured traits except for PL, DM and GY under both water environments.
Diallel analysis of variance for GCA and SCA using first Griffing's method for the studied traits under two irrigation regimes

df, degree of freedom; DH, day to heading; DM, day to maturity; GCA, general combining ability; GWS, grain weight per spike (g); GY, grain yield per plant (g); HI, harvest index (%); KD, kernel diameter (mm); KL, kernel length (mm); NKS, number of kernels per spike; NPT, number of productive tillers per plant; NT, number of tillers per plant; PH, plant height (cm); PL, peduncle length (cm); SL, spike length (cm); SCA, specific combining ability.
*P < 0.05; **P < 0.01; ns, non-significant.
The GCA effects of parental genotypes
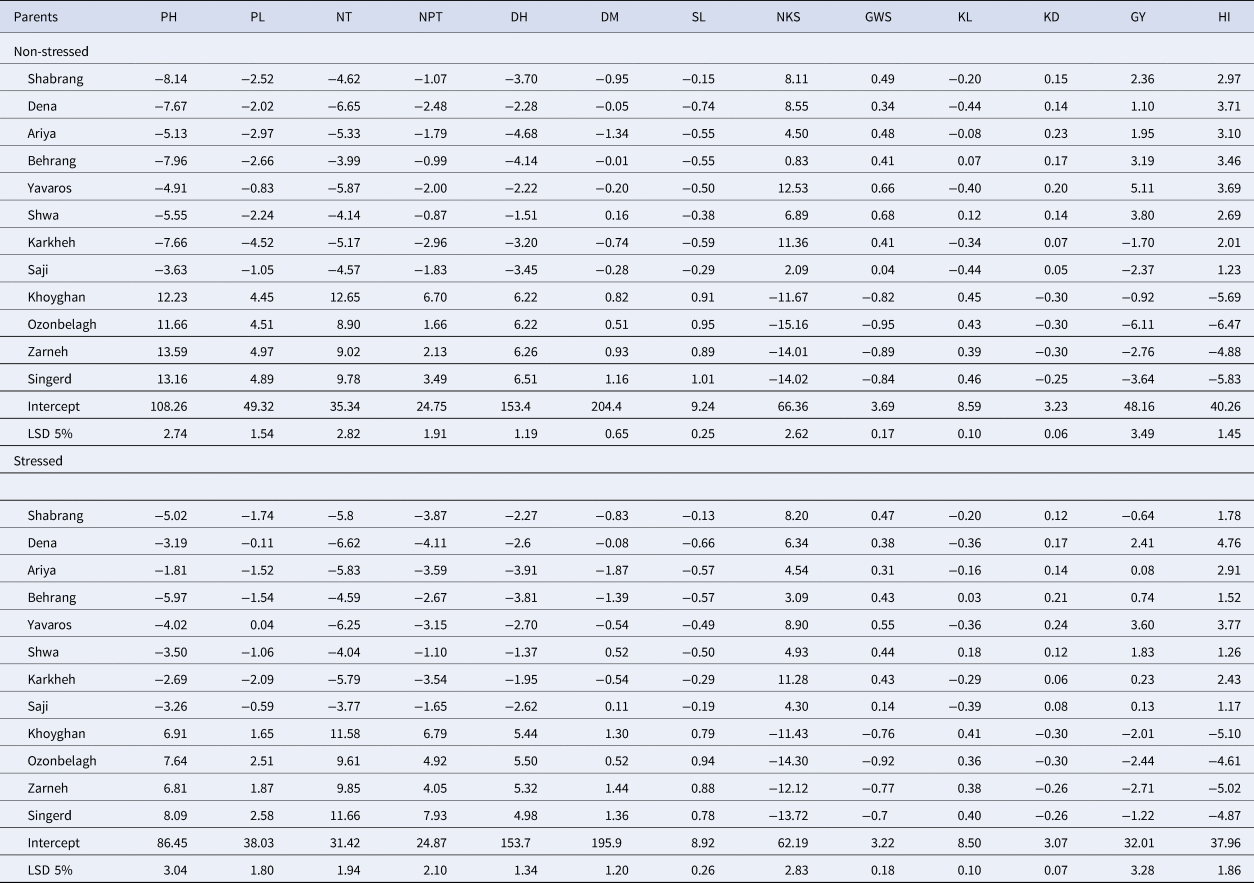
The GCA is useful to identify the best parents among the genotypes used in crosses. The estimated GCA effect for 12 parents used in this experiment was significant for all of the measured traits under both water-stressed and non-stressed conditions (Table 2). For traits NKS, KD, GWS and HI that had a positive correlation with grain yield, parents Shwa, Yavaros and Behrang under normal water conditions and parents Yavaros, Dena and Shwa under water-stressed conditions had a high-positive GCA effects. For traits PH, NT, DH and DM having a negative correlation with grain yield, parents Shabrang, Behrang and Ariya had high-negative GCA effects at water-stressed and also non-stressed treatments. Also, for traits PL, NPT, SL, and KL that had no correlation with yield, four parents of emmer wheat Singerd, Zarneh, Ozonbelagh and Khoyghan had positive and high GCA effect under both water conditions. Taken altogether, the durum cultivars had high-positive GCA effects for traits NKS, KD, GWS, HI and GY while emmer genotypes had positive GCA effects for a different set of traits including PH, PL, NT, NPT, DH, DM, SL and KL in the two water environments.
Estimates of the GCA effects for the studied traits in the F1 generation from a full diallel cross of twelve tetraploid wheat genotypes under two irrigation regimes

DH, day to heading; DM, day to maturity; GWS, grain weight per spike (g); GY, grain yield per plant (g); HI, harvest index (%); KD, kernel diameter (mm); KL, kernel length (mm); NKS, number of kernels per spike; NPT, number of productive tillers per plant; NT, number of tillers per plant; PH, plant height (cm); PL, peduncle length (cm); SL. spike length (cm).
The SCA effects of progenies
Estimation of the SCA effects of crosses under water-stressed conditions revealed that crosses Shwa × Singerd and Dena × Singerd had the highest positive significant SCA effects for GY and HI (online Supplementary Tables S4 and S5). The crosses Yavaros × Shwa and Shwa × Singerd were good combiners for NKS and GWS, respectively, and had the highest positive significant SCA effects under stressed conditions. Under water-stressed conditions, the crosses Saji × Singerd and Yavaros × Singerd showed the highest significant SCA effects for SL in a positive direction. The cross Yavaros × Singerd under both water conditions and the cross Dena × Singerd under water-stressed situation showed the highest positive significant SCA effects for traits KL and KD. Under water-stressed conditions, crosses Saji × Singerd and Dena × Singerd had the highest positive significant SCA effects, and the cross Khoyghan × Zarneh had a high-negative SCA effect for traits PH and PL. The crosses Ariya × Zarneh and Ariya × Ozonbelagh showed the highest negative significant SCA effects for trait NT, while the crosses Saji × Khoyghan and Shwa × Ozonbelagh showed the highest positive significant SCA effects for trait NPT under water-stressed conditions. For traits DH and DM under water-stressed conditions, the crosses Shwa × Khoyghan and Behrang × Zarneh exhibited the highest significant SCA effects in the negative direction for earliness.
Among the abovementioned crosses most showed non-significant reciprocal effects except for Khoyghan × Zarneh, Ariya × Ozonbelagh, Saji × Khoyghan and Dena × Singerd. Similarly, the scatter plot using the PCA showed that the hybrids obtained from the crossing of durum × emmer wheat had different behaviours relative to their parents in expressing traits. Also, the reciprocal progenies of crosses performed similarly, indicating a negligible impact of maternal and reciprocal effects (Fig. 1b and online Supplementary Figs. S2b and S3b). We furthermore found significant correlation between mid-parent values and F1 hybrids performance under non-stressed (r = 0.39) and water-stressed (r = 0.22) conditions. However, correlations between GCA versus F1 performance (SCA) under non-stressed (r = −0.11) and water-stressed (r = −0.04) conditions were non-significant.
Hayman diallel
Test of the adequacy of the additive-dominance model
To perform diallel analysis by using the Hayman method, the adequacy of the additive-dominance model and the epistatic status of the traits must be first determined. The adequacy of the additive-dominance model for different traits under both water conditions was tested using t 2 and regression analysis (online Supplementary Table S6). The model was fully adequate for traits NT, NPT, DH, NKS, GWS, KL, KD and HI under both water-stressed and non-stressed situations and trait GY under normal water conditions. It was partially adequate for traits PL and DM under non-stressed conditions and traits PL, PH and GY under the water-stressed conditions. However, the model adequacy was not confirmed for traits PH and SL under the normal water conditions and the assumptions were rejected. Based on these results actual data (untransformed) were used for all the traits including PH and LS for Hayman analysis.
Estimation of genetic parameters by Hayman analysis
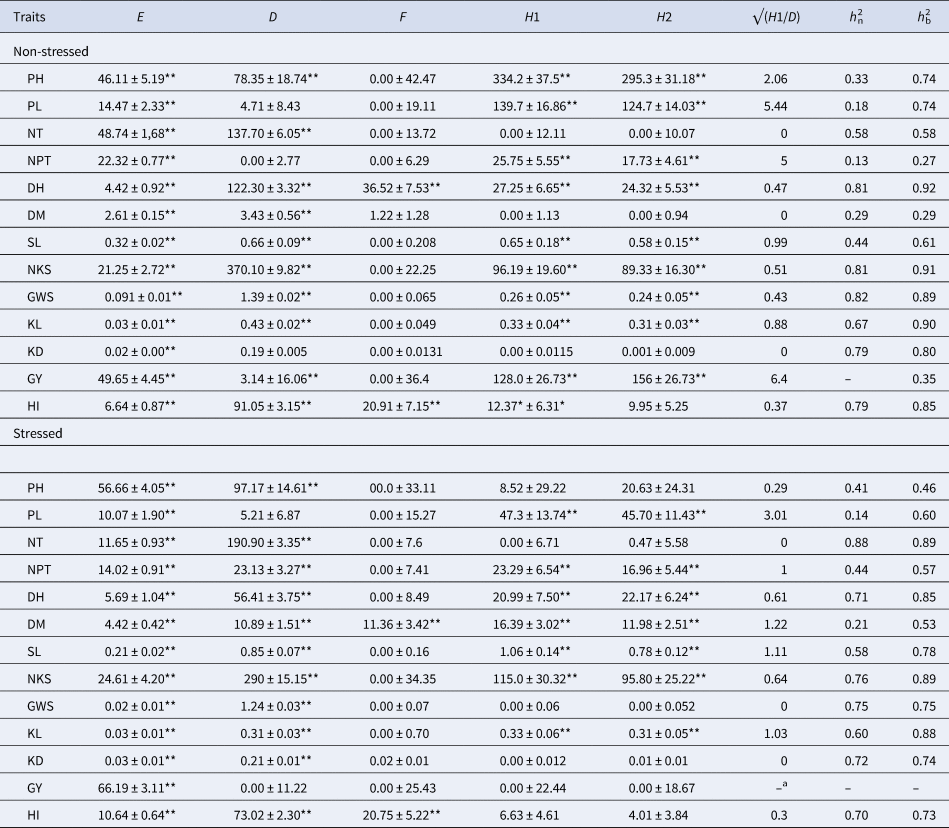
After confirming the Hayman diallel assumptions, the component of genetic variance and their related parameters were estimated to determine the genetic control of traits. The results showed that the additive component of variance (D) was highly significant for all of the studied traits except for PL and GY in the two water environments and NPT under non-stressed conditions (Table 3). Values of dominant component of variance (H1 and 2) was highly significant for traits PL, NPT, DH, SL, NKS and KL under both water-stressed and non-stressed conditions, for PH, GWS and GY under normal water conditions and for DM under water-stressed conditions. However, the values of dominant component of variance were not significant for traits NT, KD and HI under either of water treatments.
Estimates of genetic components of variation for the studied traits of tetraploid wheat in two irrigation regimes using Hayman's diallel analysis

E, environmental variance; D, additive variation; F, relative frequency of dominant and recessive alleles; H1, variation due to dominant effect of genes; H2, Variation due to dominant effect of genes correlated for gene distribution; (H1/D)0.5, degree of dominance; h 2n, narrow-sense heritability; h 2b, broad-sense heritability; DH, day to heading; DM, day to maturity; GWS, grain weight per spike (g); GY, grain yield per plant (g); HI, harvest index (%); KD, kernel diameter (mm); KL, kernel length (mm); NKS, number of kernels per spike; NPT, number of productive tillers per plant; NT, number of tillers per plant; PH, plant height (cm); PL, peduncle length (cm); SL, spike length (cm).
a Non-estimable, because one of the parameter was negative or zero.
*P < 0.05; **P < 0.01; ns, non-significant.
The E component of variance was highly significant for all traits under both water environments, which indicated that the studied traits were affected by environmental variations (Table 3). Nevertheless, its value was much lower than that of D or H components for all traits except for PL and GY under both water-stressed and non-stressed conditions and NPT under non-stressed conditions. Moderately high values of board-sense heritability (h 2b) were observed for all traits except for GY under both water treatments. Traits NPT and DM showed a lower value of h 2b under non-stressed conditions. Furthermore, moderately high values of narrow-sense heritability (h 2n) were observed for traits NKS, NT, DH, GWS, KD, KL and HI in the two water environments.
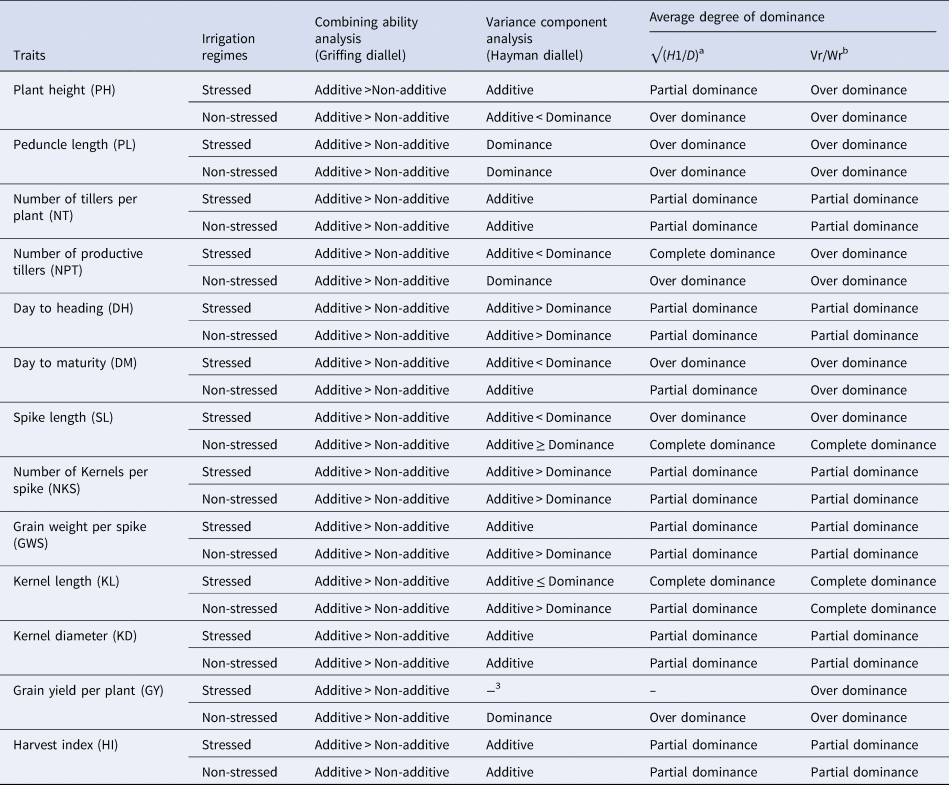
The ratio of √(H1/D) indicates the average degree of dominance. This ratio was more than unity for traits PL and NPT under both water conditions, for PH and GY under non-stressed conditions and for DM and SL under water-stressed conditions, respectively (Table 3). However, for traits NT, DH, NKS, GWS, KL, KD and HI the average degree of dominance was lower than unity under the two water treatments suggesting the presence of partial dominance. Also, Hayman's graphical analysis indicated the inheritance of traits varied from partial dominance to overdominance (Table 4 and online Supplementary Figs. S4 and S5). The Vr/Wr graphical presentation revealed that the regression line passes below the origin cutting the Wr axis in the negative region for PH, PL, NPT, DM and GY under both water conditions and SL under the water-stressed conditions indicating the presence of overdominance gene action. In contrast, traits NT, DH, NKS, GWS, KD and HI were under the control of partial dominance as the regression line cuts the Vr axis above the point of origin under both water treatments. However, for trait SL under the non-stressed conditions and trait KL under both water conditions, the regression line almost passed the point of origin, suggesting the presence of complete dominance gene action (Table 4 and online Supplementary Figs. S4 and S5).
Comparative evaluation of the average degree of dominance and the results of gene action obtained from the two methods of diallel analysis for all of the traits under two irrigation regimes

a (H1/D)0.5, degree of dominance using parameters from the Hayman analysis.
b (Vr/Wr), degree of dominance using graphical analysis of Hayman.
c Value omitted due to negative or zero of one of the components.
The F component that indicated the presence of unequal frequency of dominant and recessive genes was highly significant and positive for traits DM and HI in both water environments and DH under the non-stressed conditions. However, for the other traits the F component was not significant (Table 3). Moreover, the proportion (H2/4H1) that indicates asymmetrical distribution of positive and negative genes in the parents was found almost equal to its theoretical value (0.25) for traits PH, PL, DH, SL, NKS, GWS and KL under the non-stressed conditions and traits PL, DH and KL under water-stressed conditions. However, for other traits it indicated the unequal distribution of positive and negative alleles among the parents. Also, the estimates of the ratio ((4DH1)0.5 + F/(4DH1)0.5 − F) indicated that traits PH, PL, NPT, DM, SL, NKS, GWS, KL, KD and GY under the two water conditions and traits DM, GWS and GY under non-stressed conditions were equal to unity, showing that the dominant and recessive genes were distributed symmetrically between the parents. Trait HI had more dominant genes in the parents under both water-stressed and non-stressed conditions.
Discussion
Development of drought-tolerant wheat cultivars with improved yield-related characteristics has been the primary goal of breeders (Mwadzingeni et al., Reference Mwadzingeni, Shimelis, Dube, Laing and Tsilo2016). Therefore, the availability of genetic diversity is essential for important traits such as earliness, PH, NT and HI that are affected by drought stress in the breeding populations (Mwadzingeni et al., Reference Mwadzingeni, Shimelis, Dube, Laing and Tsilo2016; Sobhaninan et al., Reference Sobhaninan, Heidari, Tahmasebi, Dadkhodaie and McIntyre2019). Our results showed a highly significant difference between the studied parents and their crosses for all the measured traits, indicating extensive genetic variability and probability of improvement for these traits. Besides, deficit irrigation had highly significant influence on all of the traits except NPT and DH. Given that the interaction effect of irrigation and genotype was significant for some traits, the target environment might be considered to increase the efficiency of selection for variety development (Ceccarelli, Reference Ceccarelli2015).
The results of the PCA showed that the 132 hybrids and their 12 parents were divided into three main groups. The fact that hybrids obtained from the crosses of durum × emmer (and reciprocals) were in a separate group, indicates the distinct behaviour of interspecific hybrids from their parents in the occurrence of traits (Fig. 1b). This distinction was also well evident in water-stressed response and tolerance in the hybrids (Fig. 2 and online Supplementary Figs. S2b and S3b). In the current study, some of the crosses had drought tolerance indices and yield stability better than their parents. We found a positive and significant correlation between grain yield with drought tolerance indices, GMP, MP, YI and STI (Fig. 1a and online Supplementary Table S3). These indicators are the most appropriate criteria for selecting drought-tolerant genotypes (Ebrahimiyan et al., Reference Ebrahimiyan, Majidi, Mirlohi and Gheysari2012). Also, indices MP, GMP and STI were used for selecting durum wheat genotypes that have good yield under drought stress and optimal conditions (Mohammadi, Reference Mohammadi2016).
The narrow-sense heritability (h 2n) for most of the traits including DH, NT, GWS, KL, KD and HI that are important for production under drought (Mwadzingeni et al., Reference Mwadzingeni, Shimelis, Dube, Laing and Tsilo2016), were high under both water treatments, indicating the presence of more additive genetic components and reproducibility of these traits per selection. Early generation selection will result in genetic gain when h 2n is high through additive genetic components. The high h 2n estimated for GWS, KD and HI traits under both water-stressed and non-stressed situations coupled with the positive correlation between these traits and grain yield, suggests the possibility of indirect selection in early-generations through these traits to improve grain yield (Fischer and Rebetzke, Reference Fischer and Rebetzke2018; Sobhaninan et al., Reference Sobhaninan, Heidari, Tahmasebi, Dadkhodaie and McIntyre2019). Other researchers also reported a significant positive correlation between HI and GY in a durum × emmer RIL population, while these traits showed a negative correlation with DH (Peleg et al., Reference Peleg, Fahima, Krugman, Abbo, Yakir, Korol and Saranga2009). Accordingly, the analysis of genetic effects for NT, DH, NKS, GWS, KD, KL and HI traits obtained by combining variance and graphical analyses and estimation of genetic parameters were similar in both water environments. The contribution of additive effects in controlling the above traits was higher than the dominance component. Previous studies in crosses between durum wheats found that traits such as KL (Topal et al., Reference Topal, Aydin, Akgün and Babaoglu2004), HI (Solomon and Labuschagne, Reference Solomon and Labuschagne2004; Malchikov and Myasnikova, Reference Malchikov and Myasnikova2016) and NKS (Gowda et al., Reference Gowda, Kling, Würschum, Liu, Maurer, Hahn and Reif2010) were controlled by genes with additive effects. Therefore, selection for these traits in the early-generations can be successful especially as the Baker's ratios for these traits approached unity under both moisture conditions (Baker, Reference Baker1978; Fischer and Rebetzke, Reference Fischer and Rebetzke2018).
For traits PH, PL, NPT, SL and GY the contribution of dominance effects were higher than the additive component in the graphical analysis. In this respect, the average degree of dominance was more than unity for these traits under both water conditions, indicating the preponderance of over dominance type of gene action (Mwadzingeni et al., Reference Mwadzingeni, Shimelis and Tsilo2018). Previous studies in durum wheat have also reported that traits such as GY (Solomon and Labuschagne, Reference Solomon and Labuschagne2004; Gowda et al., Reference Gowda, Kling, Würschum, Liu, Maurer, Hahn and Reif2010), GWS (Gowda et al., Reference Gowda, Kling, Würschum, Liu, Maurer, Hahn and Reif2010; Malchikov and Myasnikova, Reference Malchikov and Myasnikova2016) and NPT (Solomon and Labuschagne, Reference Solomon and Labuschagne2004; Gowda et al., Reference Gowda, Kling, Würschum, Liu, Maurer, Hahn and Reif2010), are controlled by dominance genetic effects. This was not true for GWS in our study as additive gene action was more involved in control of this trait. Therefore, the efficacy of hybridization-based methods and selection for these traits in breeding programmes should be left to segregation generations (Fischer and Rebetzke, Reference Fischer and Rebetzke2018).
Using a graphical analysis based on Hayman diallel (Hayman, Reference Hayman1954), one can understand the degree of dominance and the distribution ratio of the recessive and dominant alleles in parents and finally determine the direction of dominance. The distribution of parents along the regression line under both water treatments indicated that the durum parents had the maximum dominant alleles for traits such as DH, DM, NT, KD, GWS, HI and GY due to proximity to the origin in the Vr/Wr graph. The emmer parents often showed maximum dominant alleles for a set of different traits, including NPT, PL, PH, SL, KL and NKS. The allele frequency differences in parents usually result in a difference of dominance variance against additive variance in crosses (Reif et al., Reference Reif, Gumpert, Fischer and Melchinger2007). Allele distribution differences between the durum cultivars and emmer landraces used in this study may be attributed to the post-Green Revolution breeding activities. In this era plant breeders increased yields and harvest index especially by reducing the plant height and imposing strict selections on durum germplasm. This passage from landraces and traditional varieties to modern cultivars has led to the genetic bottlenecks and the loss of diversity in breeding stocks (Fu and Somers, Reference Fu and Somers2009; Peng et al., Reference Peng, Sun and Nevo2011).
Both the GCA and the SCA indicated additive and non-additive effects in controlling traits, respectively (Griffing, Reference Griffing1956). The amount of additive effect was higher than the non-additive effect under the two water treatments for all the measured traits. This is probably because the durum and emmer parental genotypes were diverge enough resulting in a decreased ratio of the dominance versus the additive variance (Reif et al., Reference Reif, Gumpert, Fischer and Melchinger2007). The Baker ratios for most of the traits were significantly close to unity, suggesting that with the GCA effect alone, the performance of the hybrids can be predicted for most of the traits (Baker, Reference Baker1978). Thus, the GCA variance became more significant than the SCA variance facilitating prediction of parental selection. If epistasis is not involved in this genetic divergence, the ratio of the GCA variance to the SCA variance is further increased and vice versa (Reif et al., Reference Reif, Gumpert, Fischer and Melchinger2007; Gowda et al., Reference Gowda, Kling, Würschum, Liu, Maurer, Hahn and Reif2010). Similarly, the results of the additive-dominance model indicated the absence of epistasis for most of the measured traits. Breeders can choose the promising parents to create suitable combinations by estimating the effects of GCA, while estimating the effects of SCA helps breeders choose the best cross combination (Ferreira et al., Reference Ferreira, Melo, Vieira, Junior, Pereira and De souza2018). In the current study, both GCA and SCA effects were highly significant for all the studied traits, illustrating the importance of both additive and non-additive effects for drought tolerance improvement (Mwadzingeni et al., Reference Mwadzingeni, Shimelis and Tsilo2018).
Taken altogether, it seems that the use of Singerd genotype (emmer wheat) in combination with Dena and Yavaros (durum wheat) are suitable for the improvement of studied traits under drought stress. Given the presence of these parents in two divergent heterotic groups and having the most recessive or dominant alleles compared to other parents they may create remarkable genetic diversity to enhance selection over segregation generations. Thus, using pedigree and backcrossing methods, emmer wheat's genetic potential can be transferred to and stabilized in durum wheat cultivars.
Conclusion
Our findings indicated that there was a significant genetic diversity among the studied genotypes under both water-stressed and non-stressed conditions. The stress tolerance indices appeared higher in most hybrids than those in their parents. Since the emmer parental landraces used in this study are adapted to arid and semi-arid conditions of Iran and also the durum cultivars are mostly bred for Mediterranean conditions, the hybrids (durum × emmer) produced had grain yield and drought tolerance better than the parents. Both additive and non-additive effects played a role in genetic control of all studied traits. Due to the low heritability and more share of the dominance effect in genetic control of grain yield, the direct selection of the best crosses in the early generations are not suggested. Grain yield had a positive correlation with traits, NKS, KD, HI and GWS. These traits had relatively high narrow-sense heritability and more share of the additive effects in their expression that can stabilize during pedigree method. Therefore, they are suggested for indirect selection to improve grain yield. Finally, based on the high role of additive effects in controlling most of the traits, the lack of epistatic effects, high drought tolerance and stability indices of hybrids, and parental emmer and durum being in two separate heterotic groups promising results are expected for drought tolerance and improvement of other traits using emmer crossed with durum wheat.
Supplementary material
The supplementary material for this article can be found at https://doi.org/10.1017/S1479262121000435.
Acknowledgements
The authors are grateful to Dr Parviz Ehsanzadeh and Dr Mohsen Esmaeilzadeh Moghaddam for providing some of the genetic material.