


Introduction
The Ürümqi river basin drains northward from the Tien Shan to the capital city Ürümqi, of the Xinjiang Uygur Autonomous Region, China. The importance of the headwater glaciers for water supply has led to intensive study of the ice masses, and of Glacier No. 1 in particular. In May 1990, three research groups from China, the Soviet Union and the United States visited Glacier No. 1. Field work was conducted by all three groups in a cooperative effort to examine differences in mass-balance calculations resulting from sampling and estimation procedures. This field exercise and data analysis sought to answer several questions. First, can snow water equivalence (SWE) be accurately measured by a relatively small number of points on a glacier surface or do we need intensive surveys? How many samples are needed to reach an acceptable level of accuracy and how should these samples be spatially distributed? These questions are important for both basic mass-balance estimations and for ground-truthing air- and space-borne sensors.
The large number of scientists in the field allowed us to gather high-resolution data that is not feasible on an operational basis. The permanent stake network and normal sampling scheme covers approximately 50% of the glacier surface, generally confined to gentle slopes and lower elevations. Comparisons of the data covering the entire glacier with the stake network data allowed us to examine the accuracy of the stake network when used alone in mass-balance calculations. Stake networks are used on many glaciers throughout the world to measure mass balance (Reference PatersonPaterson, 1981; Reference Kotlyakov and KrenkeKotlyakov and Krenke, 1982) and an assessment of error is valuable.
Study Site
Glacier No. 1 Fig. 1 has an area of 195 ha (1 ha = 104m2), an elevation range from about 3750 to 4480 m a.s.1., and a northeast exposure. The glacier consists of two streams referred to as the east and west branches, 116 and 79 ha in area, respectively. Most of the precipitation occurs in the summer with 70% falling from May through September. Less than 10% falls from December through February.
Glacier No. 1, east and west branches. Elevations in meters above sea level, 50 m contour intervals (adapted from Reference Echelmeyer and ZhongxiangEchelmeyer and Wang, 1987). High-resolution transect refers to data set 1, stake locations are for permanent stake network (data set 3), and snow-pit locations are where density was measured. Data set 2 consisted of all points in the stake network, as well as a small subset of the transect data (153 points located primarily in zones 4–10).

Field Methods
Snow depth was measured by two basic techniques. The first measured depth at 5 and 10 m intervals along transects. Portable aluminum depth probes capable of measuring depths up to 10 m were used for the transects. The second technique used the permanent stake network where depth was measured directly from the stakes. Sample points were located using the stake network and landforms for visual reference, a 1 : 5000 scale topographic map with 5 m contour intervals, and a barometric altimeter. Many of the depth transects were measured along the stake lines allowing us to locate them accurately on the map. Most of the snow pits were excavated next to permanent stakes and others were excavated in topographically distinct locations. Snow density was measured by digging snow pits and sampling the pit wall. The winter layer was also examined in the pits to determine the extent of superimposed ice and to provide assurance that our depth probes were measuring only one year of accumulation. All field work was completed on 15 May 1990 when over 1000 depth measurements were recorded and density profiles were taken in nine snow pits. Mass-balance measurements have been made on Glacier No. 1 since 1959 by the Lanzhou Institute of Glaciology and Geocryology (LIGG). Although field work was conducted on both branches of the glacier, the analysis presented in this study is restricted to the east branch only.
Data Preparation
A digital elevation model (DEM) was constructed by placing a 50 m grid over the 1 : 5000 scale 5 m contour map of Glacier No. 1 provided by LIGG. Elevations at the grid nodes were read directly from the contour map and recorded by arbitrary line and sample coordinates, giving 1749 elevation values over a rectangular area of 437 ha. The line and sample coordinates are arbitrary in that they are not geo-coded, because no accurate values of latitude or longitude of the basin were available at the time of the analysis. Image Processing Workbench (IPW) software (Reference Frew and DozierFrew and Dozier, 1986) was used to construct a DEM from the raw elevation values and to interpolate the DEM to a 5 m horizontal resolution. The locations of the snow pits and depth measurements were registered to the DEM, providing an x,y, and z location for each data point. The accuracy of the elevations in the DEM constructed by this technique arc less than optimal, but use of broad elevation categories in the analysis reduces the effect. The relatively accurate spatial location of the transects coupled with the gentle terrain changes found on the glacier surface make inaccuracies in the elevations insignificant for our analysis. Comparison of elevations extracted from the DEM with altimeter readings taken in the field and elevations taken from the contour map show little difference.
Mass balance was estimated using several different methods. Some of the data used and techniques employed in the mass-balance estimates were common to all methods. The SWE data were divided into ten elevation zones and the mean zone values of SWE were used in most mass-balance estimations (Reference AndrewsAndrews, 1975), with the exception of estimations made by means of the entire data sets. The elevation zones were divided into 50 m intervals to insure approximately equal numbers of data points in all zones, and give detailed resolution over the glacier’s elevation range. The ten zones and their areas are listed in Table 1.
The same density model was used for all SWE calculations. Density was modeled as a function of elevation from the snow-pit data collected on the glacier. The mean density from each pit location was used and they are listed in Table 2. A line was fit visually to the data Fig. 2, which was similar to results of regression models. We believe the visual fit is justified for this application. The mean density from all pits was 361 kgm−3, the standard deviation was 41.93 kgm−3, the standard error equaled 13.98 kg m−3, and the coefficient of variation was 0.116. These statistics were based on the means of individual density measurements made in each pit and, therefore, underestimate the actual variability somewhat.
Zones used in modeling with estimated snow density and area

Snow pit summary: Glacier No. 1, 15 May 1990. Ice refers to superimposed ice

Because of the labor-intensive nature of digging and sampling snow pits, it is impossible to obtain a large density sample. However, many researchers have shown that density is conservative in relation to snow depth, and good estimations of SWE can be made with a few density measurements coupled with many depth measurements (Reference LoganLogan, 1973; Reference Elder, Dozier and Michaelsen Elder and others, 1989, 1991). A single density was assigned to each elevation zone and was used with the corresponding depth measurements to estimate within-zone SWE. The densities used in SWE estimations may be found in Table 1 with their respective zones. All SWE estimations reflect in inclusion of 0.16 m of superimposed ice found only in the lowest elevation zone,
Snow density versus elevation, east branch of Glacier No. 1, 15 May 1990. Observed snow densities are the mean values from snow-pit sites. Predicted snow densities are taken from the line fit to the observed values. These values were rounded to the nearest 10kgm−3 and are listed in Table 1.

accounting for a total of 9970 m3 SWE of about 0.01 m SWE averaged over the entire east branch area.
Data sets
Three sets of snow-depth data were used for all estimation procedures. The first set of depth measurements, referred to as set 1, included all high-resolution depth transects, totaling 1046 measurements, as described in the field methods section, but did not include the stake network data. The second set of data (set 2) consisted of the stake data, but was supplemented with data collected over all elevation ranges including a small subset of the transect data from set 1. This set consisted of 198 depth measurements. The third set of depth data (set 3) consisted of only the stake data from the long-term network with a total of 45 depth measurements.
Methods of Estimating Mass Balance
Method 1
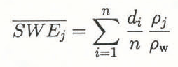
The first method used stratification of the glacier by elevation into ten zones and assumed the mean of all depth measurements in each zone to be the snow depth for that zone. This value was multiplied by the appropriate density to give within-zone mean SWE

where


The stake network covered the lower six elevation zones only, making it necessary to estimate SWE for zones 7 through 10 in order to apply method 1 to the data set. Two different techniques were used to extrapolate SWE from the network to higher elevations and these are discussed in detail below.
Method 2
The second method consisted of using the means for the entire input data sets. There is not within-zone or between-zone information from this technique. Mean depth was estimated by taking the mean of all depth data. Mean density was estimated by taking the area-weighted mean of the zone densities (Table 1).


Results and Discussion
Results from glacier subsection
Depth data from all three data sets fell within elevation zones 1 through 6, but the stake data had no points in elevation zones 7 through 10. A comparison of mass-balance estimates between the three data sets has been made over zones 1 through 6 to evaluate sampling differences only, rather than introducing differences due to estimation procedures. This analysis is based on method 1 and Equations (1) and (2), where j is summed over six, rather than ten, zones. From basic statistical properties, we expect a larger sample from a population to give us a more accurate estimate of the statistical properties of the population as a whole. Therefore, we will consider the estimates based on data set 1 to be the most accurate or “best” values, and we will compare the other data sets to set 1 results as the standard.
Total SWE storage in each zone, calculated for each data set, is listed in Table 3. Zone 1 shows a negligible difference between data sets and zone 2 is underestimated by sets 2 and 3. Differences between data sets 1 and 3 in zone 3, although greater in total volume, are smaller in SWE. Zone 4 shows significant differences between both data sets 1 and 3, and set 2. Set 2 underestimates set 1 by 0.09 m
Results of mass-balance estimates from glacier subsection, comparison of zones 1 through 6 using method 1 and data sets 1, 2, and 3. For zones 1–6: data set 1, n = 650; data set 2, n = 109; data set 3, n = 45. *indicates insignificant value 

Two interesting results follow from this analysis. First, it appears that the sparse stake network does an adequate job of estimating SWE over the portion of the glacier covered by the stakes. This result is important because mass balance has been estimated from this network for a long period of time and this technique is used in many studies throughout the world. If accurate mass-balance determinations can be made from 45 stakes rather than the 650 data points found in the same area from the high-resolution survey, then manpower and costs can be greatly reduced without compromising the results.
The second interesting result from this analysis is that the medium density survey (set 2) underestimated the best estimate of SWE by a greater amount than the sparse stake network. Set 2 had 109 sample points in the same zones, over twice as many as the stake network. One possible explanation is that these additional samples used in set 2 were all collected on the east wall of the glacier, which is relatively steep and retains less snow because of continual avalanching and sloughing. This area is not represented by the stake network. The supplementary data were clearly not representative of the zones as a whole. The limited sampling introduced a strong bias to the data because of a small total sample size, indicating the importance of locating sample points optimally, both for permanent stakes and transects. Examination of Figure 3 shows that the mean zone SWE for zones 3 through 6 (where the data sets differ) is significantly greater from the stake network than for set 2.
Snow depth versus elevation, east branch of Glacier No. 1, 15 May 1990. Mean snow depth from each data set (1, 2, and 3) are plotted against the mean elevation of the zone. The solid line represents the best fit by linear regression to the mean depths from the stake network (data set 3). The dotted line interpolates snow depth above the stake network and was forced through depth values of 1.25 and 0.80 m found at elevations of 4075 and 4225 m, respectively. See text for further explanation.

Results from entire east branch of glacier
Results from estimations of mass balance for the entire east branch method 1 and data sets 1 and 2 are listed in Tables 4 and 5, respectively. Results from method 1 and data set 3 are listed in Tables 6 and 7, each presenting the results from a different extrapolation technique. Method 2 results, using all three data sets, are averages over the entire glacier without zoning by elevation. Results are listed in Table 8, which summarizes the results from all estimation methods. Again, we will make the assumption that the zones used in method 1 coupled with the high-resolution data (set 1) produce the most accurate estimate of mass balance and we will compare the other estimates to this “best” Value.
Results from method 1 and data set 1. Mass-balance estimates for each zone.

Results from method 1 and data set 2. Mass-balance estimates for each zone

Results from method 1 and data set 3. Mass-balance estimates for each zone. Values in zones 7–10 are estimated on basis of an increase in SWE with elevation (see text)

Method 1 and data set 1 (Tables 4 and 8) indicate a mean snow depth of 1.16 m and
Results from method 1 and data set 3. Mass-balance estimates for each zone. Values in zones 7-10 are estimated on basis of a decrease in SWE with elevation (see text)

Method 1, using only the stake network data (set 3), provided a range of errors depending on the technique used to extrapolate the stake data to the higher elevations. Extrapolating the mean depth from the stake network over the entire glacier, method 2, underestimates
Mass-balance results from all estimation methods. Estimates and differences are for the entire glacier

† mass-balance estimates using alternative estimation techniques with data set 3 (see text).
by 0.08 m giving a value of 0.32 m, resulting in a 19.0% error compared to the best estimate (Table 8). If only densities from the network area are used, the greater mean density of 357 kgm−3 produces an underestimate of 0.06 m and an error of about 15%.
The stake network (data set 3) covers about half of the glacier’s surface area and encompasses the lower half of the glacier’s elevation range (3750–1000m). For this reason the available stake data must be extrapolated to the higher elevations and surface area not represented by the stake network. For application of method 1 to data set 3, two extrapolation techniques were used to estimate SWE in zones 7 through 10. For the first technique, we make the assumption that snow depth increases with elevation, a common assumption in many snow hydrology applications (U.S. Army Corps of Engineers, 1956; Reference BarryBarry, 1981). We fit a linear regression to the snow depths for each of the six zones represented by the network, using the mean depths and the mean elevations (depth = 0.0017(clev) −5.4835, R2 = 0.708, n = 6). Figure 3 shows the actual mean depths for zones 1 through 6 plotted against elevation. Based on this model, snow depth was calculated for the mean elevations in zones 7 through 10. These snow depths were used to calculate
The second estimation technique used with data set 3 assumed a linear decrease in SWE with elevation from a point of maximum accumulation. Figure 3 shows that the maximum snow depth lies in zone 7 with a mean elevation of 4075 m for both data sets 1 and 2. Above this elevation the snow depth decreases to a value approximating that found in zone 2 (see also Tables 4 and 5). If we assume that depth decreases with increased elevation, we can apply the linear regression used above in the first technique to esimate depth in zone 7 where the maximum occurs, and then use another linear relation, based on the stake network data, to estimate the decreasing depth in zones 8, 9 and 10. The linear relation forces a line through the value estimated by regression (1.25 m) at an elevation of 4075 m and the value of 0.80 m found at 4225 m, taken from zone 2. SWE values in zones 8 and 9 were taken at the appropriate elevations intersecting this line. Table 7 lists the real data, estimated data and results. Table 8 shows that the predicted
Required sample size and distribution
Sample size is an important factor in designing field surveys and in evaluating results. We have used the high-resolution data set (set 1) to calculate the necessary sample size, n′, required to be within a specified error range at a specified confidence level for snow-depth measurements in each of the ten zones (Reference CochranCochran, 1977). We calculated n′, for four accuracy levels: (1) a probable error ≤0.05 m, (2) a probable error ≤0.10 m, (3) a probable relative error ≤5% of the mean depth, and (4) a probable relative error ≤10% of the mean depth; all at the 90% confidence level. In other terms, for case 1, out estimate of the mean depth would be within 0.05 m of the population depth 90% of the time if we took the recommended number of samples.
Sample sizes are listed in Table 9, along with the sample mean depth (d), standard deviation


Examination of Table 9 shows that in the first case, with an acceptable error of 0.05 m at the 90% confidence level, a large number of samples is required to satisfy the constraints. Of the 1452 samples, 1173 or about 81% fall in zones 5 through 8. A sample requirement of this size is not likely to be operationally feasible, but is similar to our study and useful for research purposes. If an error of 0.10 m is acceptable, then only 375 measurements are necessary and a small field crew could complete a survey of this size in one day. An error of 5% of the mean depth also requires many samples (908) and is not practical. An error of 10% of the mean depth requires only 241 samples. It is noteworthy that our most relaxed constraints for calculating required sample size, that is a 90% probability of estimating the population mean depth within 10% of the mean, still requires 241 samples, or more than five times the amount of sample points in the permanent stake network. Although the stake network provides an estimate of the population mean with greater uncertainty or relative error, it docs not mean that it is not valuable. The network serves as a long-term index, which can be calibrated to the true population mean by many possible techniques.
Although we have quantified sample size requirements, we have not done so for spatial distribution of sample points. Our results clearly show the importance of sampling the entire glacier. All terrain variations such as slope, aspect, and elevation should be sampled because variability in these parameters controls variability in SWE through accumulation, redistribution, and ablation. The greatest variation in snow depth occurs in the zones with the greatest mean depth, in the region of the ELA. This region of the glacier surface contains the areas most affected by avalanches, and many of the greatest depths recorded in the field were clearly located in avalanche debris. Avalanching and sloughing increase the variance in depth markedly by scouring starting zones and accumulation areas and by depositing greater than normal depths in runout areas. In designing surveys, it may be possible to take topography into account as an index for snow-depth variability, planning greater sample frequency in the areas with greater topographic variability. Decisions for accuracy requirements and resulting sample size must be tailored to the application and resources of the investigators.
Sample statistics and required sample sizes for within-zone snow depth based on results from data set 1
n is the actual sample size for each zone from the survey, d is the sample mean snow depth,
Conclusions
An increase in precipitation and accumulation with an increase in elevation has long been recognized (Reference BarryBarry, 1981), and has been applied in many mass-balance studies. Good estimates of total mass balance can be obtained on this glacier from the stake network alone when a linear increase is applied to extrapolate SWE to the high elevations. However, individual zone errors from this technique suggest that a simple increase with elevation is not appropriate. It has also been shown that other effects such as redistribution of snow by wind and avalanching complicates the orographic effect (Reference Elder, Dozier and MichaclsenElder and others, 1989, 1991;Reference Wake Wake, 1989). Observations on the glacier indicate that snow may be moved from the high steep portions of the glacier by avalanches with some regularity and wind redistribution may complement this effect. The data from the high-resolution survey covering the entire glacier surface show a decrease in SWE as the greatest elevations are approached Fig. 3. When a linear decrease is applied to the stake data at elevations above peak accumulation, an increased accuracy in the within-zone SWE estimates follows.
Time and manpower are important considerations in designing field programs for mass-balance measurement on this glacier. There were large differences in the labor required to obtain the different data sets. The stake network was sampled for both depth and density by four people in 3 hours, giving a total of 12 man-hours. The high-resolution transects and additional snowpits required six people for 8 hours, or a total of 48 man-hours. It can easily be argued that the results obtained from extrapolation of the stake network data are adequate for mass-balance requirements such as total runoff prediction, and it is difficult to justify the additional labor required for the high-resolution surveys. However, if applications require more detailed analysis, for example snowmelt modeling and predicting the timing of runoff, then a method that produces greater spatial or within-zone accuracy is needed. On larger glaciers high-resolution surveys may never be practical or possible and perhaps only remote sensing offers a hope of obtaining detailed spatial information.
Results from this study indicate that an accurate estimate of mass balance can be determined on the east branch of Glacier No. 1 with depth data collected from the permanent stake network alone. Accuracy is increased with sampling from the greater elevations not represented by the network. Terrain variation, elevation in this case, exerts some control on accumulation, redistribution, and ablation on this glacier and mass-balance estimates are improved using this parameter. It should be noted that these results are valid only for this date and the conditions observed. The results may apply to the glacier with different antecedent meteorological conditions or at different times in the accumulation and ablation season, but more field studies are needed before this assumption can be tested.
Acknowledgements
We would like to thank Kathy Tonnessen, Mark Williams and our colleagues in China for their help in the field. Jim Frew and Jeff Dozier provided the image-processing software. The work was supported by NASA’s SIR-C and EOS programs, University of California Water Resources Center, Academia Sinica’s Lanzhou Institute of Glaciology and Gcocryology, and the USSR Academy of Science’s Institute of Geography. Constructive reviews by Helgi Björnsson and two anonymous referees greatly improved the manuscript.



