I. INTRODUCTION
Semiconductor nanostructures have received much attention as promising candidates for electro-optical devices.Reference Zhang and Wong1 In nanostructures, the carrier state density is concentrated in discrete energy levels, which enhances exciton oscillator strength and light-emitting efficiency.Reference Wu, Lin, Cheng, Wu, Ting, Chang and Ko2 As a result, the performance of nanostructure-based optical devices is expected to be improved greatly.
Among the wide variety of semiconductor nanostructures, ZnO nanostructure, as wide band gap (3.27 eV) semiconductors, is even more attractive for for use in ultraviolet (UV) light-emitting devices,Reference Bian, Liu, Sun and Liang3 surface acoustic wave devices,Reference Lee, Lee, Seo and Park4 gas sensors,Reference Calestani, Zha, Mosca, Zappettini, Carotta, Di Natale and Zanotti5 devices with luminescence properties,Reference Harada, Tanahashi and Ohno6, Reference Grigorjeva, Millers, Smits, Pankratov, Lokowski, Fidelus, Chudoba, Bienkowski and Monty7 and transparent electronicsReference Logothetidis, Laskarakis, Kassavetis, Lousinian, Gravalisis and Kiriakidis8 due to their large exciton binding energy (60 MeV) and thermal stability. ZnO thin films were usually prepared by methods such as pulsed laser deposition,Reference Ohshima, Thareja, Ikegami and Ebihara9 spray pyrolysis,Reference Ortiz, Falcony, Hernandez, Garcia and Alonso10 sputtering,Reference Gao and Li11 electrodeposition,Reference Azaceta, Tena-zaera, Marcilla, Fantini, Echeberris, Pomposo, Grance and Mecerreyes12 sol–gel process,Reference Dutta, Mridha and Basak13, Reference Mandal, Goswami, Das, Dhar and Ray14 and metal chemical vapor deposition.Reference Lee, Jeong and Myoung15 Among all these techniques, the sol–gel process is particularly attractive because of its simplicity, cheapness, large area coating, and uniformity of thickness. To improve crystalline quality or obtain better optical properties of ZnO thin films, numerous studies have concentrated on metal, alloy, and nonmetal dopants such as Na–Mg,Reference Ma, Zhao and Wang16 Mn,Reference Wang, Chen and Wang17 Co–Ga,Reference Zhu, Ye, Wang, Ye and Zhao18 Co,Reference Kumar, Kumar and Singh19 Ni,Reference Liu, Xiao, Chen, Liu and Li20 Cu,Reference Wang, Zhou and Liu21 Ce,Reference Ge, Xie and Cai22 N,Reference Zhu, Lin, Zhang, Ye, Lu, Lu and Zhan23 P,Reference Ding, Zhu and Wang24 F,Reference Tsai, Wang and Tsai25 B,Reference Zhao, Zhou, Liu and Zhou26 and B–N.Reference Liu, Shan, Lee, Shin, Kim and Kim27 For example, Tsay et al.Reference Tsay, Cheng, Tung, Tuan and Lin28 have reported that a certain amount of Sn doping in ZnO thin films markedly decreased the surface roughness, improved transparency in visible range, and gave a finer microstructure than the undoped ZnO thin films. Nian et al.Reference Nian, Hahn, Koo, Shin and Kim29 have fabricated N-doped ZnO thin films with an optical transparency above 85% in the visible range and red-shifted UV absorption edge with increasing N-doping concentration. Recently, the silica-based nanocomposites are considered the most challenging systems for the quantum confinement of ZnO nanocrystallites to obtain tunable shape, size, and properties.Reference Polarz, Neues, van den Berg, Grunert and Khodeir30–Reference Sharma, Dutta, Kumar, Singh and Pandey35 For example, Li et al.Reference Li, Yang, Fu, Yi, Wang and Chen36 reported that ZnO QDs/SiO2 nanocomposite particles showed high transparency and intense luminescence with a long phosphorescence lifetime. Basak and colleaguesReference Panigrahi, Bera and Basak37 also encapsulated 2- to 4-nm-sized ZnO quantum dots (QDs) in a SiO2 matrix applied in the field of UV photodetection and optical switches. Unfortunately, little work has been done to the study the influence of silica as a dopant on optical properties of the ZnO thin films.
In this study, silica was chosen as a dopant during the formation of ZnO sol–gel thin film. Based on x-ray diffraction (XRD) data, atomic force microscope (AFM) micrographs, and UV–visible (UV–vis) spectra, the inhibitory effects of the silica dopants on the growth of ZnO grains and the effects of microstructural change on the optical properties have been investigated.
II. EXPERIMENTAL DETAILS
The preparation and characterization of ZnO–xSiO2 thin films
All the reagents used in the experiments were of analytic grade (purchased from Sinopharm Chemical Reagent Co., Ltd., Shanghai City, People's Republic of China) and used without further purification. ZnO sols were fabricated by sol–gel method using zinc acetate, anhydrous ethanol, and diethanolamine (DMA) as the solute, solvent, and sol stabilizer, respectively. In a typical procedure,Reference Zhang, Jia, Li, Yang and Zheng38, Reference Zhang, Fa, Yang, Zheng and Zhang39 zinc acetate was first dissolved in ethanol at 50 °C, then DMA, and a certain volume of tetraethylorthosilicate (TEOS) was slowly added into the solution under fierce stirring for an hour to form transparent ZnO–SiO2 mixed sols. The volume of TEOS was controlled according to the molar ratio between ZnO and SiO2. In the sol, the molar ratio of DMA to zinc acetate was kept at 1.0, and the Zn concentration was 0.5 M. The resultant ZnNH(C2H4O)2 of the reaction results in the formation of the ZnO sol.Reference Wang, Wang, Chen, Cui and Wang40 The SiO2 sol was formed by the hydrolyzed TEOS.Reference Jia, Zhang, Wu and Zhang41 Then ZnO–SiO2 thin films were prepared by a spin coating method on glass substrates for 30 sec with a spinning speed of 2000 rpm. The glass substrates had been ultrasonically cleaned by ethanol, acetone, and distilled water for 30 min, respectively. After the spin coating, the resulting ZnO–xSiO2 (x = 0, 5, 10, and 20 mol%) thin films were annealed at 500 °C in air for 1 h, which are marked with “a,” “b,” “c,” and “d,” respectively.
The crystal structure of ZnO–xSiO2 thin films were determined by XRD (Bruker D8 advance; Bruker Axs Company, Karlsrube, Germany) with Cu Kα radiation (λ = 1.54 Å) operating at 40 kV and 40 mA with a scan rate of 0.01 2θ/sec. The surface morphology of the thin films were observed by AFM (Nanoscope IIId; Veeco Digital Instruments, New York, NY) in tapping mode at a scan rate of 1.0 Hz with commercial silicon microcantiliver probe and “J” scanner under ambient conditions (24 ± 2 °C). The tip radius, spring constant, and resonance frequency of the probe are less than 10 nm, 42.5 N/m, and 225.54 kHz, respectively. The absorption and transmittance spectra were recorded by an UV–vis spectrophotometer (Lambda 35; PerkinElmer, Waltham, MA).
III. RESULTS AND DISCUSSION
A. The characterization of ZnO–xSiO2 thin films
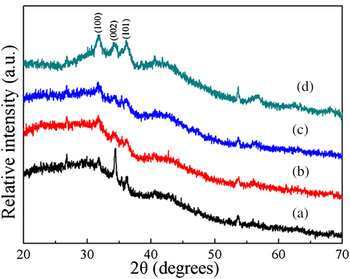
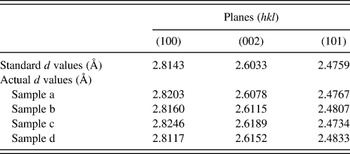
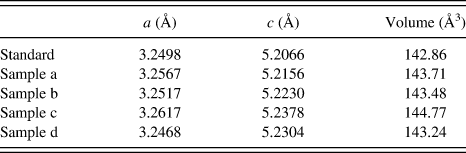
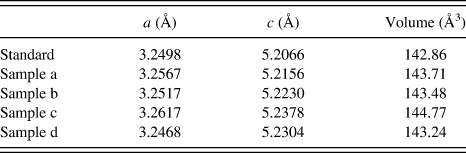
The XRD patterns of ZnO thin films with different SiO2 content annealed at 500 °C are shown in Fig. 1. A comparison of the observed d values with standard d values (JCPDS 36-1451) for prepared ZnO thin films are shown in Table I. For the prepared ZnO thin films, the crystalline structure is consistent with the hexagonal wurtzite structure. The dominant diffraction peaks in the 2θ range of 20–40 corresponded to (100), (002), and (101) planes. The intensity of the (002) peak was much stronger than that of (100) and (101) peaks in sample “a.” This indicated that the pure ZnO thin film had a high preferential c-axis orientation, which is perpendicular to the substrate surface. It is clear that the intensity of (002) peak gradually decreases with the increasing SiO2 dopant content; however, it increases with the 20% SiO2 dopant content in sample “d,” i.e., the proper increasing SiO2 dopant content inhibited the crystallinity of ZnO, and excessive SiO2 dopant content probably caused phase separation, leading to the increasing intensity of (002) peak. The average crystallite size (D) of these samples was estimated by Scherrer’s formula: D = Kλ/(β cosθ),Reference Zhu, Yao, Zhang and Yang42 where K = 0.9 is the shape factor, λ is the x-ray wavelength of Cu Kα radiation (1.54 Å), θ is the Bragg diffraction angle, and β is the full width at half maximum of the respective diffraction peak. The calculated average crystallite sizes of ZnO–xSiO2 (x = 0, 5, 10, and 20 mol%) thin films were 47, 36, 28, and 12 nm, respectively. The lattice constants of ZnO thin films can be calculated by the formula 1/d2(hkl) = 4 (h 2 + hk + k 2)/3a 2 + l2/c 2, where “a” and “c” are the lattice constants and d (hkl) is the crystallite surface distance for (hkl) indices. In Table II, the lattice constants and unit cell volumes are slightly changed after doping SiO2 because of different radii of Si (0.4 Å) and Zn (0.74 Å) in the wurtzite lattice.
X-ray diffraction patterns of ZnO thin films with different SiO2 content annealed at 500 °C for 1 h.

Comparison of observed d values with standard d values from JCPDS 36-1451 for ZnO thin films.

Lattice constants and unit cell volumes from JCPDS 36-1451 for ZnO thin films.
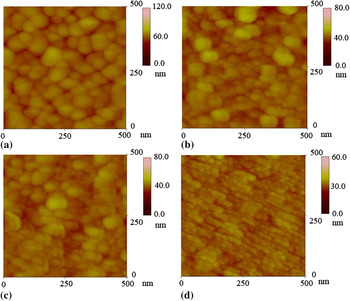
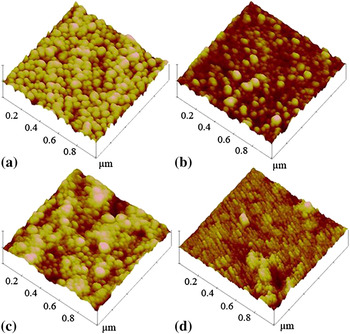
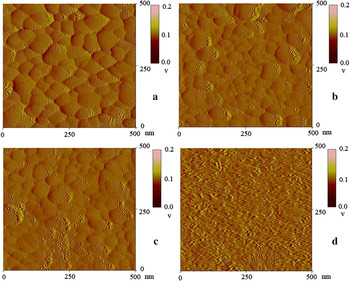
Figures 2(a)–2(d) show two-dimensional (2D) AFM surface height morphologies of ZnO–xSiO2 (x = 0, 5, 10, and 20 mol%) thin films. The scanning area is 500 × 500 nm2. As shown in Fig. 2, each film was composed of many fine ZnO particles. Obviously, with the increasing SiO2 dopant content from 5.0, 10.0 to 20 mol%, the average grain size of ZnO was decreased from 50, 40, 30 nm to 10 nm, which is conformed with the XRD results. Three-dimensional surface morphologies are shown in Figs. 3(a)–3(d). The scanning area is 1 × 1 μm2. All the samples have uniform and compact sphere-shaped ZnO grains, which grow preferentially along the c-axis orientation perpendicular to the glass substrate surface. This is in agreement with the result of XRD. At the right side of each image, an intensity strip is shown, indicating the depth and height along the z-axis. The root mean square (RMS) roughness of the pure ZnO, ZnO–5.0SiO2, ZnO–10.0SiO2, and ZnO–20SiO2 thin films as calculated using the equipment’s software was 4.2, 3.4, 2.8, and 2.1 nm, respectively. Obviously, the RMS values decreased with the increasing SiO2 dopant content. These results indicate that the suitable dopant of SiO2 into ZnO film could help to improve the surface quality. This is because, with the increasing SiO2 dopant content, the grain size decreases and surface morphology becomes smoother. Figures 4(a)–4(d) show 2D AFM amplitude morphologies of ZnO–xSiO2 thin films. The scanning area is 500 × 500 nm2. In Fig. 4, one can ascertain that features in amplitude images clearly show not only the grain boundaries but also the difference in surface compositions. This revealed that the relatively small proportion of SiO2 is highly dispersed in the ZnO network homogeneously through the Si–O–Zn bonding.Reference Bouguerra, Samah, Belkhir, Chergui, Gerbous, Nouet, Chateigner and Madelon43 However, in Fig. 4(d), excessive SiO2 could not disperse uniformly due to the phase separation caused by the aggregation of excessive SiO2.
Two-dimensional (2D) atomic force microscope (AFM) height images of ZnO thin films with different SiO2 content annealed at 500 °C for 1 h.

Three-dimensional AFM height images of ZnO thin films with different SiO2 content annealed at 500 °C for 1 h.

2D AFM amplitude images of ZnO thin films with different SiO2 content annealed at 500 °C for 1 h.

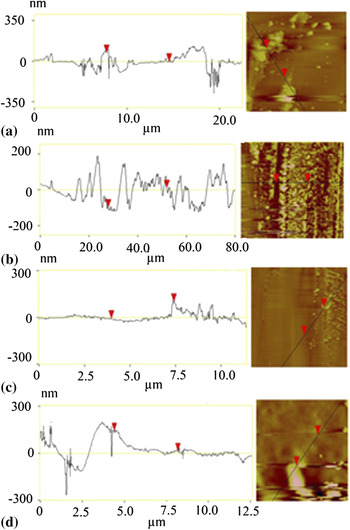
To get the thickness of the prepared ZnO thin films, some part of the ZnO thin films were scraped off by a knife to expose the glass substrate. 2D AFM section analysis of ZnO thin films was obtained by a large-scale scanning between the ZnO thin films and the substrates to observe the thickness as shown in Fig. 5. The thickness of ZnO–xSiO2 (x = 0, 5, 10, and 20 mol%) thin films were 113, 96, 134, and 142 nm, respectively.
2D AFM section analysis of ZnO thin films with different SiO2 content annealed at 500 °C for 1 h.

B. Optical properties of ZnO–xSiO2 thin films
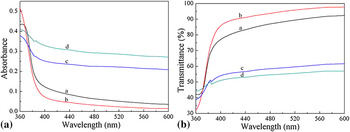
Figure 6(a) shows the UV–vis absorption spectra of the prepared samples doped with different SiO2 dopant content. The exciton absorption is at about 380–390 nm. The ZnO–5.0SiO2 thin film shows lower absorption at lower wavelength. Compared with the pure ZnO thin film, the ZnO–5.0SiO2 thin film exhibits slight blue shift, which may be attributed to the decreasing ZnO grain size after a proper amount of SiO2 dopant. However, with the increase in the SiO2 dopant content from 10 to 20 mol%, the adsorption of ZnO–10.0SiO2 and ZnO–20.0SiO2 thin film increase as well compared with pure ZnO thin film. The optical absorption edge exhibits obvious red shift, which may be caused by the serious phase separation between ZnO and SiO2 grains with the increasing SiO2 dopant content. Figure 6(b) shows the optical transmittance of the ZnO–xSiO2 thin film annealed at 500 °C. It is evident that the optical transmittance of ZnO–5.0SiO2 thin film increased by ~8% compared with that of the pure ZnO thin film, which could be explained by two reasons. On the one hand, a proper amount of SiO2 dopant could improve the optical transmittance of ZnO thin films due to the synergetic effect between ZnO and SiO2 dopant.Reference Bouguerra, Samah, Belkhir, Chergui, Gerbous, Nouet, Chateigner and Madelon43 However, excessive SiO2 dopant led to the phase separation, which decreased the transmittance of ZnO thin films. On the other hand, thickness is also a significant factor to affect the transmittance of ZnO thin films. According to the formula, T = B exp(−αd),Reference Fujihara, Ogawa and Kasai44 where “α” is the absorption coefficient, “d” is the film thickness, and “B” is approximately constant. The thickness of sample “a,” “b,” “c,” and “d” were 113, 96, 134, and 142 nm, respectively. The decrease in film thickness after doping proper SiO2 leads to the increase in transmittance. However, excessive SiO2 dopants increases the thickness of ZnO thin films, and as a result, the transmittance of ZnO thin films decrease.
(a) Absorbance and (b) transmittance spectra of ZnO thin films with different SiO2 content annealed at 500 °C for 1 h.

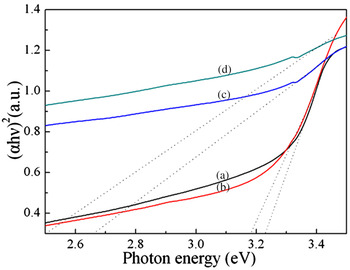
The optical band gap energy (E g) of the ZnO thin films was determined by the extrapolation of the linear portion of α 2 versus hν plots using the equation (αhν)2 = A(hν – E g)n, where α is absorption coefficient, hν is the photon energy, E g is the optical band gap energy, and A is a constant. For direct band gap semiconductor, n = 1/2 or 3/2. A value of n = 1/2 is found to be most suitable for ZnO thin films.Reference Lin, Huang and Sajgalik45 It is well known that direct transitions across the band gap are feasible between the valence and the conduction band edges in k-space. In this transition process, the total energy and momentum of the electron–photon system must be conserved. The functional dependence of (αhν)1/2 versus photon energy is shown in Fig. 7. Obviously, the optical absorption edge exhibits obvious blue shift with increase in SiO2 dopant content. The optical absorption edge should be increased owing to the decreased grain size of ZnO. The optical band gap of ZnO nanostructured thin film is higher than that of amorphous zinc oxide thin film.Reference Bouhssira, Abed and Tomasella46 The optical band gap dependence of grain size is expressed asReference Caglar, Ilican, Caglar and Yakuphanoglu47E g (nanocrystal) = E g (bulk) + π 2h 2 (1/m e* + 1/m h*)/2R 2, where m e* and m h* are the effective masses of the electrons and holes, respectively, R is the radius of the particle, E g (nanocrystal) is the band gap of nanocrystal ZnO, and E g (bulk) is the optical band gap of bulk ZnO. The optical band gap of bulk ZnO is 3.2 eV. The effective masses of electrons and holes of ZnO are 0.24m o and 0.45m o, respectively. The E g (nanocrystal) for ZnO was found to be 3.212 eV, and the calculated enhancement in band gap for 28-nm particle size was found to be about 12.1 meV. The obtained band gap for the ZnO thin film is lower than the optical band gap of ZnO thin film with 12-nm grain size (3.281 eV).Reference Berber, Bulto, Klib and Hahn48 However, the band gap energies decreased with increasing SiO2 dopant content, which can be attributed to the improvement in the crystals, in morphological changes of the films, and in changes of atomic distances and grain size,Reference Shinde, Lokhande, Mane and Han49 which were confirmed with the XRD and AFM results. Moreover, with the increasing SiO2 dopant content, the sp–d exchange interaction between the localized sp-electrons of SiO2 dopant and d-electrons of ZnO was enhanced.Reference Kim and Park50 As a result, the band gap energies of ZnO thin films were decreased.
Optical band gaps of ZnO thin films with different SiO2 content annealed at 500 °C for 1 h.

IV. CONCLUSIONS
In summary, nanocrystalline ZnO–xSiO2 (x = 0, 5, 10, and 20 mol%) thin films on glass substrates have been prepared by a simple sol–gel spin coating method. The results show that all the prepared ZnO–xSiO2 thin films have a sharp absorption edge in the UV region with compact hexagonal wurtzite structure. The lattice d values, constants, and unit cell volumes of ZnO crystal are slightly changed after doping with silica. With the increasing SiO2 dopant content, the intensity of (002) peak, c-axis orientation, particle size, surface RMS roughness, and E g of the ZnO–xSiO2 thin films were decreased. A proper amount of SiO2 dopant (5.0 mol%) could enhance the transmittance of ZnO thin film and lead to a slight blue shift in the visible region (360–600 nm) at the absorption edge. However, excessive SiO2 dopant (10.0 and 20.0 mol%) decreases the transmittance and exhibited obvious red shift.
ACKNOWLEDGMENTS
This work was partially financially supported by the Natural Science Foundation of China (Grant No. 20873118), Program for New Century Excellent Talents in University (Grant NCET-08-0665), the Program for Science & Technology Innovation Talents in Universities of Henan Province (2008 HASTIT016), Henan Province Science and Technology Key Project (Grant No. 082102230036), Natural Science Foundation of Henan Province, China (Grant No. 102300410165), and Innovation Scientists and Technicians Troop Construction Projects of Henan Province (Grant No. 10410051001).