Implications
In most countries, somatic cell counts (SCC) are routinely used as indicators of mammary infection in genetic evaluation. However, SCC are not very sensitive in classifying cows as infected or healthy, which leads to unnecessary costs and missed profits. Here, a simple hidden Markov model is proposed, which improves the diagnostic accuracy of SCC by uncovering the hidden health status of the cows before the appearance of clinical signs and before SCC exceed the threshold of 250 000 cells/ml. This will critically improve the power of genetic studies of mastitis determinants and reduce biases in predicting breeding values.
Introduction
In many countries, high somatic cell counts (SCC) in milk are used as an indicator of subclinical and clinical mastitis (CM), especially for genetic evaluation to improve resistance to mammary infections that necessitate large amount of data (Shook and Schutz, Reference Shook and Schutz1994). However, the problem of identifying infected cows based on their SCC is still not satisfactorily solved as individual SCC are not very sensitive in diagnosing mammary infection, either at the quarter or cow level (Sargeant et al., Reference Sargeant, Leslie, Shirley, Pulkrabek and Lim2001; Djabri et al., Reference Djabri, Bareille, Beaudeau and Seegers2002). This has a relevant impact on animal selection because imperfect accuracy in the diagnosis of infectious diseases results in a reduction of heritability estimates (Bishop and Woolliams, Reference Bishop and Woolliams2010). It is also a source of misclassification as uninfected animals may have high SCC (and vice versa). This may bias the prediction of breeding values and decrease the power to detect an association between a disease locus and a marker locus (Buyske et al., Reference Buyske, Yang, Matise and Gordon2009). Selection for very low SCC might even not be the best objective because low initial SCC have been associated with increased susceptibility and severity of subsequent mastitis (Suriyasathaporn et al., Reference Suriyasathaporn, Schukken, Nielen and Brand2000).
Mathematical models improve the accuracy of SCC measures used to identify infected cows by making better use of the information contained in SCC data. For example, models developed by de Haas et al. (Reference de Haas, Veerkamp, Barkema, Gröhn and Schukken2004) led to the identification of different SCC patterns according to the mammary pathogen: Clinical Escherichia coli mastitis is significantly associated with the presence of a short peak in SCC, whereas Staphylococcus aureus is associated with long increased SCC. Others have used the finite mixture model (FMM) methodology on SCC to infer the cow’s individual probability of being infected (Detilleux and Leroy, Reference Detilleux and Leroy2000; Gianola, Reference Gianola2005). A simple FMM will assign SCC to one of the two components hopefully representing SCC from cows with intra-mammary infection (IMI+) and without (IMI−), respectively. Then, the identification of animals at risk is computed as the posterior probability of putative IMI, given the SCC, rather than on crude SCC. However, after bacteriological examination of goat milk samples, Boettcher et al. (Reference Boettcher, Moroni, Pisoni and Gianola2005) observed that their FMM was able to classify correctly only 60% and 48%, respectively, of the healthy and infected records. If these results are not encouraging, it should be noted that the accuracy for detecting an IMI from bacteriological cultures of single composite or quarter milk samples in subclinically infected cows is known to be low (Sears et al., Reference Sears, Smith, English, Herer and Gonzales1990; Lam et al., Reference Lam, van Wuijckhuise, Franken, Morselt, Hartman and Schukken1996). This is because pathogens such as S. aureus are often shed in an intermittent or cyclical pattern and in numbers too low to be detected by conventional culturing methods (Godden et al., Reference Godden, Jansen, Leslie, Smart and Kelton2002). The S. aureus and coagulase negative staphylococci were the most prevalent pathogens in the above-mentioned goat study (Moroni et al., Reference Moroni, Pisoni, Vimercati, Rinaldi, Castiglioni, Cremonesi and Boettcher2005).
Hidden Markov models (HMM) could be an alternative to FMM. An HMM is defined as a finite set of states, each of which is associated with a probability distribution. Transitions among the states are governed by a set of probabilities called transition probabilities. The joint distribution over all states is a Markov chain. An observation is associated with each state, according to a linked probability distribution, called the emission probability. Only observations are recordable, not the states that are “hidden”, and hence the name (Rabiner, Reference Rabiner1989). In the mastitis context, the health status of the mammary gland could be considered as two hidden states and the SCC as the associated observations.
In a simulated data set (J. C. Detilleux, unpublished results), the accuracy of estimates obtained with an FMM was increased by incorporating information from previous SCC, as is done in HMM. In another study (Detilleux, Reference Detilleux2008), estimates obtained with a mixed HMM were close to the true values unless the prevalence of the disease was low.
The objective of this study is to present the mathematical formalism behind the HMM methodology, to apply the model on SCC collected on first parity cows with known clinical status and to compare results on clinical (observed by farmers), subclinical (defined for SCC or above 250 000 cells/ml) and hidden (infected or not as obtained from the HMM) states.
Material and methods
Animals and data collection
Data from the field study of Barkema et al. (Reference Barkema, Schukken, Lam, Beiboer, Wilmink, Benedictus and Brand1998) were used. Briefly, bacteriological samples were collected by farmers from cows with signs of CM. For the present analyses, only the first cases of CM in first parity cows (CMt) were considered and bacteriological results were consolidated into negative (Bt = 0) and positive results (Bt = 1), with t representing the month in milk (MIM) at which the case was recorded. Records on clinical cases were retrieved between December 1992 and August 1995. Conjointly, a total of 526 867 test days with SCC were recorded by the National Milk Recording System (NRS, Arnhem, The Netherlands). The somatic cell scores (SCS) were computed as log2(SCC / 100 000) + 3 and averaged per MIM. After editing (SCC < 9 999 000, MIM ⩽ 10, calving date⩽test-day date), the data set included 128 748 records on SCC for the first 10 MIM on 21 829 first parity cows. A total of 951 mastitis cases were reported, of which 774 were bacteriologically positive. Thereafter, clinical cases without positive bacteriological findings were considered as healthy.
For each MIM, three (two observed and one hidden) different health states were considered. The records were classified as being from a heifer with (CM+) or without (CM−) a reported clinical case. The SCC may be below (SCM−) or above (SCM+) the threshold of 250 000 cells/ml. This threshold was chosen as an indicator of subclinical mastitis and is the one chosen by de Haas et al. (Reference de Haas, Barkema and Veerkamp2002) in her previous analysis of the data. The last stage is the hidden infected (IMI+) or uninfected (IMI−) stages that were obtained by the HMM.
Statistical analyses
Throughout, k indexes the individual cow, t is the MIM, yk t is the SCS observed at t on animal k, and zk t is the unknown state with zk t = 0 if yk t is from a hidden IMI− sample and zk t = 1 if yk t is from a hidden IMI+ sample. On each cow, data consist of a series of repeated SCS: yk = {yk 1, yk 2, …, yk T} and the unobserved vector is zk = {zk 1, zk 2, …, zk T}, for t = 1, 2, …, T. For simplicity, T is assumed to be constant for all cows.
General formulation of the model
A simple first-order HMM was assumed with two transient states corresponding to the hidden IMI− and IMI+ categories with the following parameters:
– probabilities of transition between hidden states:

– probability of being IMI − as an initial hidden state λk =
and– probabilities of SCS emission:
.

 and

The probabilities of transition represent the probabilities of observing a particular hidden (unknown) IMI state at time t + 1, given the hidden IMI state at time t. The probabilities of emission represent the probabilities of observing SCS (at time t), given the hidden IMI state (at time t). It is assumed that correlation between successive SCS is fully accounted for by the underlying Markov process structure so that each SCS is independent, given the unknown IMI state (output independence assumption). It is also assumed that state transition probabilities are independent of the actual time at which the transition takes place and do not change across time (stationary assumption). Finally, it is assumed that values in any hidden state are only influenced by the values of the state that directly preceded it (first-order Markov assumption). The suitability of these assumptions for analyzing repeated SCS is discussed afterward.
To obtain the maximum likelihood estimates (MLE) of the parameter set  , where
 , the likelihood of the data must be maximized over all possible values of
 and this can be done through the expectation maximization (EM) algorithm.
Likelihood of the data
For one cow, the likelihood of one particular sequence of repeated SCS is given by:

with

and

for i = 0 and 1. The  represents the probability of a partial sequence and ending up in state i at time t and
 represents the probability of a partial sequence starting from t + 1 to T, given that the sequence started at state i at time t. This likelihood must be computed, for each cow, over all possible sequences of hidden states (zk). To do so, the naive way would be to sum, for each cow, the probabilities over all possible state sequences but their number can be huge (=2T) and the more efficient forward–backward algorithm is used in practice. This algorithm takes advantages of the sequential nature of the data, going forward (t = 1, 2, …, T) and backward (t = T, T−1, …, 1) in time, knowing it must end in some particular state. For a practical description, see Eisner (Reference Eisner2002) and his interactive spreadsheet for teaching the algorithm. After the likelihood is computed for one cow, the likelihood for all sequences of all cows is computed as the product of all individual likelihoods (assumption of independence between cows).
The EM algorithm
For a detailed derivation of the algorithm for HMM, please refer to Bilmes (Reference Bilmes1998) and Rabiner (Reference Rabiner1989). In short, the EM algorithm consists of a series of repeated E and M steps. In the E step, one finds the expected value of the complete-data log-likelihood with respect to the unknown parameters, given the observed data (yk) and the current parameter estimates ( at iteration p). To form the complete data, one assumes that both the observed (yk) and hidden (zk) vectors are known. Then, the expected complete-data log-likelihood is written as:
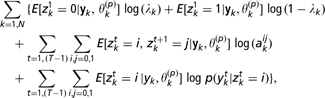
where the first two terms of the summation involve observations at the start of the sequence (t = 1), the third term counts how many times each i to j transition occurred in the sequence and the fourth includes all observations generated from state i.
In the M step, one maximizes each term by setting the derivative equal to zero and by using the constraint  to obtain the following MLE (i = 0, 1 and j = 0,1):
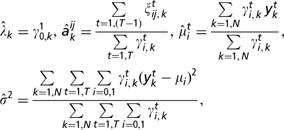

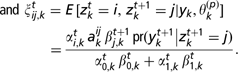
Note that  is the individual posterior probability of an IMI sample, given the whole SCS sequence. Correspondingly,
 is the posterior probability, for the k th cow, that a hidden state sequence that had to generate the SCS sequence went through IMI− at time t and transitioned into IMI+ at time t + 1.
Evaluation of the MLE
The HMM described in the preceding sections were used to analyze the SCS records. Missing SCS were restored through a multiple imputation procedure with the MCMC method (proc MI of SAS®) in an attempt to avoid loss of statistical power and selection bias associated with loss to follow-up, and to be able to use standard matrix algebra. In this method (refer to Horton and Kleinman, Reference Horton and Kleinman2007 for a thorough discussion), each missing value is replaced by a set of plausible values that represent the uncertainty about the right value to impute. After imputation, the set of imputed values was averaged for subsequent analyses. Note that the SCC were transformed in SCS to ensure normality, which is an assumption of the MCMC method for imputing missing data.
Different priors for μ 0 (2 to 5), μ 1 (4 to 8) and σ 2 (1 or 2) were used to start the EM algorithms. After the MLE of the parameters were computed, the estimated number of transitions between successive MIM was obtained as

with i = j = 0 if the transition is from IMI− to IMI−, i = 0 and j = 1 if the transition is from IMI− to IMI+, i = 1 and j = 0 if the transition is from IMI+ to IMI− and i = 1 and j = 1 if the transition is from IMI+ to IMI+. These numbers were compared with the observed numbers of transitions between successive MIM with SCM− or SCM+, and to the observed numbers of transitions between MIM with or without a clinical case (CM+ and CM−). The comparisons were made for lactations with or without a reported clinical case associated with a positive bacteriological result. In lactations without a reported clinical case, only transitions from CM− to CM− were achievable. The numbers of transitions from CM+ to CM+ were not computed because only the first clinical cases were considered.
Results
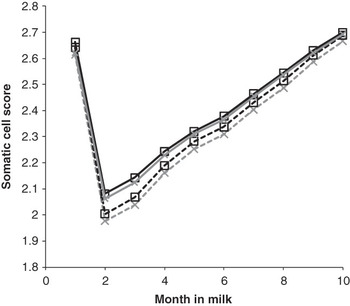
Before imputation, 6.01% of the 128 748 monthly records were bacteriologically positive. The average SCS over all lactations (first parity cows with or without case) was at 2.65 (s.d. = 1.62) in the first MIM, decreased to a minimum at 2.08 (s.d. = 1.45) during the second MIM before increasing slowly to 2.70 (s.d. = 1.37) at the end of the lactation. A similar pattern was found for lactations without any case of mastitis (Figure 1), but here, SCS were slightly lower throughout the lactation. In lactations with mastitis, cases were detected, on average, on the 128th days in milk (DIM) and 27.6% of those occurred during the first MIM. The percentage decreased thereafter, from 12.6% in the second MIM to 5.5% in the last three MIM. The complete sequence (n = 10) of SCS records was available for 10.48% of the cows and 75.56% of the lactations had information on five MIM or more. The missing pattern was not a monotone, that is, a missing SCS was not necessarily followed by missing SCS. After imputation, the complete data set included 218 290 monthly SCS records of which 3.23% were considered as CM+. The SCS trend was similar before and after imputation and the highest difference (about 0.08) was found when SCS were the smallest, in the second MIM. After imputation, the SCS averaged 2.64 (s.d. = 1.37) in the first MIM, decreased to a minimum at 2.00 (s.d. = 1.27) during the second MIM and increased to reach 2.69 (s.d. = 1.23) at the end of the lactation (Figure 1).
Monthly average somatic cell scores for all lactations (square) and for lactations without clinical mastitis (cross), before (straight line) and after (broken lines) imputation.

The estimated means and variance obtained with the HMM were  (s.d. = 0.16),
 (s.d. = 0.71) and
 (s.d. = 0.11). As comparison, the observed SCS means for CM− and CM+ lactations were 2.35 (s.d. = 0.99) and 3.18 (s.d. = 1.28), respectively. For SCM− and SCM+ lactations, the observed means were 1.97 (s.d. = 0.64) and 3.48 (s.d. = 1.01), respectively.
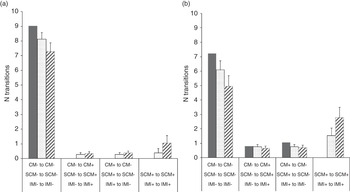
The average number of transitions between the hidden (IMI− and IMI+) and observed states (SCM+ and SCM−, CM+ and CM−) is shown in Figure 2 for lactations with or without at least one reported clinical case. The null hypothesis of no differences between these numbers was tested by a Student’s t-test (P < 0.01). The numbers of transitions from IMI− to IMI− and from SCM− to SCM− were lower than the observed number of transitions from CM− to CM−. For example, when no cases were reported during the entire lactation (Figure 2a), there were nine transitions from CM− to CM−, but the number of transitions from SCM− to SCM− was 8.14 (s.d. = 2.0) and the number of transitions from IMI− to IMI− was 7.27 (s.d. = 2.7).
Mean number of transitions from one state of mastitis to another across the 10 test days for cows without (a) and with (b) at least one reported clinical case of mastitis. States are designed as CM+ or CM− (plain bar) when a clinical case is reported or not, as SCM+ or SCM− (spotted bar) when SCC are above or below 250 000 cells/ml, and IMI+ or IMI− (stripped bar) when the sample is classified as infected or not by the model.

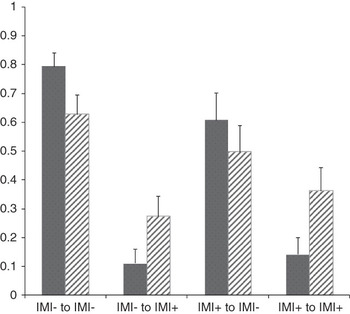
The average probabilities of transition between hidden states are given in Figure 3 for lactations with or without a reported case of CM. Overall, the probability of remaining uninfected was â 00 = 78.84%, of recovering from infection was â 10 = 60.49%, of getting newly infected was â 01 = 11.70% and of remaining infected was â 11 = 15%. No significant differences were found in these probabilities between lactations with or without at least one reported clinical case.
Average probabilities of transition between IMI states for lactations with (stripped bar) and without (plain bar) a reported clinical case. The hidden states are IMI+ and IMI−, respectively, when the sample is classified as infected or not by the model.

Discussion
A naïve HMM is proposed to analyze sequences of monthly SCS as they are collected by the milk recording agencies with the intention of identifying cows with or without mastitis. The data were previously analyzed by de Haas et al. (Reference de Haas, Veerkamp, Barkema, Gröhn and Schukken2004) to identify pathogen-specific SCC patterns. The SCS patterns in Figure 1 are similar to those from the previous study (Figure 1 in de Haas et al., 2002), with slight differences mainly due to different editing procedures and considering that SCS were averaged over each MIM.
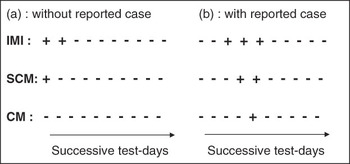
Besides providing useful information for herd management purposes, the model provides useful features for genetic and genomic selections. First, the results from Figure 2 suggest that analyzing SCS with an HMM leads to the identification of infected cows before the appearance of clinical signs and before SCC gets higher than 250 000 cells/ml. Indeed, among cows for which at least one case of mastitis was reported (Figure 2b), the model was assigned the state IMI+ on three occasions while the stage SCM+ was observed on two occasions. In heifers without any reported case of CM (Figure 2a), there were two IMI+ and one SCM+. The likely sequences for the IMI, SCM and CM stages are shown in Figure 4, considering that most clinical stages were reported in early lactation.
Examples of sequences for the IMI, SCM and CM stages across the 10 test days based on the results shown in Figure 2, for cows without (a) and with (b) at least one reported clinical case of mastitis. The sign is + when the sample is positive for the stage at the test day. The sign is − when the sample is negative for the stage at the test day.

Although these results should be confirmed in a well-designed clinical trial with experimental infection, this ability will provide more accurate estimates of breeding values, which should theoretically lead to an earlier and more accurate selection. It will also facilitate the identification of the genetic determinants of mastitis because hidden IMI states may be considered as intermediate phenotypes with stronger genetic determinants than SCM or CM. Second, HMM may be used to predict the future health status of a cow, based on its previous sequence of SCS. Mathematically, this prediction is given by combining the forward (α) and backward (β) probabilities used in the algorithm as:

In these probabilities, the uncertainty about the time of exposure to infection, if it has occurred, is reduced because data on the entire available sequence of SCS are exploited. Therefore, it may lower the biases due to incomplete exposure on estimable heritabilities (Bishop and Woolliams, Reference Bishop and Woolliams2010). Third, the model provides estimates of the probability of recovery (IMI+ to IMI− = a 10) and of new infection (IMI− to IMI+ = a 01) for each animal. These parameters are directly related to the well-established selection objectives for better udder health and epidemiological concepts. For example, the force of infection (ω = the rate at which susceptible individuals become infected) and the recovery rate (δ = the rate at which infected individuals recover) may be obtained from a 10 and a 01 as

assuming an SI model (Anderson and May, Reference Anderson and May1992; Detilleux et al., Reference Detilleux, Vangroenweghe and Burvenich2006). Then, data from genetic and epidemiological studies could be combined to analyze the impact of selecting for a better ability to recover from disease on the spread of the disease at the population level. Finally, the model can be extended by adding genetic random effects to obtain breeding values for SCS (Detilleux, Reference Detilleux2008) or even for the hidden IMI variable (Altman, Reference Altman2007), considering that the total genetic effects on SCS would be a combination of the effects of genes responsible for the presence or not of infection and for the magnitude of the SCS response after infection.
The model is very flexible and allows the inclusion of prior knowledge (e.g. clinical or laboratory records) of the SCS information. The effects of covariates (e.g. treatment or culling, breed and parity) on the progression of the IMI could also be studied by comparing the transition rates.
The HMM methodology also presents some limitations. The HMM, as proposed here, necessitated that the sequence of SCS was complete. One possibility was to discard lactation with incomplete information, but this would have decreased the amount of available data and caused potential selection bias. Missing data were, instead, imputed and a multiple imputation procedure was chosen as it increases robustness to departures from the true imputation model considerably, compared with single imputation approaches that do not reflect uncertainty about the imputed values. The MCMC method was chosen because SCS were distributed normally and the missing pattern was not a monotone. After imputation, the SCS curves were slightly lower than before imputation (Figure 1). This may be explained by the fact that, in the MCMC method, missing SCS were replaced by randomly selecting a value (at any MIM) and that SCS at different MIM are correlated with the SCS being imputed. Another drawback was the assumption that the probability of staying in a given state was independent of the duration of the state. It could have been modeled explicitly as a 11d−1 (1−a 11), which is the probability of staying d times in state IMI+. The transition probabilities were assumed to be constant across time, although it is known that susceptibility to IMI varies across lactation stages (Paape et al., Reference Paape, Mehrzad, Zhao, Detilleux and Burvenich2002). This stationary assumption is very strong but it could be relaxed by parameterizing the mean of the IMI+ distribution to account for various trends or seasonality in the data (Le Strat and Carrat, Reference Le Strat and Carrat1999). Another assumption of the HMM, the independence between successive SCS, could be released in its autoregressive form by allowing previous SCS to assist in predicting the current SCS (Laverty et al., Reference Laverty, Miket and Kelly2002; Ephraim and Roberts, Reference Ephraim and Roberts2005). Finally, the assumption of homoskedasticity can be relaxed by modeling different variances for the IMI+ and IMI− samples (Detilleux, Reference Detilleux2008).
The maximum likelihood estimation via the EM algorithm also has some disadvantages. For example, it does not provide an estimated covariance matrix for the parameters. Bootstrap methods can be used but they are computationally intensive for this type of model. Other alternatives are to estimate parameters via the Gibbs sampler or Bayesian variational methods (Jaakkola and Jordan, Reference Jaakkola and Jordan2000). Collinearity between parameter estimates can lead to identifiability problems (Brookhart et al., Reference Brookhart, Hubbard, van der Laan, Colford and Eisenberg2002) and the EM may converge toward singular estimates at the boundary of the parameter space. It may also fail to converge. The problem becomes particularly severe when time series are short and data sparse (Cooper and Lipstich, Reference Cooper and Lipstich2004).
Conclusions
A simple HMM was applied on SCS recorded monthly on cows with or without CM to evaluate its accuracy in estimating parameters under healthy or diseased states. The SCS means were estimated at 1.96 (s.d. = 0.16) and 4.73 (s.d. = 0.71) for the hidden healthy and infected states, and the common variance at 0.83 (s.d. = 0.11). The probability of remaining uninfected, of recovering from infection, of getting newly infected and of remaining infected between consecutive test days was estimated at 78.84%, 60.49%, 11.70% and 15%, respectively. Three different health-related states were compared: clinical stages observed by farmers, subclinical cases defined for SCC below or above 250 000 cells/ml, and infected stages obtained from the HMM. The results showed that HMM identifies infected cows before the appearance of clinical and subclinical signs, which may critically improve the power of studies on the genetic determinants of SCS and reduce the biases in predicting breeding values for SCS. The HMM also provides epidemiological parameters that describe the spread of mastitis at the population level.
Acknowledgments
My special thanks go to CRV BV and Prof. H. Barkema for providing the data and to EADGENE (European Animal Disease Genomics Network of Excellence for Animal Health and Food Safety) for financial support.