

1. INTRODUCTION
Research on the ‘anglicisation’ of European languages has focused predominantly on direct lexical borrowing, meaning open-class word forms and expressions that are based on formal imitation of the English model. Less attention has been given to the indirect or ‘subterranean’ impact of English, such as calques (or loan translations), in which compounds or multiword units are transferred to native forms in the borrowing language system. This is also characteristic of contact research in Norway, which has been concerned largely with direct loanwords, together with potential domain loss situations (Graedler & Johansson, Reference Graedler and Johansson1997; Graedler, Reference Graedler1998, Reference Graedler2004; Sunde, Reference Sunde2016; Ljosland, Reference Ljosland2008; The Norwegian Language Council, 2005). This perspective is not surprising considering the massive import of English words and expressions into Norwegian, particularly after 1950. Nevertheless, observations indicate that English is increasingly burrowing its way below the lexical surface of the language, as illustrated by the following authentic examples:Footnote 1
(1)


In (1a), the English phrasal verb stand out is translated into stå ut, and used instead of native Norwegian formulations like skille seg ut ‘separate oneself out’. In (1b), insistere ‘insist’ takes a complement clause where one would normally expect the collocation insistere på ‘insist on’ in Norwegian, but not in English. Lastly, (1c) is a case in which a collocation and a complement clause are replaced by a wh-clause. While this construction is possible in English, a more traditional Norwegian version would be Dette er årsaken til + compl ‘This is reason-def to + compl’. Hence, (1c) also resembles an English pattern (the constructions are further discussed in Section 2.3).
1.1 Calques
In the present study, the constructions in (1) are analysed as calques, that is, item-by-item translations of English polymorphemic units (e.g. compounds, collocations, phrasal verbs or idioms) (cf. Pulcini et al., Reference Pulcini, Furiassi and González2012b; Haspelmath, Reference Haspelmath, Haspelmath and Tadmor2009). Calques are an important type of indirect borrowing – a process whereby borrowed words or phrases are entirely reproduced through native forms in the borrowing language system (Pulcini et al., Reference Pulcini, Furiassi and González2012b, 6).Footnote 3 Compared with multiple direct borrowings from English, calques, or indirect borrowings in general, appear to be less frequent and more camouflaged; because the copied constructions are applied onto native words, they tend to go unnoticed. However, this type of borrowing seems to be on the rise in Norwegian and other European languages. Pulcini et al. (Reference Pulcini, Furiassi and González2012b, 13) describe multiword calquing as “a new dimension of the influence of English on European languages”, and recently calquing has received increasing scholarly attention (cf., e.g., Gottlieb, Reference Gottlieb2012; Fiedler, Reference Fiedler2012, Reference Fiedler2017; Pulcini et al., Reference Pulcini, Furiassi and González2012b). In a study of Danish, a language closely related to Norwegian, Gottlieb (Reference Gottlieb2012, 177) claims that successful English calques, which appear in a local guise and thus lack the ‘smart connotations’ assumed to favour borrowing, indicate that influence of English runs deep. In a similar vein, MacKenzie (Reference MacKenzie2012, 27) hypothesises that the growing English proficiency of Europeans will affect borrowing patterns, with intensified borrowing of complex lexical traits among the anticipated changes.
1.2 Aims
This study is based on a similar prediction: that increased English proficiency among Norwegians is leading to increased calquing from English. Hence, we assume that borrowings as in (1) are signs of a more intensive contact with English in Norway. Norwegians have become increasingly familiar with English over the last few decades and as a rule have sufficient English skills for everyday use. Such skills are believed to be greater among the younger generation, who have been exposed to English daily, both inside and outside the classroom, throughout childhood and adolescence. As part of an investigation of recent English borrowings among young Norwegians, Sunde (Reference Sunde2016) examined production data from the highly anglicised gaming culture. The study revealed intensive direct borrowing yet found little evidence of new calques. Nevertheless, observations indicate that calquing is on the rise in Norwegian. Therefore, the present inquiry focuses on perceptions, exploring how Norwegians evaluate recent English calques in their native language. This is examined through acceptability judgements among 83 high school pupils (mean age 18 years, referred to as pupils). One group of 16 relatively monolingual senior citizens (mean age 75, referred to as seniors) and another group of 10 bilinguals roughly one generation above the pupils (mean age 55, referred to as adults) were used as controls.
Previous studies have shown that acquiring an additional language (L2) can affect the perception of the first (L1). For instance, Laufer (Reference Laufer2003) found that L2 speakers of Hebrew were far less able to spot collocations modelled on Hebrew in their Russian L1, compared with monolingual Russians. Similarly, Balcom (Reference Balcom2003) found that native speakers of French with English as an L2 tended to judge well-formed French middle voice constructions as ungrammatical when they violated English constraints. Hence, by testing the acceptance of English calques in Norwegian, we may be able to reveal a hidden or passive English influence that is not necessarily detected by testing language production exclusively. In this study, the influence of English may be even stronger, because the chosen calques have been attested in Norwegian – meaning that the participants may also be be influenced by ‘anglicised Norwegian’. However, by choosing calques that are evaluated as nonestablished, which indicates that they have not yet penetrated general usage as have, for example, gå inn for ‘go in for’ and sitte på gjerdet ‘sit on the fence’, such an effect is minimised. (This is discussed further in Sections 2.3, 3.1 and 5.)
Our objective is to determine whether the accept rate increases with level of English proficiency. We predict that the chosen calques will be accepted at a higher rate among the most proficient participants and at a lower rate among the least proficient ones. We therefore expect to find differences between the young bilinguals and the senior monolinguals as well as internally among the young bilinguals. The bilingual adults were included in order to investigate the effect of English proficiency, together with age, on the judgements. The participants are discussed in more detail in Section 3.2.
1.3 Outline
The article is organised as follows. Section 2 presents the backdrop for the study, including an overview of relevant terms and definitions, and it introduces the 12 calques that the current study investigates. Section 3 presents the methods and the experiment design. The findings are presented in Section 4 and discussed in Section 5. Section 6 summarises and concludes the paper.
2. BACKDROP
2.1 English in Norway
In the postwar era, British and American culture have exerted a major influence across Europe. This has left its mark on the Norwegian lexis and the linguistic landscape in Norway more generally. English has become the prime source of loanwords (Sandøy, Reference Sandøy, Zenner and Kristiansen2013, 231) and plays a pivotal role in important social domains, especially academia and the business sector (Schwab, Reference Schwab2006; Ljosland, Reference Ljosland2007, Reference Ljosland2008; The Norwegian Language Council, 2005). English is introduced in first grade and continues as a compulsory subject throughout primary and lower secondary school. Also significant is the informal and substantial language practice outside the classroom – a tendency observed in Denmark as early as the 1990s (Preisler, Reference Preisler, Bex and Watts1999, 246). English is omnipresent in Norway’s written and audio-visual media and popular culture, and Norwegian youth often immerse themselves in leisure activities involving rich English input. In several studies from Sweden, researchers have found a correlation between English skills and the time devoted to English language leisure activities, especially computer gaming (Sundqvist, Reference Sundqvist2009; Sylven & Sundqvist, Reference Sylven and Sundqvist2012; Sundqvist & Wikström, Reference Sundqvist and Wikström2015). These findings are transferable to Norway, which resembles Sweden in terms of societal habits and where computer gaming is also dominated by games in English (see Sunde, Reference Sunde2016). Together with the school system’s English training, this may lead to a comprehensive knowledge of English and the English language system early in life.
In view of these influences, it is unsurprising that English is now regarded as a second language in Norway and Scandinavia (e.g.,Phillipson, Reference Phillipson1992, 25; McArthur, Reference McArthur and Hartmann1996, 10). However, English lacks an official status in Norway, and the reputation for English fluency among Norwegians tends to be exaggerated; studies have shown that Norwegians do not have the requisite English skills for certain educational and occupational roles (Hellekjær, Reference Hellekjær2009, 198f) (cf. Hellekjær, Reference Hellekjær2005, Reference Hellekjær2007). Hence, the status of English in Norway is best described as occupying the transitional space between a foreign and second language (Rindal & Piercy, Reference Rindal and Piercy2013, 212). Nevertheless, the level of English proficiency in Norway is improving (ibid.), and the language is widely present in both private and professional contexts. This may affect borrowing patterns in Norway (cf. e.g., MacKenzie, Reference MacKenzie2012).
2.2 Borrowing and the linguistic repertoire
Borrowing is the term most commonly used to discuss language contact phenomena (Curnow, Reference Curnow, Aikhenvald and Dixon2006, 413), but there is no clear consensus regarding how to define the concept. The definition also depends on whether one studies the outcome or the process of contact, that is, changes in a speech community as a whole or bilingual language processing in individuals. Although false or pseudo borrowings as defined, for example, by Pulcini et al. (Reference Pulcini, Furiassi and González2012b, 7) may occur without widespread bilingualism, this study focuses on loans arising from enhanced L2 proficiency.
The perspective applied in this paper follows Matras (Reference Matras2009, Reference Matras and Hickey2010, Reference Matras and Siemund2011) (see also Matras & Sakel, Reference Matras and Sakel2007), who investigates language contact from the perspective of the bilingual individual. Instead of viewing borrowing as the exchange of linguistic features between discrete language systems, Matras defines it as “the removal of an invisible demarcation line that separates subsets within the linguistic repertoire” of a bilingual individual (Reference Matras and Siemund2011:204). These subsets are commonly referred to as the speaker’s ‘languages’ and consist of word forms, constructions and rules associated with the same set of contexts. A central assertion is that these systems are not isolated (Matras, Reference Matras2009, 4, 214). Instead, they constitute a complex bank of linguistic elements that, through a process of linguistic socialisation, become associated with specific social activities and arenas, including topics and interlocutors. Thus, what we commonly refer to as ‘languages’ are the linguistic features that have become associated with the same set of contexts.Footnote 4
Further, Matras assumes that the bilingual speaker cannot completely block or deactivate subsets of the linguistic repertoire – a view shared by Amaral & Roeper (Reference Amaral and Roeper2014, 13ff.). Hence, bilingual speakers face a challenge in controlling their linguistic repertoire and selecting ‘context-appropriate’ material in communication (Matras, Reference Matras2009, 4–5). The rules governing the selection of appropriate material are believed to be part of the speaker’s communicative competence and to derive from a more or less conscious wish to make full use of the acquired repertoire as well as to comply with social norms and expectations (ibid.; Matras, Reference Matras and Hickey2010, 66). Some conversation settings naturally allow for greater flexibility of choices than others, and mixing between languages may therefore be expected or even required in many contexts. In situations where bilinguals share the same languages (and find themselves in what Grosjean (Reference Grosjean and Nicol2001, Reference Grosjean2008) refers to as ‘bilingual mode’), both or all of the languages may be activated and used intentionally in an integrated manner. Other situations require speakers to separate languages to a greater degree. Apart from cases in which language mixing is intended (e.g. when speakers diverge from the expected selection of word forms in order to convey a certain communicational effect), the bilingual Norwegian speaker faces the largely subconscious task of inhibiting the activation of words and constructions associated with English in settings that require Norwegian, and vice versa.
Explaining why borrowing happens is not a straightforward task. Borrowing is sensitive to various and complex relations. Regarding loanwords, however, there are two common explanations. The first posits that they result from linguistic ‘gaps’ in the borrowing language, and the second posits that they derive from the ‘prestige’ enjoyed by the socially more powerful source language (Myers-Scotton, Reference Myers-Scotton1993, 169,172; Haspelmath, Reference Haspelmath, Haspelmath and Tadmor2009, 46–48). Whether filling gaps or establishing associations with a specific culture or linguistic group, direct loanwords are often recognisably foreign. Calques of various kinds, on the other hand, are not always immediately evident, since the borrowed constructions appear in local guise. According to Matras (Reference Matras2009, 234), this concealment may extend to the processing of such constructions in speech production. Matras (Reference Matras2009, 151, 235) suggests that lexical word forms are more easily identified by the interaction contexts in which they are normally used compared to more abstract organisational patterns. Consequently, differentiating between subsets of lexical material may be easier than differentiating between subsets of constructions. In other words, constructions are more difficult to connect to the contexts to which they belong and harder to ‘choose correctly’ in communication. The Norwegian speaker may thus, unintentionally, choose a construction associated with, or acquired through, English, while nonetheless complying with the interlocutors’ expectations to choose Norwegian word forms. This may result in calquing.
Finally, not all linguistic innovations will lead to change, and calquing is often an ad hoc process in oral speech. According to Matras (Reference Matras2009, 33), the chances of a linguistic innovation’s success and propagation depend on whether the interlocutors understand and accept it. This suggests that the chances for the establishment of a new English calque in Norwegian increase when the interlocutors have acquired the English construction on which the specific calque is modelled.
2.3 Test constructions
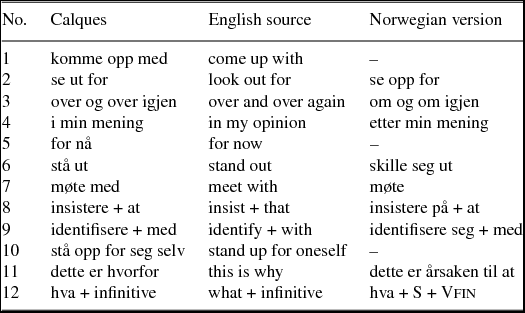
The calques chosen for the present study are shown in Table 1.
The 12 selected calques used in this study.
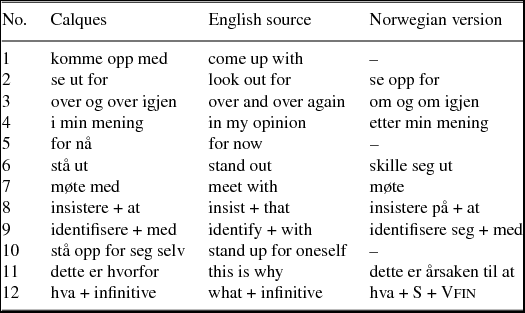
Norwegian has several well-established calques from English, at both the word and phrase level (e.g. frynsegode ‘fringe benefit’ and sitte på gjerdet ‘sit on the fence’) (Graedler & Johansson, Reference Graedler and Johansson1997, 10). However, several of the established calques – at least those at the word level – are the result of a conscious policy of replacing English loans with Norwegian substitutes (Graedler, Reference Graedler and Görlach2002, 62). The common denominator of the calques in Table 1 (except numbers 1 and 2 – see below) is that they are considered relatively recent loans that have emerged without conscious promotion. Numbers 3–12 are among a range of newly discovered English calques. None of the calques are registered in a Norwegian dictionary, and most appear to be relatively infrequently used (see Section 3.1). Nevertheless, they have been observed by the authors in oral and written language – from TV and radio shows to newspaper articles and online ads.Footnote 5,Footnote 6
The reason for choosing nonestablished borrowings is to investigate how proficiency in English affects speakers’ perception of Norwegian. The aim is not to examine how Norwegians react to well-established English borrowings. Still, to create a basis for comparison, an established calque was added to the study. This is calque number 1, komme opp med, which is noted in the Norwegian Bokmål dictionary.Footnote 7 In addition, an undocumented but potential English calque was included. This is calque number 2, se ut for from the English look out for. Although this collocation already exists in Norwegian (meaning ‘look like’ or ‘seem like’), the native Norwegian expression normally takes a complement clause, whereas the English expression takes a direct object (compare the difference between Det ser ut for at- complhan kommer ‘It looks out for that-compl he comes’ and Se ut for fare- do ‘look out for danger-do’).Footnote 8 The English version, as far as we are aware, never crops up in Norwegian, an assumption supported by the corpus study (Section 3.1). This calque was included to observe the participants’ reaction to a construction they were likely to understand but probably have never encountered, at least in this particular sense.
Numbers 3 and 4 are calques of fixed English expressions that have native Norwegian equivalents: om og om igjen ‘around and around again’ and etter min mening ‘after my opinion’, respectively. Calque number 5 lacks a clear Norwegian equivalent and translates to either inntil videre ‘until further’ or for øyeblikket ‘for moment-def’. Number 6 is a case of a translated phrasal verb (as exemplified in (1a)), for which skille seg ut ‘separate oneself out’ is a Norwegian equivalent, whereas number 7 turns the transitive verb møte into a prepositional verb by adding med ‘with’.
Number 8 is a case of a reduced Norwegian collocation, as exemplified in (1b). Whereas the English ‘insist’ may take a complement clause alone, Norwegian traditionally requires the collocation insistere på ‘insist on’. In a similar vein, number 9 lacks a reflexive pronoun. Unlike most Germanic languages, English does not require overt reflexive marking (McWhorter, Reference McWhorter2007, 61–63). Although it is tested with only one verb, omission of reflexive pronouns seems to affect several Norwegian reflexive verbs (cf. Sunde, Reference Sunde2013). The expression in calque 10 is idiomatic and lacks a clear Norwegian equivalent.
Finally, calques 11 and 12 involve copying English wh-clause patterns. Number 11 illustrates the tendency of replacing the collocation årsaken til ‘reason-def to’ and a complement clause with a wh-clause, as exemplified in (1c). This pattern has been attested with other wh-words as well, but only hvorfor is included in this study. The calque is therefore referred to as dette er hvorfor. Number 12 illustrates the use of infinitives (and infinitive markers) within wh-clauses. Although Norwegian wh-clauses traditionally contain a subject and a finite verb, recent observations have shown that these are increasingly being replaced by an infinitive, as in English. For example, Noen som vet hva å gjøre? ‘Someone who-rel knows what to do?’ instead of Noen som vet hva man kan gjøre? ‘Someone who-rel knows what one can do?’Footnote 9 Even this pattern is found with other wh-clauses, but it is referred to in this study as hva + infinitive.
The present study regards collocations, phrasal verbs, idiomatic expressions and wh-clause patterns as cases of calquing. While difficult to prove, it is reasonble to assume that the Norwegian innovations are modelled on English, because the calques in question have clear English equivalents, but they have only recently begun to catch on in Norwegian.
3. METHODS
3.1 Corpus studies
In order to investigate whether the calques in Table 1 have penetrated general usage, the calques were looked up in two corpora: The Corpus for Bokmål Lexicography (Knudsen & Fjeld, Reference Knudsen and Fjeld2013) (LBK) and Norwegian Web as Corpus (Guevara, Reference Guevara2010) (NoWaC). LBK is based on written Bokmål-texts from 1985 to 2013 and consists of approximately 100 million words.7 NoWaC was compiled by downloading and processing all Web documents on the .no-domain from late 2009 to early 2010, and consists of 700 million words. Furthermore, to balance data from written texts with data from oral speech, the constructions were also looked up in the Nordic Dialect Corpus (Johannessen et al., Reference Johannessen, Priestley, Hagen, Åfarli and Vangsnes2009). This corpus, which has 2.8 million words and is considerably smaller than LBK and NoWaC, had zero examples of the calques.
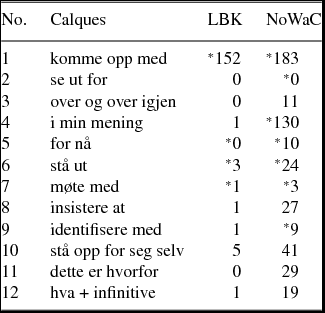
Table 2 shows the matches for each English calque in both corpora. The specific combinations of words that constitute several of the English calques may appear naturally in Norwegian. Therefore, there are many occurrences of, for instance, for nå and stå ut in the corpora, that do not constitute calques and are hence not relevant to the study. This is illustrated in (2).
(2)

In (2a), for is a conjunction, and nå a topicalised adverbial. In (2b), ut is the head of a prepositional phrase, not a verb particle. Hence, these matches are not calques.
To avoid examining every match of the specific strings of words, the maximum number of hits was limited to 200, and the selection was randomised. Hits marked with an asterisk signify that the corpus contains more than 200 matches for the specific strings of words as looked up. For instance, there are more than 200 hits for komme opp med in the corpora, but only 152 and 183 of the 200 concordance lines examined in the LBK and NoWaC, respectively, contain the English calque.
Relevant corpus matches of the calques in Table 1.
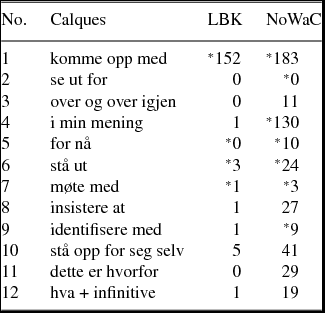
As Table 2 indicates, komme opp med seems to be established in Norwegian, as over three-quarters of the hits contain the English calque. Furthermore, there are no hits for se ut for in the sense of ‘look out for’. Both these findings are as expected. Regarding the rest, the two corpora show somewhat different results. The calques have either zero hits or a solitary hit in LBK, save for stå ut and stå opp for seg selv which have three and five hits, respectively. NoWaC generally has more hits for each calque. Notably, stå ut, insistere at, stå opp for seg selv, dette er hvorfor and hva + infinitive have between 19 and 41 hits. Last but not least, i min mening has 130 hits – a much higher number than the other calques. This is partly because the specific string of words that constitutes the calque does not normally occur in other meanings (as opposed to e.g. stå ut); hence, most of the hits will be calques. However, the same principle applies, for example, to insistere at and stå opp for seg selv – which have fewer hits – indicating that i min mening may be catching on in Norwegian.
NoWaC has more matches partly because this corpus is seven times larger than LBK. Additionally, LBK consists of text written in the 1980s and 1990s, when the influence of English may not have been as pervasive as today. Furthermore, NoWaC may reflect language use from a different, more informal source. Whereas LBK is based largely on published, and hence proofread, material, NoWaC was derived from a large number of unpublished texts, such as texts from discussion forums. NoWaC may therefore be said to represent contemporary language use more accurately. Whereas the LBK results support our assumption that these calques have not yet penetrated general language use, the NoWaC results indicate that some of the calques are, in fact, on the rise and potentially spreading within certain parts of the Norwegian speech community.Footnote 10
3.2 Judgement test design and participants
Acceptability judgements are an important source of linguistic data.Footnote 11 The method is intended to reveal (im)possible linguistic structures in a language by gathering native speakers’ intuitions of their well-formedness (Schütze & Sprouse, Reference Schütze, Sprouse, Podesva and Sharma2013, 28). Such data is useful when studying features or constructions that are infrequent in linguistic production (Schütze, Reference Schütze1996, 2). In our case, testing the acceptability of English calques in Norwegian may shed light on the distribution of emerging phenomena as well as reveal covert influences of English. Both are difficult to illuminate by investigating only production data.
The judgement data in this study was gathered from 83 pupils in four high school classes and from 26 adults and seniors in two distinct control groups, making the total number of participants 109 (the control groups are discussed in Section 3.2.1). The pupils’ median age was 18 years (mean age 17.8 ± 0.8), which means that they have received at least 10 years of formal English training at school. They are therefore evaluated as unbalanced yet functionally bilingual. In line with our hypothesis that increased calquing is caused by increased English proficiency, we expected that the calques would be accepted at a higher rate among the most English proficient pupils and at a lower rate among the least proficient ones. To investigate this, the pupils were divided into three groups based on an English proficiency test, taken after the judgement test. The judgement results were then compared between the groups and with the pupil average.
The judgement test consisted of 100 sentences in total, 12 of which were relevant to the present study.Footnote 12 The rest were a collection of filler sentences meant to camouflage the relevant test sentences. These were either normal or unnatural, and a few were neutral. Example sentences from the judgement test are given in Appendix A.
The sentences were recorded in the local dialect of the specific region and presented orally to the school classes. The participants were asked to evaluate the sentences on the basis of what they believed sounded like a natural sentence in their dialect. The sentences were rated on a scale from 1 to 4, where 4 represented an acceptable sentence and 1 represented an impossible, unacceptable sentence. Scores of 3 and 2 counted as milder versions of accepted and unaccepted, respectively. The scale had no neutral alternative, because it was assumed that the participants would have an immediate positive or negative intuition about a sentence. Finally, the participants were assured that the judgement test had no right or wrong answers and were asked to trust their instinctive response.
Although the purpose of testing acceptability judgements was to investigate how the participants evaluated anglicised Norwegian, it is fruitful to compare judgement data with data obtained by other methods. This is because there may be a discrepancy between intuitions and rating, on the one hand, and intuitions and actual language use, on the other. To investigate the relationship between intuition and actual language use, the English versions of the 12 calques given in the judgement test also appeared in an English-to-Norwegian translation test. The English constructions were included in full English sentences, and the test was camouflaged as part of the English proficiency test. Examples from the translation test are shown in Appendix B. Besides the translation test, the English proficiency test consisted of 45 exercises distributed across four sections: two grammar tests, one vocabulary test and one reading comprehension test.
3.2.1 Control groups
As mentioned, two control groups were included in the study: one group of 16 seniors (mean age 74.8 ± 5.8) and one group of 10 adults (mean age 54.9 ± 5.8). Both groups were recruited from the same region as the pupils – the seniors through two senior associations and the adults through snowball sampling 40- to 50-year-olds who use English regularly at work or in their daily lives. The seniors were considered relatively monolingual, and were recruited to investigate the effect of minimal English proficiency on the judgements. With the ubiquitous presence of English in Norwegian society, most Norwegians have at least some knowledge of English, and their L1 may also become influenced by anglicised Norwegian. However, in contrast to the pupils, the seniors had received little English teaching in school and have not been heavily exposed to English in their childhood and adolescence. Hence, it is fair to assume that their English proficiency level was the lowest among the groups in the study, and they will be considered minimally bilingual. The adults were considered functionally bilingual in a similar fashion to the pupils, and were included in order to investigate the effect of English proficiency, combined with higher age, on the judgements.
Whereas the senior group participated in only the judgement test, the adults took part in both the judgement and translation tests. However, the control groups did not participate in the English proficiency test. Instead, their proficiency levels were based on self-reporting from a background questionnaire, where they rated their English proficiency level on a scale from 1 (very poor) to 6 (fluent). The adults’ mean proficiency score was 4.3 (the median was 4), which corresponds to ‘good’. The seniors’ mean and median score on the proficiency scale was 2.5, which corresponds to a proficiency level between ‘poor’ and ‘medium’. (For comparison, the pupils’ mean score was 4.6 [the median was 5], which corresponds to ‘very good’.) Although one should be cautious about trusting such self-reports – especially since the alternatives were not described in detail – the reports were nevertheless consistent with our assumptions: the pupils reported the highest English proficiency level and the seniors the lowest. While this does not provide accurate data regarding the groups’ proficiency levels, it does shed light on the relative difference of the perceived level of English proficiency in each group.
4. RESULTS
4.1 English test
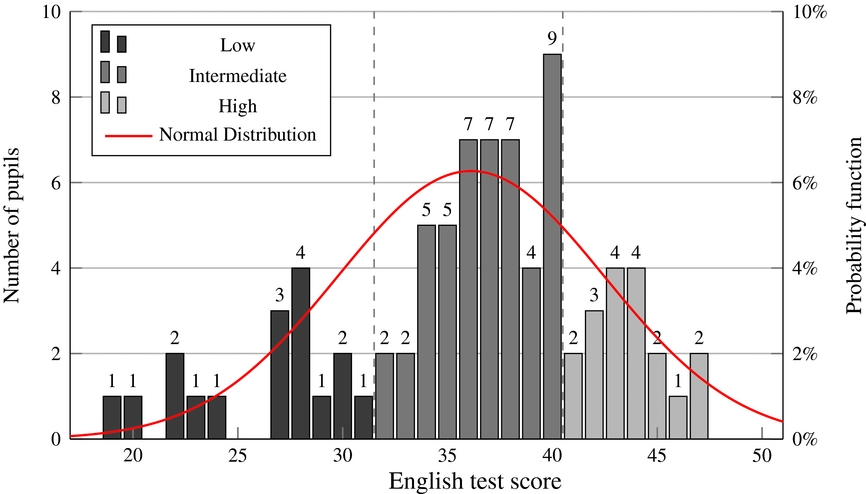
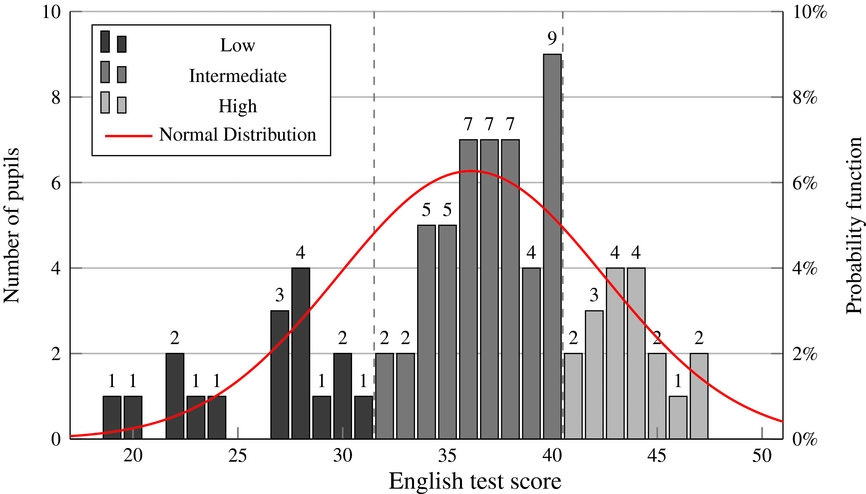
For each of the 45 exercises in the proficiency test, correct answers were given 1 point. An additional point was awarded in the four cases where fewer than 50% of the 83 pupils answered correctly, making the highest possible test score 49. The mean score was 36.12 points, with a standard deviation of 6.36. The median was 37.
The pupils were sorted into three groups based on the test scores. The group limits were chosen at approximately equidistant points from the mean value, such that the limits did not divide a cluster of scores in two. The pupils were sorted into a low proficiency group (LP, ⩽31 points), an intermediate group (IP, >31 points and ⩽40 points) and a high proficiency group (HP, > 40 points). Figure 1 shows the distribution of the results and the chosen scores separating the groups. The IP group was the largest, with 48 pupils. The LP and HP groups were of roughly equal size, containing 17 and 18 pupils, respectively.
English test scores and proficiency group limits.
4.2 Judgement results
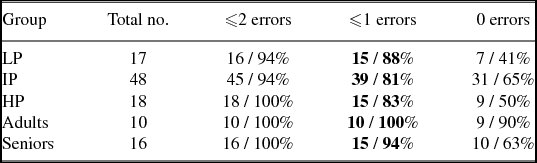
To account for the possibility that some participants were prone to accepting or rejecting at an excessively high rate, 12 filler sentences – 6 normal and 6 unnatural – were used as controls. The participants were expected to accept the normal sentences and reject the unnatural ones, and deviations were regarded as ‘errors’. Participants who had more than one error were removed from the study, thereby allowing for an accidental mistake.Footnote 13 Removing all participants who deviated from the correct series of answers would have excluded too many participants, as Table 3 demonstrates.
Number and percentage of participants remaining after control test.
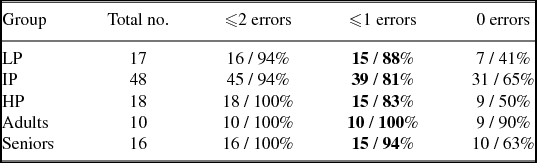
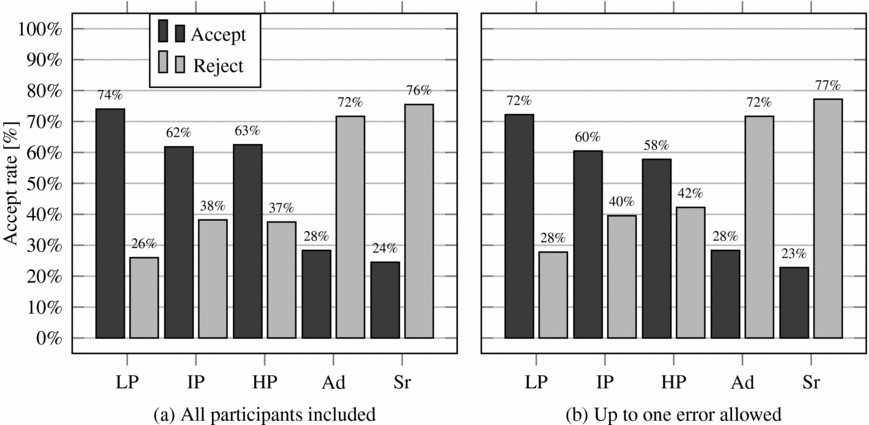
Figure 2 shows the average accept rate for the proficiency and control groups for all calques in total. Part (a) includes all the initial participants, whereas part (b) excludes participants with more than one error in judging the control sentences (bold column in Table 3). This figure shows that the general trend is similar, with the control groups differing distinctly from the pupils (discussed in more detail in Section 5.2). The most obvious change is that the accept rate for the HP group became the lowest among the pupils. The total number of participants in the analysis then became 94 (69 pupils and 25 control participants).
Percentage distribution of accept and reject across all groups for the calques combined.

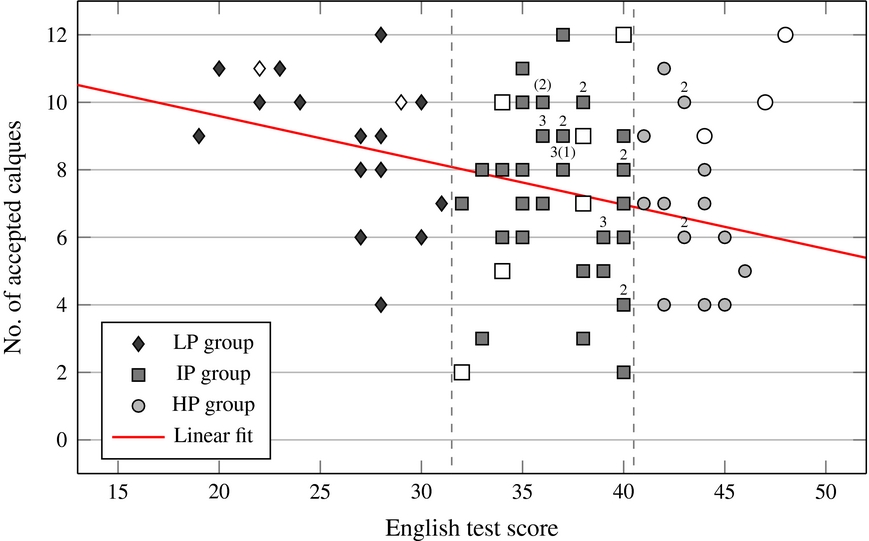
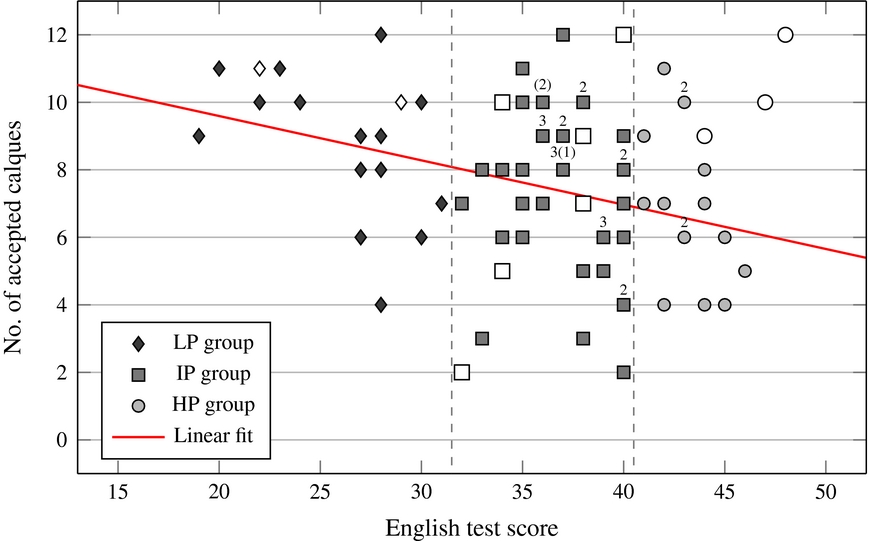
Figure 3 shows the number of accepted calques versus the English test score. The graph indicates a negative correlation (r = −0.36) between the English test score and the number of calques accepted, contrary to expectations. Furthermore, the figure shows that although there was a certain scatter within each group, there were no groups of outliers pulling the LP and HP groups in their respective directions.
Number of accepted calques versus English test score based on the pupils’ replies, where a number above the marker indicates multiple participants. White markers and numbers in parentheses indicate participants excluded from the analysis.
Proceeding with the remaining n p = 69 pupils, and the 10 adults and 15 seniors, a statistical analysis was conducted. In the judgement test, scores of 1 and 2 indicated rejecting a sentence, whereas scores of 3 and 4 indicated accepting it. For each calque, the answer can thus be rated as ‘accept’ or ‘reject’, which translates to ‘success’ or ‘failure’ in a binomial trial. The pupils were used to provide an estimate p a for the probability of a randomly selected individual accepting a given calque. This was obtained by dividing the number of accepts by the total number of pupils, resulting in a binomial distribution: bin(n p, p a). This can be approximated to a normal distribution or t-distribution given that the inequality n p · min (p a, 1 − p a) ⩾ 5 holds, which was the case for all calques. This is a standard technique for making the necessary calculations somewhat easier and to avoid the discrete nature of the binomial distribution.
The null hypothesis was that there would be no difference between the five groups in accepting or rejecting the calques. The main hypothesis was then that the groups would behave differently compared with the pupil group average when judging a calque, and that they would behave differently when compared with each other. Based on our assumption that heightened calquing can be connected to increased English proficiency, we expected that the bilingual pupils would have a higher accept rate than the minimally bilingual seniors. Further, our initial expectation was that the HP group would have the highest accept rate among the pupils and the LP group the lowest. We had no prediction for the bilingual adults, as they were included in order to investigate the the effect of English proficiency together with age.
To test the hypothesis that the groups accepted or rejected the calques at different rates, a two-tailed t-test was performed for all 12 calques listed in Table 1. Each t-test had n G − 1 degrees of freedom, where n G was the number of informants in each group. It was assumed that the informants answered independently of each other. The t-distribution was obtained by the approximation from the binomial accept/reject data as described above, with estimated mean values and variances based on the 69 pupils. Each test then checked whether each subgroup behaved differently than the total pupil average, and a p-value of 0.05 was chosen to signify statistical significance. The pupil average was extended to a 95% prediction interval (see Figure 4), where any value outside this interval constitutes statistical significance.
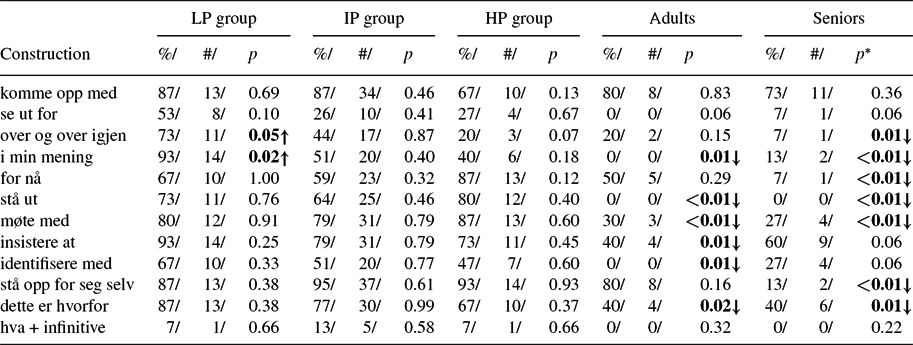
Table 4 shows the accept rates of the different groups for each calque. The number and percent of accept are given, along with calculated p-values. The symbols ↑ and ↓ indicate that the accept rates are significantly high or low, respectively.
Accept rates from the acceptability judgement test. Statistically significant results (p-value ⩽ 0.05) are marked in bold.
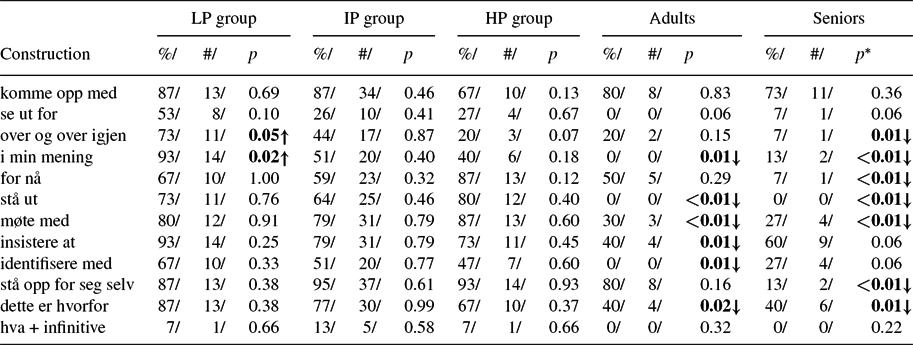
*p-values marked as <0.01 are very small and of the order 10−5 to 10−8.
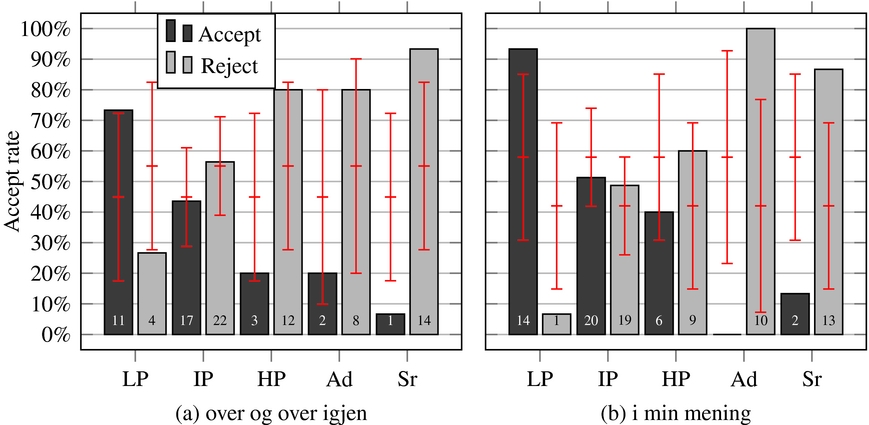
The established English calque komme opp med was accepted by the majority in all groups. Equally, the undocumented calque se ut for was rejected by most of the participants, except for those in the LP group. Furthermore, the pupil groups accepted, by more than 50%, six of the 10 remaining calques (for nå, stå ut, møte med, insistere at, stå opp for seg selv and dette er hvorfor) and rejected only hva + infinitive. The majority of the adults accepted only stå opp for seg selv and for nå, whereas the majority of the seniors accepted only insistere at. The accept rates were significantly low in 7 of the 10 calques in the senior group and in 6 of the 10 calques in the adult group. A comparison of the pupil groups revealed obvious group differences in several of the individual calques; the calques were mostly accepted, and the judgements were by and large evenly distributed between accept and reject across all groups (e.g. stå opp for seg selv, møte med and stå ut). However, the LP group’s accept rate was higher than the pupil average in six individual calques – of which over og over igjen and i min mening were statistically significant (as shown in Figure 4).
Percentage distribution of accept and reject across all groups in two selected calques. The number at the bottom of each bar denotes the total number of accepts and rejects per group; the red lines indicate the prediction interval (p-value 0.05) based on the pupil group average.
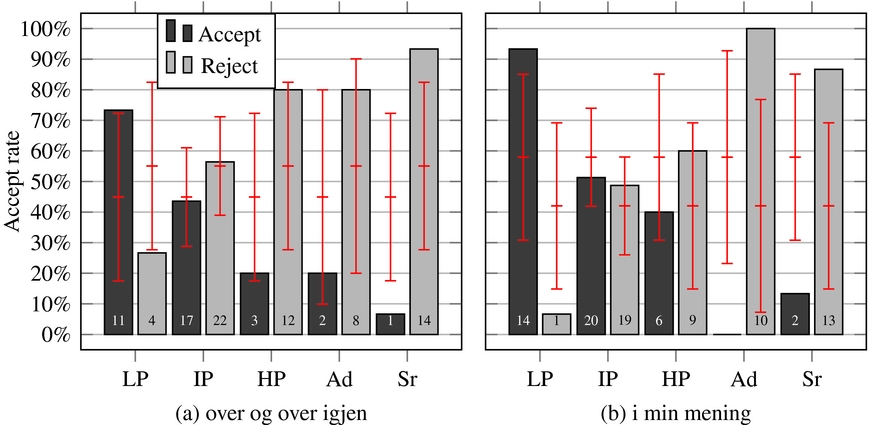
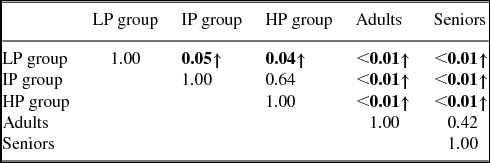
To check for a more general trend rather than for individual calques, two-tailed t-tests comparing the groups with each other were carried out using the average accept rate for each informant. Table 5 shows the t-test results for each group compared with every other group. For instance, if the IP group (row 2) is compared with the adult group (column 4), the p-value is approximately 10 − 5, and the arrow ↑ indicates that the IP group had a significantly higher accept rate. The table is symmetric. Further, the table shows that the adult and senior groups’ average accept rates were unequivocally lower than those of the pupil groups, and that there is no significant disparity between the two control groups. Further, the LP group stood out by having a significantly higher accept rate compared with both the IP and HP group.
Calculated p-values* from t-test comparing the five groups.

*Values shown as <0.01 were of the order of 10−4 to 10−8.
4.3 Translation results
The translations were sorted into three categories. If the English construction was translated word by word into Norwegian, this was categorised as a ‘calque’ (C). If the English construction was paraphrased or translated into a Norwegian equivalent expression, this was categorised as ‘Norwegian’ (N). Finally, if the sentence was either not translated or misunderstood, and hence translated into something that changed its meaning, it was classed as ‘incorrect’ (I) (see examples in Appendix B). These three outcomes resulted in a trinomial distribution. However, in undertaking the same analysis, it is possible to lump two alternatives together to form a binomial distribution when performing the analysis.Footnote 14 For instance, ‘calqued’ and ‘not calqued’ are the two outcomes, meaning that ‘not calqued’ is a combination of ‘Norwegian’ and ‘incorrect’.
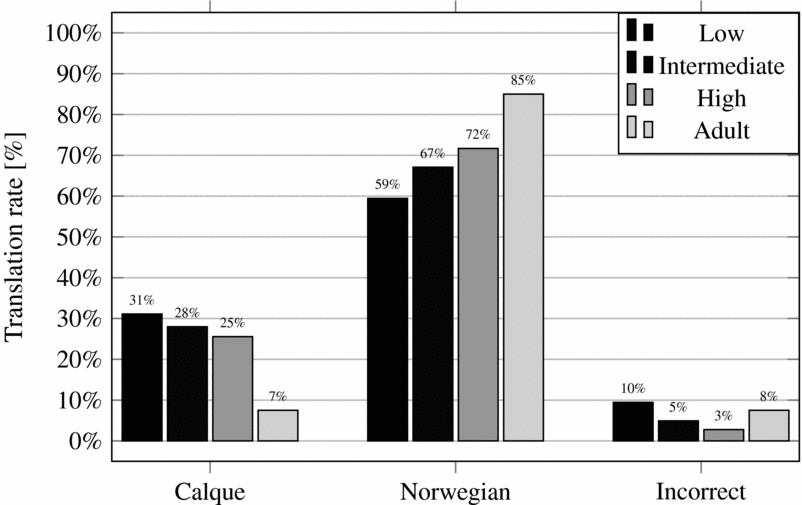
Figure 5 shows the average translation results of the different groups for the 12 English constructions. Recall that the seniors did not participate in this test. The participants who were excluded on the basis of the control test were also excluded from the translation results. The translation rates for each construction are given in Appendix D.
Percentage distribution of translations across all groups.
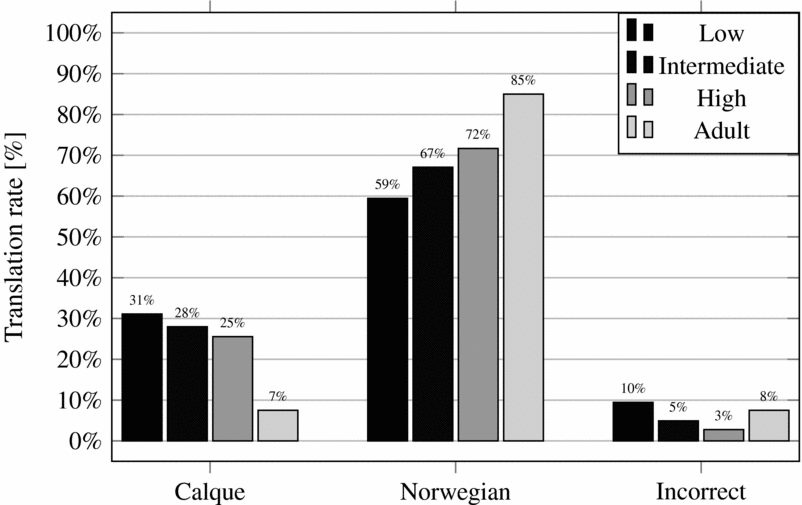
As shown in Figure 5, the translation results support the group division made on the basis of the English test; the LP group had the highest percentage of incorrect translations, whereas the HP group had the lowest. The adults ended up between the LP and IP groups, which may indicate that their level of English proficiency was on par with the pupils’. The results further show that the majority of the translations across all groups were made to what is defined as ‘Norwegian’ and hence that the groups behaved more uniformly in the translation test than in the judgement test.
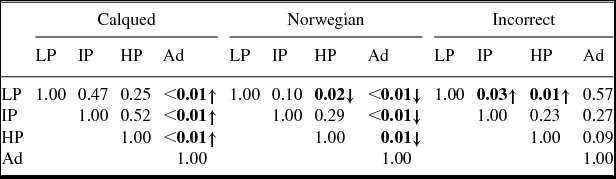
To quantify the trend, t-tests comparing the groups with each other were carried out using the average translation rate for each informant. Table 6 shows the t-test results for each group compared with every other group.
Calculated p-values* from t-test comparing the four groups.

*Values shown as <0.01 were of the order of 10−3 to 10−5.
The adult group had a significantly lower rate of calqued translations compared with all pupil groups, while simultaneously having a significantly higher rate of Norwegian translations. These findings are in accordance with the judgement test, where the adults’ average accept rate was significantly lower compared with the pupils’. Among the pupil groups, the LP group stood out by having a significantly low rate of Norwegian translations compared with the HP group. In addition, the LP group had a significantly high rate of incorrect translations compared with both the IP and HP groups. Whereas Figure 5 shows that the LP group had the highest rate of calqued translations and the HP group the lowest, Table 6 shows no statistically significant disparities. This result indicates that there was a difference between perception and production data in this study.
4.4 Main findings
Summarising the findings, we detected considerable differences in the judgement test between the pupils and the control groups. For the pupil groups, the average accept rates for all calques were 72%, 60% and 58% in the LP, IP and HP groups, respectively; the corresponding accept rates were 28% for the adults and 23% for the seniors. As shown, the disparities between the pupils and the control groups were statistically significant (discussed in Section 5.2). Furthermore, there were internal differences between the pupil groups; the LP group stood out by accepting the calques at a significantly high rate compared with the IP and HP groups (discussed in Section 5.3). This was contrary to our expectations.
In addition, there were differences between the pupils and the adults in the translation test, although these were not as striking as in the judgement test (discussed in Section 5.4). The English constructions were mostly translated into Norwegian across all groups. The observed pattern between the pupil groups was replicated in the translation test, although to a lesser extent.
5. DISCUSSION
5.1 Point of departure
The main assumption of this study is that growing English skills among Norwegians are leading to increased calquing from English. This was distilled into two predictions: (1) that the chosen calques would be accepted at a higher rate among the functionally bilingual pupils than the minimally bilingual seniors, and (2) that the accept rate would be higher among the most English proficient pupils, and lowest among the least proficient ones. Recall that we had no predictions about the bilingual adult group because we did not know whether their judgements would be determined mainly by English proficiency level or by age. Further, we had no predictions about the translation test, as this was included to compare judgements against linguistic production.
Before discussing how well the predictions fared, we will briefly comment on the judgements regarding the established calque komme opp med and the undocumented calque se ut for, which were included in order to establish a basis for comparison when evaluating the 10 presumably nonestablished and potentially emerging calques. As shown in Table 4, the majority of the participants accepted the established calque and rejected the undocumented calque. The results therefore confirm what is suggested by the corpus findings in Table 2 – that komme opp med is established in Norwegian, whereas se ut for is not. Furthermore, the results suggest that the acceptability judgements reflect existing Norwegian language practice. The acceptance of komme opp med by the seniors (as well as the adults) indicates that the expression is familiar to Norwegians in general, regardless of their English skills. Conversely, se ut for, which is not observed in Norwegian, was rejected by the majority of the participants. Whether the judgements can be said to reflect existing language practice with respect to the remaining calques is considered in Section 5.4. First, we address the differences between the pupils and the control groups and the differences between the pupil groups.
5.2 Pupils versus control groups
The majority of the seniors and the adults clearly rejected most of the calques, whereas most of the pupils accepted them. Compared with the pupil groups, the seniors’ and adults’ accept rates were significantly low (see Table 5). This was also true for several individual calques (see Table 4). Hence, the results confirm the prediction about the seniors versus the pupils. This suggests that the null hypothesis, stating that there would be no discrepancies between the age groups, can be rejected.
Seniors were included in the study to control for the effect of minimal English proficiency in the judgement test. The fact that the pupils and the seniors were born 60 years apart naturally yields several differences in their respective linguistic repertoires. Whereas the pupils have acquired English from a young age, both in school and through heavy extracurricular exposure, the seniors grew up when English was far less ubiquitous in Norwegian society than it is today. For that reason, the disparities between the pupils’ and seniors’ accept rates are likely due to the pupils’ higher level of English proficiency as well as to their more intense daily exposure to English.
The pupils are believed to have the English constructions (which the calques are modelled on) stored in their linguistic repertoires. Matras (Reference Matras2009) suggests that such constructions are harder to keep track of and ‘choose correctly’ in communication than lexical word forms. This difficulty presumably applies in reverse when it comes to the detection of ‘foreign’ constructions in the native language. The pupils’ familiarity with the constructions could increase the likelihood that the constructions will be accepted when applied to native Norwegian word forms. This suggests that the pupils were more likely to associate the English calques with and accept them within a ‘Norwegian context’.
Furthermore, although it is true that the seniors’ L1 may have been influenced by English throughout their lifetimes, it is unreasonable to assume that their English skills will ever reach the level of the pupils, unless acquiring English is consciously pursued (even then, they may still lag behind). Hence, the various English borrowings that have been taken up by the seniors have probably entered their language by spreading in Norwegian. This may explain why most of the seniors accepted the established calque komme opp med.
Although the adult group did not take the English proficiency test, we may assume that their average proficiency level lay closer to that of the pupils than the seniors, as they were recruited from groups of people who use English regularly. If accepting a calque is largely determined by English proficiency, we should therefore expect the adults to behave more like the pupils than like the seniors. This is not what the test shows. Instead, the adults’ judgements resembled those of the seniors. What distinguished the adults from the pupils is presumably, as with the seniors, the amount of early and informal experience they have had with English. Although one should be cautious about drawing conclusions based on a fairly small sample, we will offer a brief explanation for why this factor may be decisive.
According to the declarative/procedural model proposed by Ullman (Reference Ullman2001a, Reference Ullman2001b),Footnote 15 L1 acquisition relies on two distinct memory systems. Word forms (the lexicon) are memorised and processed in declarative memory (as explicit knowledge). In contrast, aspects of grammar (rules that underlie the composition of words into compounds, phrases and sentences) are stored and processed in procedural memory (as implicit knowledge) (Ullman Reference Ullman2001b, 106–107; Ullman Reference Ullman2001a, 37). L2 acquisition is characterised by the dominance of declarative knowledge. However, this is dependent on the age of exposure to the L2 and the amount of language practice in it. Ullman (Reference Ullman2001b, 108) claims that early L2 learners are able to rely more on procedural memory than late L2 learners. If this is true of the pupils, it means they have been able to analyse and store the English constructions as implicit knowledge in the same manner in which they have stored constructions in their L1. The adults, on the other hand, may have stored the constructions in the same way in which they memorise and process word forms, that is, as unanalysed chunks that can be more consciously recalled. This suggests that the pupils have stronger, more abstract mental representations of the English constructions than do the adults. If constructions are, indeed, more challenging to separate than word forms, the effect is probably even stronger among constructions that have similar mental representations. Hence, if the pupils have stored the English constructions separately from their lexical expressions, this may explain why they were more inclined to accept the constructions in Norwegian wording.
Lastly, as indicated in the corpus study in Section 3.1, some of the calques may be in an emerging phase in Norwegian – suggesting that the participants may also have been influenced by anglicised Norwegian. This may have affected the pupils more strongly than the adults, as such innovations are more likely to arise and diffuse among young, English proficient Norwegians, who are also less likely to notice that the innovations contain English constructions. This is discussed in Section 5.4.
5.3 Pupil groups
We predicted that the calques would be accepted at a higher rate among the most proficient pupils and at a lower rate among the least proficient ones. This proved to be mistaken, as can be seen in Figure 3. The judgement results show an opposite pattern. A similar pattern was observed in the translation test, but to a lesser extent. As noted, the LP group stood out by having a significantly high accept rate compared with the IP and HP groups. At the same time, they were the only group to accept the undocumented calque se ut for by more than 50%. The LP group also recorded the highest number of calqued translations as well as a significantly low number of Norwegian translations. Conversely, the HP group had the lowest accept rate among the pupil groups, although no significant difference between the HP and IP groups was found. Hence, the hypothesis that the HP group would be most inclined to accept the calques is rejected. However, this does not necessarily mean that the prediction fails to apply at a more general level; it only means that expecting such a pattern to emerge among young peers was naïve, as the differences in English proficiency among the pupils were smaller than those between the pupils and the seniors.
It is plausible to assume that although there were differences between how well the pupils knew English, they have been evenly exposed to the language on a regular basis. Based on this assumption, the null hypothesis is reasonable. However, the pupil groups did not respond equally to the calques; they differed in a manner opposite to what was expected. This requires an explanation.
Although this study did not test for it explicitly, the results from the English test may be indicative of metalinguistic awareness, that is, the ability to reflect on the rules and characteristics of a language (Jessner, Reference Jessner2008, 276). Half of the English proficiency test consisted of grammar exercises, for which high scores may indicate conscious knowledge about the English language system. The procedural/declarative distinction may also be relevant for the pupils’ ‘handling’ of their L2, as high metalinguistic awareness increases a person’s conscious or explicit knowledge of a language. Studies have suggested that high degrees of such knowledge strengthen the ability to distinguish between features connected to the various subsets in the linguistic repertoire (known as the L2 status factor, see e.g. Falk et al. Reference Falk, Lindqvist and Bardel2014; Bardel & Falk Reference Bardel, Falk, Amaro, Flynn and Rothman2012). Hence, the pupils with a low score on the proficiency test were more likely to have low metalinguistic awareness as well. It is possible that low metalinguistic awareness may impair the ability to retain the demarcation line between Norwegian and English constructions – a task that is intuitively difficult because constructions are harder to identify than word forms. Low metalinguisic awareness may therefore explain why the LP group was most inclined to regard a calque as acceptable and to choose calques in the translation test. An alternative, but not mutually exclusive, explanation may be that the LP group members resorted to word-for-word translations of constructions they did not fully understand.
Conversely, high metalinguistic awareness may strengthen the ability to retain the demarcation lines – as reflected in the HP group’s judgements, as well as in their relatively low rate of calqued translations. Hence, whereas spontaneously copying a construction from English requires having acquired the specific construction, being able to evaluate whether the construction is appropriate might depend on the degree of metalinguistic awareness.
Finally, interpreting high accept rates as a ‘deficit’ in the ability to keep track of one’s linguistic repertoire is not necessarily the only solution, as this does not take into account the effect attitudes towards borrowing may have had on the results. It should not be ruled out that participants who accepted the calques were more willing to engage in a freer and more exploratory use of their linguistic repertoire – a point that may be applied to the pupils as a whole.
5.4 Perception versus production
If in fact some of the calques are in an emerging phase in Norwegian, this may help explain the differences between the adults and the pupils, because such innovations are more likely to arise and diffuse among young, English-proficient Norwegians. To investigate the extent to which the calques were entrenched among the pupils, we examined their translation results. These may help us determine whether the judgement results are indicative of existing Norwegian language practice for the calques in general.
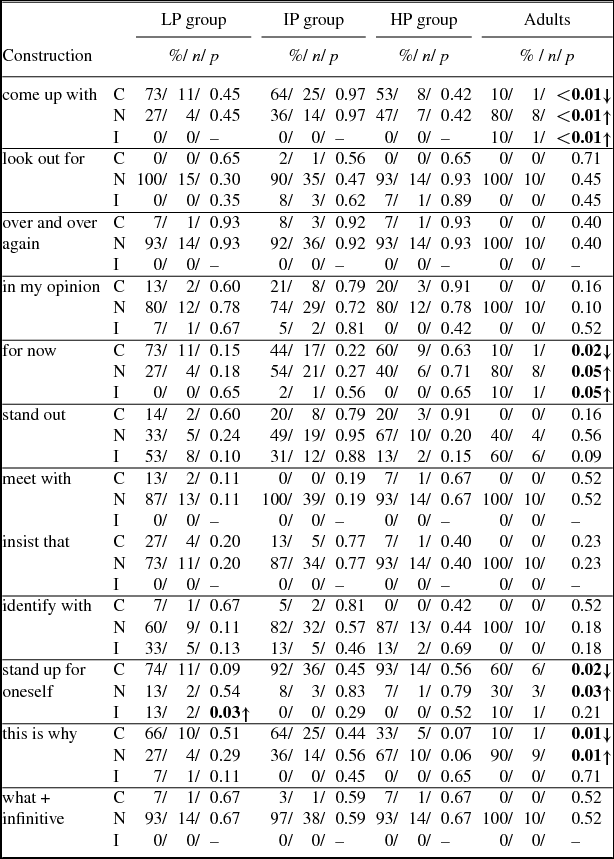
Although most of the calques were deemed acceptable by the majority of the pupils, their English versions were mainly not calqued in translation. (For the adults, calquing was even less frequent, see Figure 5 and Table 6.) Regarding komme opp med, for nå and stå opp for seg selv, the pupils' judgements were generally in accordance with the translation results, as their English counterparts were mostly translated into calques (cf. Table 4 and Appendix D). A common feature of these calques is that they lack clearly equivalent Norwegian expressions. This may indicate that it is easier for bilingual speakers to calque in translation when a native Norwegian expression is hard to find. Such linguistic ‘gaps’ also make it easier for borrowed words or constructions to gain traction in a language. The judgement and translation results also align for se ut for and hva + infinitive, which were mostly rejected in the judgement test and mostly translated into Norwegian in the translation test.
For the remaining seven constructions, however, there is a discrepancy between how they were treated in the two tests: they were mostly accepted by the pupils (except for some internal differences) and mostly translated into Norwegian. Hence, judging a calque as acceptable does not necessarily mean that the calque is well enough entrenched to become calqued in translation. This means that although the judgements may reflect existing Norwegian language practice for certain calques, this is not automatically true for the calques in general.
A possible explanation for the discrepancies between the judgements and translations is that certain accept rates are artificially high. Most of the calques are structurally similar to other Norwegian constructions. For instance, many Norwegian verbs take complement clauses, and several phrasal or prepositional verbs contain the preposition med ‘with’. Hence, both insistere at and møte med resemble native Norwegian constructions. Similarly, the only feature distinguishing the calques over og over igjen, i min mening and se ut for from their native Norwegian versions is the presence of the prepositions ‘over’, ‘i’ and ‘ut’, as shown in Table 1. This may affect how the English calques were perceived in the judgement test. Conversely, hva + infinitive may have been rejected because this calque introduces a new structure in Norwegian, as Norwegian wh-clauses normally contain a finite verb together with a subject.
An alternative, but not mutually exclusive, explanation is that the rates of calquing in translation are artificially low. Unlike the judgement test, the proficiency test was written and had correct answers. Because they knew their English skills were being tested, the pupils may have wanted to translate the English sentences into ‘proper’ Norwegian and thus consciously avoided calquing. Therefore, there may be a discrepancy between the pupils’ translations and how they would normally express these meanings in informal situations.
In summary, the study shows that the threshold for accepting a calque is lower than the threshold for actively producing the same calque. Further, the threshold for accepting calques was clearly much higher among the adults and the seniors than for the pupils. Despite a small sample size, there were evident disparities between the age groups, for which we have offered possible explanations. Lastly, we cannot disregard the fact that some among the calques are in an emerging phase in Norwegian and that the pupils’ overall inclination to accept them is therefore due to the influence of anglicised Norwegian. Nevertheless, the tendency to avoid calquing in translation suggests that the majority of the calques are not, at present, commonplace in the language.
6. SUMMARY AND CONCLUSION
The main objective of this study was to investigate how a selection of recent English calques were evaluated by groups of Norwegians with varying levels of English proficiency. The results show a clear difference between functionally bilingual pupils and minimally bilingual seniors, suggesting that the level of English proficiency is decisive for whether calques are perceived as possible in Norwegian. However, because the judgements of the bilingual adults resembled those of the seniors, we suggest that the amount of early and informal experience with English is also critical. Although more research is necessary before strong conclusions can be made, we stand by our initial assumption that increased calquing from English is connected to growing English skills among Norwegians.
The results of the pupil groups showed a pattern opposite to what was predicted based on English proficiency alone. A possible explanation for this lies in differences in degrees of metalinguistic awareness. Because tasks such as acceptability judgements depend on preferences related to for instance linguistic purism, future studies should test for both metalinguistic awareness and attitudes towards borrowing – in addition to when and in what manner the language has been acquired (i.e. mainly formally or informally).
It may be difficult to make firm conclusions about the degree to which the level of English proficiency alone affected the judgement results. However, when a calque is first introduced in Norwegian, knowledge of English is decisive, as a precondition for applying a specific construction onto Norwegian word forms is having acquired it. Further, the likelihood of a linguistic innovation’s success is dependent on the construction being understood and accepted by the interlocutors. In other words, the more people who know English, the greater the likelihood that a linguistic innovation of English will gain acceptance and diffuse in Norwegian. The academic perspectives on language contact are manifold. Our findings contribute to an understanding of how and why English constructions are finding their way into Norwegian in the first place, and they shed light on a largely unexplored area of contemporary English influence on a European language.
ACKNOWLEDGEMENTS
We are greatly indebted to the three anonymous NJL reviewers and to the journal editor Marit Julien for their careful reading of our manuscript and for their many insightful comments and suggestions. We also want to thank Kristin Melum Eide, Ivar Berg and Brit Kirsten Mæhlum for valuable input and illuminating discussions.
APPENDIX
A. Examples from acceptability judgement test
Examples of (1) test sentences, (2) normal fillers, (3) unnatural fillers and (4) neutral fillers.
(1)
(2)
(3)
(4)


B. Examples from translation test
Two examples of translations defined as ‘calque’ (C), ‘Norwegian’ (N), and ‘incorrect’ (I):
(1)
(2)


C. Examples from control test
Examples of (1) grammatical and (2) ungrammatical control sentences:
(1)
(2)


D. Results from translation test
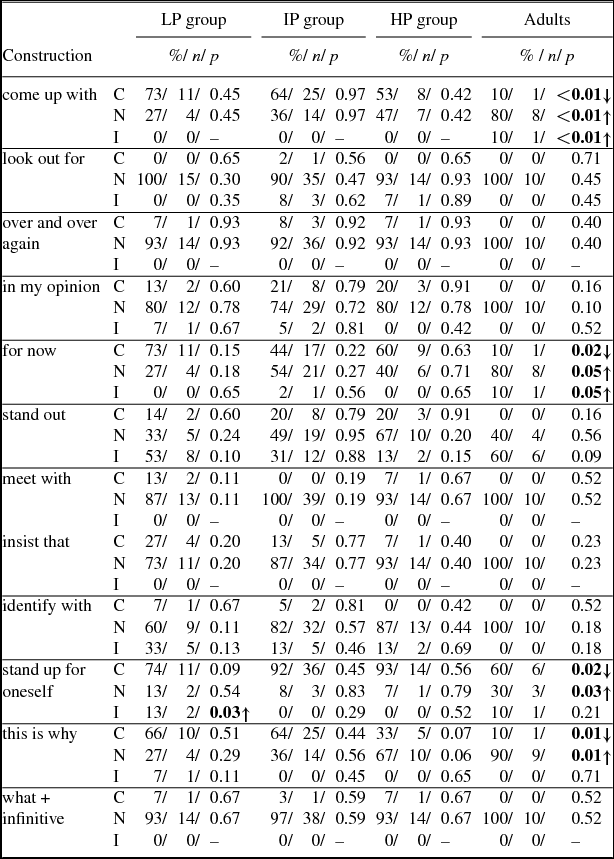
Table A1 shows the translation rates of the different groups for each construction. The number and percent of translations are given along with calculated p-values. Symbols ↑ and ↓ denote that the translation rates are significantly high or low.
Translation rates from the translation test. Statistically significant results (p-value ⩽0.05) are marked in bold.*