Implications
Organic agriculture is developing worldwide, and organic rabbit production has developed within this context. As it constitutes a break from conventional rabbit systems (battery farming), farmers lack basic scientific information. They design their production systems based on empirical knowledge that they acquire through trial and error over the years. This process raises the issue of scaling out. This article presents original scientific and technical knowledge about rabbit herbage intake regulation and growth during grazing, which is useful for current and potential organic rabbit farmers in revising or designing their production systems and corresponding practices.
Introduction
Organic agriculture is developing worldwide. In Europe, the land under certified organic farming has increased since 1985, reaching 11.5 million ha in 2013. This increase mainly applies to arable land (4.6 million ha, including sown grasslands, cereals, protein crops, oilseeds and vegetables) and permanent grassland (4.8 million ha) (Willer and Schaak, Reference Willer and Schaack2015). Due to the related increase in organic grain and forage production, organic animal production increased substantially from 2007 to 2013 for poultry (+78%), pigs (+32%), beef and dairy cattle (+50%) and sheep (+29%) (Willer and Schaak, Reference Willer and Schaack2015). This trend was particularly strong in France, with higher increases for all types of animal production: +83% for poultry, +64% for pigs, +63% for beef and dairy cattle and +51% for sheep (Agence Bio, 2014).
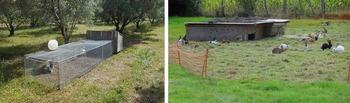
Organic rabbit production has developed within this context. Following the principles of agroecology applied to livestock systems (Dumont et al., Reference Dumont, Fortun-Lamothe, Jouven, Thomas and Tichit2013), and more specifically the principles of organic agriculture, it entails raising rabbits with a link to the soil, that is in moving cages or small pens (Figure 1). Presently, movable cage is frequently used by farmers. This system was initially developed in France in the 1970s by C. Thermeau from the Morant model (1883), and studied by A. Finzi in Italy in the 1980s. Based on its principles, specifications were developed, and nearly 20 farmers in France currently raise certified organic rabbits. As their production practices constitute a break from conventional rabbit systems (battery farming), farmers lack basic information such as rabbit intake and growth during grazing and the factors that influence these variables.
The two systems allowed in France for organic rabbit production: moving cages (left) and closed paddocks (right) (Credit: A. Duprat, M. Gemin).

Due to this gap in scientific knowledge, farmers’ production systems and corresponding practices (land area per rabbit, herbage allowance during grazing, concentrate supplementation, etc.) have been designed from empirical knowledge that farmers acquired through trial and error over the years. Designing production systems based on empirical knowledge raises the issue of scaling out, that is the process of transposing an innovation from one farm to another (Hermans et al., Reference Hermans, Stuiver, Beers and Kok2013). The empirical knowledge developed at one site might not be applicable on another site (Duru et al., Reference Duru, Therond, Martin, Martin-Clouaire, Magne, Justes, Journet, Aubertot, Savary, Bergez and Sarthou2015). Thus, there is a crucial need to develop scientific and technical knowledge useful for current and potential organic rabbit farmers in revising or designing their production systems and corresponding practices.
Three interrelated indicators are key for monitoring management when raising animals on grasslands: herbage intake, feed intake and production performance of animals, that is, their growth rate in the case of meat production (Hodgson, Reference Hodgson1990). Animal intake during grazing and related food intake and production performance have long been a topic of interest for research on dairy cows (Combellas and Hodgson, Reference Combellas and Hodgson1979; Peyraud et al., Reference Peyraud, Comeron, Wade and Lemaire1996), and to a lesser extent for that on sheep (Allden and McDWhittaker, Reference Allden and McDWhittaker1970), goats (Molina Alcaide et al., Reference Molina Alcaide, García and Aguilera1997) and horses (Chavez et al., Reference Chavez, Siciliano and Huntington2014). To date, no study has been conducted with growing rabbits. The scarce data available in the literature (Hansen, Reference Hansen1972; Short, Reference Short1985; Rayner, Reference Rayner2012; Cooke, Reference Cooke2014) have been collected only for wild rabbits and cannot be used directly for agricultural production.
The objective of this article is to produce the first set of reference data for herbage intake, feed intake and the growth rate of rabbits raised on grasslands under different environmental and management contexts (i.e. weather conditions, grassland type, feed supplementation). It focuses on herbage intake regulation, which has never been studied in rabbit production. Results are intended to provide the necessary foundations for the development of organic rabbit production.
Material and methods
Experimental design
Three experiments were performed in an experimental unit of Perpignan University, France, where the climate is Mediterranean. In experiment 1, rabbits grazed natural grassland (the main species were Avena fatua, Festuca arundinacea, Lolium perenne, Elymus repens) during spring 2014, that is the period of the year when biomass production is expected to be the highest. In experiments 2 and 3, rabbits grazed a pure stand of tall fescue (F. arundinacea) and sainfoin (Onobrychis sativa), respectively, during winter 2014 to 2015, that is the period of the year when biomass production is expected to be low to nil. Experiment 1 lasted 7 weeks, and experiments 2 and 3 lasted 5 weeks; all experiments started 2 weeks after weaning of rabbits and their transfer from the doe small pen (2 m2 under open-air tunnel) to moving cages for grazing. The time lag between weaning and the start of the experiments is related to the need for rabbits to adapt to grazing in a moving cage. In the cages, each rabbit had an area of 0.4 m2 for grazing, as required by the specifications for organic rabbit production.
Animal management and measurements
In all three experiments, rabbits were born and raised at the experimental unit. They originated from a mix of traditional breeds: Fauve de Bourgogne and Papillon. At weaning (6 weeks of age), rabbits were transferred from the nursery to moving cages on grasslands and were allotted to the latter according to litter origin and mean weaning live weight (LW, 1.01, 1.37 and 1.36 kg in experiments 1, 2 and 3, respectively). Gender was not considered when allotting as it has been shown that it does not influence rabbit intake and growth until 60% of adult weight (Gidenne, Reference Gidenne2015), that is 4.5 to 5 kg against 2.5 kg at most in our experiments. In experiment 1, 42 rabbits (six replicates of seven rabbits) were used from the age of 41 days, which corresponded to a mean LW of 1 kg. In experiments 2 and 3 each, 15 rabbits were used (five replicates of three rabbits). Rabbits were weighed individually every week to calculate their growth rates.
Grazing management and measurements
For grazing, cages (1×2.8 m in experiment 1, 1×1.2 m in experiments 2 and 3) were installed with a distance of 0.5 m between cages. They were then moved daily in parallel throughout the field to provide rabbits with fresh herbage every day. Thus, herbage allowance was not controlled. It varied depending on available biomass on the surface area of each cage. To account for these variations, herbage samples were cut every week with a manual grass shear at a height of 5 cm (corresponding to the bottom of the cages) at two areas (0.25 m2 each) of each cage: (i) between the cage and the neighboring one, to measure herbage allowance during grazing; and (ii) after moving the cage, to measure herbage refusals after grazing. Herbage samples were weighed fresh to measure herbage fresh matter (FM) allowance and refusals. They were then dried for 48 h at 60°C and weighed again to measure herbage dry matter (DM) allowance and refusals. Intake was calculated as the difference between herbage allowance and refusals in both FM and DM. Fiber concentration (NDF) was measured according to the sequential procedure of van Soest et al. (Reference van Soest, Robertson and Lewis1991). Protein concentration was measured according to the Dumas method, including full combustion of the samples and analysis of resulting gaseous N with the vario EL cube instrument (Elementar Analysensysteme GmbH, Hanau, Germany).
Feeding management and measurements
To closely mirror the practices in organic rabbit production, rabbits were supplemented throughout the experiments with an organic pelleted complete feed (86.5% DM, CP: 16.5%, crude fat: 3.5%, crude fiber: 17.0%, ADF: 19.5%, digestible energy: 9.60 MJ/kg) containing wheat bran (38.1%), alfalfa (35%), sunflower meal (18.6%), maize (5%), bentonite (2%), soybean meal (1%), calcium carbonate (0.2%) and sodium chloride (0.1%). Pelleted feed was limited to 80 g FM/rabbit per day in experiment 1 and 60 g FM/rabbit per day in experiment 2. Hay was also provided ad libitum during experiment 1, but as its measured consumption was low (<10% DM intake), we did not distribute hay during experiments 2 and 3. Refusals of hay and pelleted feed were weighed every week. Feed intake was calculated from the difference between offer and refusals.
Data analysis
Data analysis started with normality analysis of the data set to remove outliers. For example, 4% of the data on herbage DM intake were considered unrealistic, that is >0 and <70 g DM/rabbit per day. One-way ANOVAs were used to test the experiment effect on several variables of interest (herbage DM intake, growth rate of rabbits, etc.). Results revealed a significant experiment effect. Instead of replicating the same experiment over a single season and across several years, we used a statistical method, that is linear mixed models, assessing the explanatory variables on response variables whatever the conditions, not only on our three experiments. Our experiments can be viewed as a random sample of conditions over a much larger set. The mixed-model method accounted for both fixed effects of explanatory variables (i.e. herbage allowance, herbage feed value (fiber, protein and DM content), rabbit metabolic weight) and random effects of explanatory variables (i.e. experiment effect including weather conditions, day length, grassland type, herbage feed value, feed supplementation). For this mixed model, the restricted maximum likelihood (REML) estimation method was considered the most appropriate, as its estimates of variance parameters are unbiased, unlike those of maximum likelihood estimates.
Dependencies among explanatory variables were analyzed pairwise using REML, with the experiment as a random term. It aimed to identify covariance patterns among explanatory variables. The response of herbage intake and rabbit growth rate to herbage allowance, herbage feed value and rabbit metabolic weight was analyzed using the same methods. Starting with the full fixed models, non-significant interactions between these variables were eliminated after REML analysis. Models with explanatory variable effects taken as fixed additive terms were obtained, as in the following example for herbage intake:
 $$\eqalignno{Herbage\_Intake_{{i,j,k,l,m,n}} \,{\equals}\,\mu {\plus}HerbageAllowance_{i} \cr{\plus}DryMatterContent_{j} \cr{\plus}FiberContent_{k} \cr{\plus}ProteinContent_{l} \cr{\plus}MetabolicWeight_{m}\cr {\plus}Experiment_{n} {\plus}{\varepsilon}_{{i,j,k,l,m,n}} $$
Results
Grazing conditions of rabbits raised on grasslands
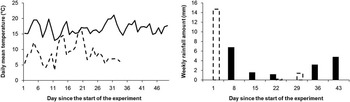
Grazing occurred under normal conditions in all three experiments (Figure 2). Experiment 1 was characterized by warm and dry conditions: daily mean temperature ranged from 12.9°C to 21.1°C (overall mean=16.8°C), whereas weekly rainfall ranged from 0 to 6.8 mm. As experiments 2 and 3 occurred in winter, daily mean temperature was lower (3.2°C to 16.8°C, overall mean=8.4°C), whereas rainfall was equally high but more variable, with a peak of 15 mm during the 1st week of the experiment. No extreme temperature or rainfall events occurred in any of the experiments.
Daily mean temperature (left) and weekly rainfall amount (right) over time in experiment 1 (solid line and bars) and experiments 2 and 3 (dashed line and bars).

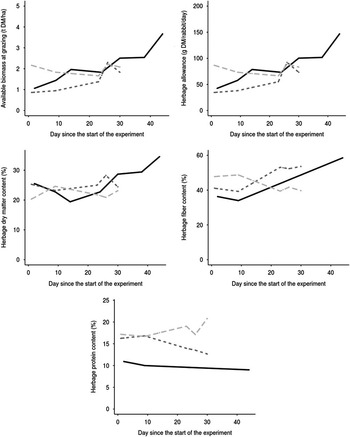
Available biomass during grazing increased regularly throughout experiment 1, except from day 14 to 24, when it dropped from 2.0 to 1.8 ton DM/ha (Figure 3). Biomass production sharply increased from day 38 until the end of the experiment, when it reached 4.9 ton DM/ha. Available biomass also increased during grazing in experiment 2, except from day 26 to 30. Day 26 was also the only day when available biomass in experiment 2 exceeded that in experiment 1. Available biomass during grazing was an average of 51% lower in experiment 2 than in experiment 1. Experiment 3 started with the highest amount of available biomass during grazing (2.2 ton DM/ha), which remained the most constant during grazing, ranging from 1.6 to 2.2 ton DM/ha. As the area available per rabbit remained constant among experiments, herbage allowance per rabbit and per day followed the same trends. During the first 33 days of the experiments and across experiments, herbage allowance was a mean of 69.4±19.9 g DM/rabbit per day.
Available biomass during grazing (ton dry matter (DM)/ha), herbage allowance (g DM/rabbit per day), herbage DM content (%), herbage fiber content (% NDF) and herbage protein content (%) over time in experiments 1 (black line), 2 (dotted dark gray line) and 3 (dashed light gray line).

Herbage feed value tended to decrease over time in experiments 1 and 2 and to increase over time in experiment 3 (Figure 3). During the first 33 days of the experiments, herbage DM content ranged from 19.4% to 28.7% among experiments, with relatively low between-week variation (mean=3.0%) over time. Herbage DM content increased afterwards in experiment 1 until reaching 34.6%. Herbage fiber content increased from day 9 of experiments 1 and 2 and was an average of 3.1% higher in the latter. In contrast, in experiment 3, herbage fiber content was highest until day 9 (mean=48.2%) and decreased afterwards until reaching 39.7%. In experiments 1 and 2, herbage protein content decreased over time, whereas in experiment 3 it remained around 17.2% up to day 28 and then increased afterwards until reaching 20.8%. Herbage protein content was the only variable analyzed that clearly differed among all three experiments (Figure 3): experiment 3 had higher protein content than experiment 2, which had higher protein content than experiment 1.
Herbage intake of rabbits raised on grasslands
Mean herbage DM intake per rabbit and per day differed (P<0.001) between experiments (Table 1). It was highest in experiment 1 (78.5 g DM/day), in which available biomass during grazing was most abundant, and was 43.9 and 51.2 g DM/day in experiments 2 and 3, respectively. Despite having relatively low CV per experiment (14.4% to 20.7%), herbage DM intake varied greatly, ranging from 11 to 152 g DM.
Mean and standard deviation of herbage intake in the three experiments

LW=live weight.
When considering herbage FM intake, experiment 1 consistently displayed the highest mean intake (309.5 g FM/day), whereas experiments 2 and 3 had 181.8 and 255.2 g FM/day, respectively (Table 1). Mean DM content of sainfoin (experiment 3) was lower than that of tall fescue (experiment 2) (Figure 3); thus, it had a higher mean FM intake for a slightly higher DM intake. Variations throughout the experiments were comparable with the results obtained for herbage DM intake, with CV per experiment in the range 18.6% to 21.9%.
When expressed per kg of metabolic weight, mean herbage DM intake remained the highest in experiment 1 (38 g DM/day per kg LW0.75), but was higher in experiment 2 than in experiment 3 (Table 1). As rabbits were lighter in experiment 2 (described later), mean intake per kg of metabolic weight was higher with a lower DM intake per rabbit. Variations were smaller for herbage DM intake per kg of metabolic weight compared with FM and DM herbage intake per rabbit; CV per experiment in the range 15.9% to 18.5%.
Determinants of herbage intake of rabbits raised on grasslands
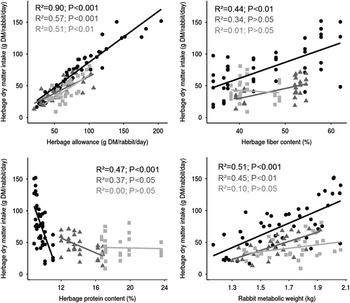
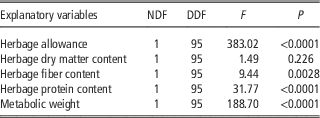
Herbage allowance was the most significant determinant of herbage DM intake during grazing (P<0.001, Table 2). Herbage intake was positively correlated with herbage allowance, irrespective of the experiment (Figure 4). Thus, irrespective of grassland type, weather conditions or day length, the higher the herbage allowance, the higher the rabbit intake during grazing. Across experiments, a 10 g DM increase in herbage allowance corresponded to a 6.81 g DM mean increase in daily herbage DM intake. This increase was highest in experiment 1 (8.0 g DM) and experiment 3 (7.06 g DM) compared with experiment 2 (5.35 g DM).
Herbage allowance, fiber content, protein content and rabbit metabolic weight influences on herbage dry matter (DM) intake per rabbit according to the experiment (experiment 1: black, experiment 2: dark gray, experiment 3: light gray).

Restricted maximum likelihood analysis of relationships between herbage intake and explanatory variables

NDF = numerator degrees of freedom; DDF = denominator degrees of freedom.
Herbage feed value also contributed to determining rabbit daily DM intake during grazing (Table 2). The most significant effect was for herbage protein content, which was negatively correlated with herbage intake. This trend was mainly driven by experiment 1 (decrease in herbage intake of 37.2 g DM per additional percentage point of protein) as no similar effect was observed in experiment 3 (Figure 4). Herbage fiber content also positively influenced herbage intake in experiments 1 and 2, but the correlation was statistically significant only for the former (increase in herbage intake of 2.5 g DM per additional percentage point of fiber; Figure 3). Herbage DM content had no significant effect on herbage intake.
In contrast, rabbit metabolic weight influenced herbage DM intake per rabbit significantly (Table 2). Herbage DM intake per rabbit increased as the metabolic weight of rabbits increased (Figure 4). The highest correlation was found in experiment 1, in which a 100 g increase in metabolic weight corresponded to a 9.6 g DM increase in herbage intake. This increase was limited to 7.1 g DM in experiment 2 and was not significant in experiment 3.
Feed intake of rabbits raised on grasslands
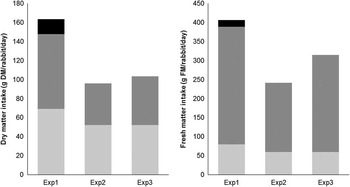
Daily mean DM intake differed significantly between experiments (P<0.001), ranging from 96.1 g DM/rabbit per day in experiment 2 to 163.6 g DM/rabbit per day in experiment 3 (Figure 5). Among experiments, herbage and concentrate represented 46% to 50% and 42% to 54%, respectively, of rabbit DM intake. In experiment 1, hay intake was another 10% of total intake. Rabbits fully consumed the pelleted feed: 69, 52 and 52 g DM/day in experiments 1, 2 and 3, respectively. In comparison, as mentioned previously, herbage DM intake was 78.5, 43.9 and 51.2 g DM/day in experiments 1, 2 and 3, respectively. Thus, herbage DM intake exceeded that of pelleted feed only in experiment 1, in which herbage allowance was highest.
Mean daily dry matter (DM) (left) and fresh matter (right) intake of hay (black), herbage (dark gray) and concentrate (light gray) by rabbits in the three experiments.

Variations in daily mean intake of FM were significant among experiments (P<0.01), with 241.8 and 406.2 g FM/rabbit per day in experiments 1 and 2, respectively. Herbage represented 75% to 81% of rabbit intake, whereas concentrate, with a high DM content, represented only 19% to 25% of rabbit intake. In experiment 1, hay was another 4% of FM intake. Sainfoin (experiment 3) had the lowest mean DM content measured across the three experiments and the highest mean herbage FM intake: 255.2 g FM/rabbit per day.
Growth rate of rabbits raised on grasslands
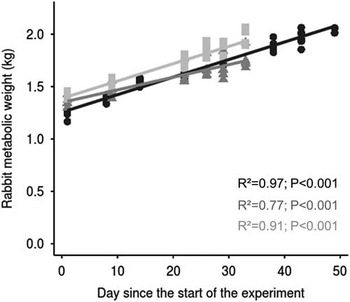
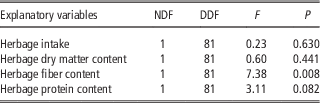
Metabolic weight of rabbits raised on grasslands increased linearly over time in all three experiments (Figure 6). The resulting daily mean growth rates were 26.2, 19.2 and 28.5 g/day in experiments 1, 2 and 3, respectively. Thus, unlike the results for FM and DM intakes, the highest growth rate was obtained on the sainfoin grassland and the lowest on the tall fescue grassland. Thus, there was no correlation between total FM and DM intakes and rabbit growth rates (Table 3). The latter was rather related to herbage fiber content and tended to decrease as herbage fiber content increased. Other determinants of feed value (herbage DM and protein contents) had no significant influence on rabbit growth rates.
Metabolic weight of rabbits over time according to the experiment (experiment 1: black, experiment 2: dark gray, experiment 3: light gray).

Restricted maximum likelihood analysis of relationships between rabbit growth rate and explanatory variables

NDF = numerator degrees of freedom; DDF = denominator degrees of freedom.
Discussion
Grazing and feeding behavior of rabbits
The relative daily mean intake was 71.4 g DM/kg LW0.75 when combing herbage, hay and complete feed intakes. Cooke (Reference Cooke2014) found a similar intake (65.7 g DM/day per kg LW0.75) for free-range wild rabbits in southern Australia. This amount is also within the range of intakes observed for young animals: 75 g DM/day per kg LW0.75 for lambs and 79 g DM/day per kg LW0.75 for heifers (Dulphy et al., 1989). These similarities confirm the potential of raising rabbits on grasslands, whereas limiting complete feed supplementation but without compromising their total intake.
Herbage intake reached 30.6 g DM/kg LW0.75, that is 43% of total intake. Compared with Cooke’s (Reference Cooke2014) study, this indicates that growing rabbits were often far from their potential herbage intake. This highlights the possibility to further reduce complete feed supplementation to increase herbage intake, as occurred between experiment 1 and experiments 2 and 3. Moreover, our results showed that despite less feed supplementation (−25% lower in experiment 3 than in experiment 1) and herbage intake (−35% lower in experiment 3 than in experiment 1), it is possible to obtain reasonable rabbit growth (26.2 g/day) by modulating herbage quality, especially when providing rabbits with protein-rich legumes such as sainfoin. Thus, it seems possible to reduce concentrate distribution without reducing animal performance, as previously observed for dairy cows (Pérez-Prieto et al., Reference Pérez-Prieto, Peyraud and Delagarde2011).
Further substitution of complete feed with herbage implies that adequate grazing conditions be met to promote herbage intake and the resulting animal performance. As already observed with dairy cows (Pérez-Prieto and Delagarde, Reference Pérez-Prieto and Delagarde2013), herbage allowance is a key determinant of rabbit herbage intake. During the first 33 days of the experiments, mean herbage DM intake was 51.4 g DM/rabbit per day, corresponding to 74% of the mean herbage allowance (69.4 g DM/rabbit per day). This efficient herbage utilization was already high compared with observations elsewhere in France with cattle and sheep (Mazzanti and Lemaire, Reference Mazzanti and Lemaire1994; Martin et al., Reference Martin, Theau, Therond, Martin-Clouaire and Duru2011). Thus, a small reduction in allowance might greatly decrease herbage intake.
Herbage feed value, especially herbage fiber and protein contents, is another key component to promote further substitution of complete feed with herbage. Refusals during grazing had about 5 percentage points lower protein content than grazed herbage, indicating that rabbits are selective during grazing, as previously observed for other species (Farruggia et al., Reference Falkenstein, Choquenot and Jarman2006). We have also shown that herbage fiber and protein contents had a significant influence on herbage intake and rabbit growth rate, as for other species (Rotz et al., Reference Rotz, Buckmaster and Comerford2005). Thus, promoting substitution of complete feed with herbage requires grasslands that include legumes, such as sainfoin, as they offer a more satisfactory trade-off between fiber and protein contents than grass species (INRA, 2007).
In experiments 2 and 3, the range of herbage allowance seems too narrow to precisely characterize the limit over which herbage intake reaches a plateau. Above a certain threshold, the positive correlation observed between herbage allowance and herbage intake might be irrelevant due to a physiological intake limit for the growing rabbit. The latter is estimated to be around 600 to 700 g FM/day, as found for appetizing products such as fresh whole carrots (642 g FM and 93 g DM/day; Goby et al., Reference Goby, Huck, Fortun-Lamothe and Gidenne2013). When fed a complete pelleted feed in conventional rabbit production systems, the DM intake ranged from 150 to 170 g DM/day for a rabbit weighing 2 kg (Gidenne and Lebas, Reference Gidenne and Lebas2006).
As the range of herbage allowance was highest in experiment 1, it was possible to fit our herbage intake data to an inverted exponential curve (Short, Reference Short1985):
 $$HI\,{\equals}\,HI{\rm max}{\times}\left( {{\rm 1}{\minus}{\rm exp}\left( {{\minus}{{HB{\minus}HB{\rm res}} \over {HB{\rm th}}}} \right)} \right)$$
where HI is the herbage intake, HImax the maximum herbage intake, HB the herbage biomass, HBth the herbage biomass at which rabbit ingests 63% of HImax, and HBres the residual herbage biomass after grazing.
We found the following equation: HI=58×(1−exp(−(HB−0.3)/1.4), R 2=0.88, P<0.001). The biological significance of this equation seems reliable, as HImax (58 g DM/day per kg LW0.75) was close to the highest intake observed (62.5 g DM/day per kg LW0.75) and was within the range of 40 to 68 g DM/day per kg LW0.75 obtained by Short (Reference Short1985) and Falkenstein et al. (Reference Farruggia, Dumont, D’hour, Egal and Petit1995), respectively, for wild rabbits. The calculated residual biomass after grazing (HBres=0.3 ton DM/ha) and biomass at which the rabbit ingested 63% of HImax (V=1.4 ton DM/ha) were also similar to values measured in experiment 1.
From this equation, we estimated that maximum herbage DM intake is reached at an herbage biomass of 3.5 ton DM/ha. This initial estimate from a single data set must obviously be confirmed by additional studies under different soil–grassland–climate conditions to strengthen and develop the knowledge of rabbits raised on grasslands. These experiments should also support development of mechanistic models of rabbit nutrition when raised on grasslands and detail DM, energy and protein intake, and digestion, as has been developed for other species (Freer et al., Reference Freer, Moore and Donnelly1997; Rotz et al., Reference Rotz, Buckmaster and Comerford2005; INRA, 2007) to support farmers’ decisions.
Perspectives for informing the development of organic rabbit production systems
By raising rabbits on grasslands, organic rabbit production is a break from conventional battery production. It is also a prototype of an agroecological livestock production system. Dumont et al. (Reference Dumont, Fortun-Lamothe, Jouven, Thomas and Tichit2013) developed five ecological principles to optimize agroecological systems, three of which match the strengths and room for improvement of organic rabbit production systems:
-
(i) Adopting management practices that improve animal health
Under the agroecological paradigm, farmers focus on the causes of animal health problems to limit their occurrence and the related use of chemical drugs. Although conventional battery rabbit production uses high amounts of antibiotics and anthelmintics (ANSES, 2014), organic systems limit the spread of diseases and parasites by moving cages to a new location each day and waiting at least 2 months before returning them to the same place. Moreover, grazing can provide rabbits with plants, such as sainfoin, with high concentrations of condensed tannins. These plants have been shown to hamper the development of parasites on grazing sheep (Hoste et al., Reference Hoste, Torres-Acosta, Sandoval-Castro, Mueller-Harvey, Sotiraki, Louvandini, Thamsborg and Terrill2015). Studies are needed to confirm their potential with grazing rabbits.
-
(ii) Decreasing the inputs needed for production
Dumont et al. (Reference Dumont, Fortun-Lamothe, Jouven, Thomas and Tichit2013) defined agroecological livestock production systems as systems that stimulate natural processes to reduce input use. Raising rabbits on grasslands entails partly substituting feed inputs with grazed herbage. Our study showed that this is feasible without compromising animal performance. In our open-air herbage system, rabbit growth was moderate (26.2 g/day) compared with the 22.7 g/day obtained by McNitt et al. (Reference McNitt, Way, Way and Forrester-Anderson2003). In addition, growth varied greatly among experiments (50% between experiments 2 and 3), which is in accordance with differences in herbage feed value and environmental conditions. Even though the growth rate is nearly half of that observed in conventional systems, organic systems enable significant reduction in production costs, compensating for the decrease in revenue. Further reduction in complete feed input seems possible by improving grazing management and using herbage height as an indicator to manage the trade-off between herbage allowance and nutritive value (fiber and protein content), as has long been practiced with other species (Hodgson, Reference Hodgson1990).
-
(iii) Decreasing pollution by optimizing the metabolic functioning of farming systems
Raising rabbits on grasslands is promising for improving the metabolic functioning (Dumont et al., Reference Dumont, Fortun-Lamothe, Jouven, Thomas and Tichit2013) of rabbit production systems. Rabbits emit fewer greenhouse gases, especially methane (Belenguer et al., Reference Belenguer, Fondevila, Balcells, Abecia, Lachica and Carro2011), than ruminants (Franz et al., Reference Franz, Soliva, Kreuzer, Hummel and Clauss2011). Moreover, grasslands favor coupling of C, N and P cycles, especially when they include legumes that link C–N–P cycles through symbiotic N fixation (Drinkwater and Snapp, Reference Drinkwater and Snapp2007). Immobilizing C, N and P in relatively stable organic matter is the key determinant of the extent and resilience of a soil’s ability to autonomously provide nutrients adapted to plant requirements and decrease nutrient losses to the environment (Drinkwater and Snapp, Reference Drinkwater and Snapp2007; Soussana and Lemaire, Reference Soussana and Lemaire2014). These processes can be strengthened by manure application during rabbit grazing, which increases the size and diversity of soil microbial populations and the biological fertility of soils (Diacono and Montemurro, Reference Diacono and Montemurro2010). These benefits depend greatly on finding the relevant intensification level, which is highly site dependent (Soussana and Lemaire, Reference Soussana and Lemaire2014). Further research is needed to define optimal rabbit stocking rates according to soil–climate conditions.
Acknowledgments
This work was funded by the French Ministry of Agriculture (Casdar complémentaire Lapin Bio), the INRA metaprogram GISA (project PROF), the INRA division PHASE (project MarkPast) and the INRA AgriBio 4 program (project CUNIPAT). The authors thank all the technicians involved in data collection and analysis.