Implications
Our results propose that selection in contrasting environments and/or breeding goals plays a role in the expression of immuno-physiological mechanisms of dairy cows. It is suggested that these differences may reflect an innate energy-conserving adaptation to successful survival in pasture-based environments. The implication of these findings is that genetic and environmental background may influence immuno-physiological responses and this should be considered when breeding cows in pasture-based systems.
Introduction
The ‘Economic Breeding Index’ (EBI) selection tool was created in Ireland to achieve balanced genetic selection in Irish dairy cattle for traits of economic significance without deleterious consequences in a pasture-based system of milk production (Veerkamp et al., Reference Veerkamp, Dillon, Kelly, Cromie and Groen2002). The EBI is expressed in euros per lactation and ranks animals on overall expected profit per lactation based on the animal’s predicted transmitting ability for genetic superiority in terms of milk production, fertility, survival, calving performance, beef performance and health (udder health and lameness). An important component of the EBI is that it includes cows of diverse genetic backgrounds including North American (NA) and New Zealand (NZ) Holstein–Friesians. In North America where cows are predominantly kept indoors on total mixed rations (i.e. confinement), a different set of breeding goals has been derived compared to NZ where cows are outdoors all year round on grass (Boettcher et al., Reference Boettcher, Fatehi and Schutz2003; Bryant et al., Reference Bryant, López-Villalobos, Pryce, Holmes, Johnson and Garrick2007). Cows of NA ancestry have high milk output achieved with maximal energy inputs and have traditionally been aggressively selected for milk yield, increased body size and some phenotypic traits such as udder conformation. On the other hand, cows of NZ ancestry were selected for moderate milk output with high milk fat and protein production within lower energy input grazing systems. Additionally, as milk production in NZ is dependent on the seasonality of grass growth, a compact calving pattern along with small body size is desirable to maximise grass utilisation and feed efficiency while preventing pasture poaching during adverse weather conditions. Thus cows in such systems were selected for small size, calving ease, good fertility and herd survival (success or failure of the cow each lactation) without particular attention being paid to phenotypic traits or disease resistance (Boettcher et al., Reference Boettcher, Fatehi and Schutz2003; Bryant et al., Reference Bryant, López-Villalobos, Pryce, Holmes, Johnson and Garrick2007). The implications of production system and the related selection mechanisms for processes governing animal health in the peripartum and early lactation periods are currently very poorly understood.
Calving elicits an innate acute response characterised by neuroendocrine changes and, in some cows, pyrexia, leukocytosis and an increase in acute phase proteins (Mallard et al., Reference Mallard, Dekkers, Ireland, Leslie, Sharif, Vankampen, Wagter and Wilkie1998; Smith and Risco, Reference Smith and Risco2005). These alterations experienced 3 weeks pre-calving and lasting up to 3 weeks post-calving, a period known as the ‘transition’ or ‘peripartum’ period, are believed to contribute to alterations in, and impaired, immune function (Mallard et al., Reference Mallard, Dekkers, Ireland, Leslie, Sharif, Vankampen, Wagter and Wilkie1998; Burton et al., Reference Burton, Madsen, Chang, Weber, Buckham, van Dorp, Hickey and Earley2005; Smith and Risco, Reference Smith and Risco2005; Feldman et al., Reference Feldman, Zinkl and Jain2006). This in turn is one of the main causes of the high incidence of disease in dairy cows during the transition period and early lactation (Mallard et al., Reference Mallard, Dekkers, Ireland, Leslie, Sharif, Vankampen, Wagter and Wilkie1998; Smith and Risco, Reference Smith and Risco2005).
There is evidence that genetic factors influence peripartum immunocompetence (Mallard et al., Reference Mallard, Dekkers, Ireland, Leslie, Sharif, Vankampen, Wagter and Wilkie1998; Detilleux, Reference Detilleux2002); however, this effect has only been investigated in animals selected under confinement breeding goals in confinement systems. These studies (Mallard et al., Reference Mallard, Dekkers, Ireland, Leslie, Sharif, Vankampen, Wagter and Wilkie1998; Detilleux, Reference Detilleux2002) have pointed out significant genetic variation and heritability in some immunological traits (e.g. immunoglobulin concentrations, neutrophil counts, neutrophil functionality and migration), which could be used to select for cows with greater longevity (Detilleux et al., Reference Detilleux, Kenneth, Koehler, Freeman, Kehrli and Kelley1994; Mallard et al., Reference Mallard, Dekkers, Ireland, Leslie, Sharif, Vankampen, Wagter and Wilkie1998; Detilleux, Reference Detilleux2002). The potential for genetic improvement in other immunological parameters (e.g. acute phase proteins) has also been documented (Detilleux, Reference Detilleux2002; Bannerman et al., Reference Bannerman, Kauf, Paape, Springer and Goff2008). The inclusion of such traits, or correlated traits, in overall breeding goals could increase disease resilience in dairy cattle without compromising milk production (Mallard et al., Reference Mallard, Dekkers, Ireland, Leslie, Sharif, Vankampen, Wagter and Wilkie1998; Detilleux, Reference Detilleux2002).
Nevertheless, little is known of the potential effects of selection on EBI or cow genetic background on the peripartum innate immune system or peripartum health of cows in pasture-based systems. This is mainly attributable to the lack of sufficient data on cow innate immune function in such systems (i.e. stress response and/or acute phase response) to estimate genetic parameters for these traits or to estimate their correlations with other traits (e.g. health and fertility) in the breeding goal. One approach to evaluating any potential consequences of selection on traits that are difficult to record or on resource-intensive measurements is through controlled selection experiments. The objective of this study was therefore to examine the effect of EBI value and genetic background on periparturient and early lactation haematological and acute phase proteins profiles, health and fertility in a controlled pasture-based environment. We hypothesised that animals of superior genetic merit for survival, health and fertility, as reflected in their higher EBI and with different genetic backgrounds, would impact haematological and acute phase proteins profiles and health in the peripartum and early lactation periods.
Material and methods
This study was carried out at Curtins Research Farm, Teagasc, Moorepark Dairy Production Research Centre, Fermoy, Co. Cork, in the south of Ireland. All procedures were carried out under licence no. B100/3797 issued by the Irish Department of Health and Children, in accordance with the European Communities (Amendment of Cruelty to Animals Act 1876) Regulations 2002. In addition, this study was approved by the University College Dublin, Animal Research Ethics Committee.
Animals
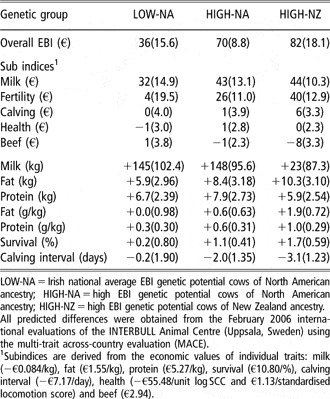
We compared based on the Irish total merit index, the EBI (Veerkamp et al., Reference Veerkamp, Dillon, Kelly, Cromie and Groen2002) and genetic background, 126 spring calving Holstein–Friesian cows (mean calving date of February 23, 2006; range January 12 to April 29) divided equally into three genetic groups. Details of the genetic groups are described elsewhere (Olmos et al., Reference Olmos, Boyle, Horan, Berry, O’Connor, Mee and Hanlon2008). In summary, the genetic groups were as follows: cows of the Irish national average genetic potential of NA ancestry (LOW-NA), cows with high genetic potential NA ancestry (HIGH-NA) and cows with high genetic potential of NZ ancestry (HIGH-NZ). The mean pedigree index (from the February 2006 international evaluations of the INTERBULL Animal Centre, Uppsala, Sweden for milk production traits and the February 2006 domestic genetic evaluation for other traits) for each genetic group across a range of traits is summarised in Table 1. The parity structure of the animals in the study was the same across the different genetic groups with 25% first, 25% second and 50% of third or greater parity animals.
The mean Economic Breeding Index (EBI) pedigree index for the three genetic groups of Holstein–Friesian cows based on their predicted transmitting abilities (and s.d.) for milk production, survival (fertility and health) and calving performance (calving ease and calving interval)

LOW-NA = Irish national average EBI genetic potential cows of North American ancestry; HIGH-NA = high EBI genetic potential cows of North American ancestry; HIGH-NZ = high EBI genetic potential cows of New Zealand ancestry.
All predicted differences were obtained from the February 2006 international evaluations of the INTERBULL Animal Centre (Uppsala, Sweden) using the multi-trait across-country evaluation (MACE).
1Subindices are derived from the economic values of individual traits: milk (−€0.084/kg), fat (€1.55/kg), protein (€5.27/kg), survival (€10.80/%), calving interval (−€7.17/day), health (−€55.48/unit log SCC and €1.13/standardised locomotion score) and beef (€2.94).
Concentrate input in early lactation
Animals from the different genetic groups were mixed and accommodated in the same cow house for the dry period and grouped according to expected calving date. Actual calving dates were equally distributed between groups. While indoors, all cows were fed grass silage ad libitum (approximately 1.0 ton dry matter (DM) per cow). All cows were turned out to pasture during the day from January 23, and day and night from March 21 onwards. At calving, cows were randomised within genetic group and equally allocated to one of two feed systems in a rotational pasture-based production system.
Pluriparous animals were blocked (two animals per block) based on calving date, bodyweight and previous lactation milk production within genetic group and then randomly allocated to one of two grass-based feeding systems. Pre-experimental milk production (i.e. milk yield in the first 4 weeks of lactation) and calving date were used to block primiparous animals and they were subsequently randomly assigned to feeding system. Pre-calving mean (s.e.) body weights and body condition scores were 652.4 (13.1), 3.28 (0.036); 649.9 (14), 3.25 (0.039); and 608.3 (11.9) kg, 3.31 (0.042) for the High-NA, Low-NA and High-NZ groups, respectively. A separate farmlet was allocated for each feed system. Therefore, each feeding system was applied immediately post partum to all pluriparous animals and after 4 weeks of pre-experimental milk production for primiparous animals during which they were offered 6.6 kg concentrate/day and pasture ad libitum.
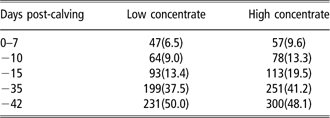
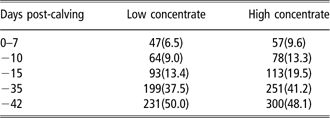
A description of the feed systems is provided elsewhere (Olmos et al., Reference Olmos, Boyle, Horan, Berry, O’Connor, Mee and Hanlon2008). In summary, the animals were allocated: (1) a high grass allowance with a low concentrate input typical of spring calving herds in Ireland (control) and (2) a 30% higher concentrate input, high stocking rate grass-based feeding system. Table 2 gives the average concentrate level per feed system during the period of the study. A separate farmlet was allocated for each feed system. All animals, regardless of feed system, grazed to a similar post-grazing sward surface height (5.5 cm). As a preventive measure against hypocalcaemia, all animals were administered a bolus containing 43 g of calcium (Bovikalc®; Boehringer Ingelheim Danmark A/S, Copenhagen, Denmark) at the first milking after calving.
Total concentrate input per cow for feed systems (kg (s.d.)) for pluriparous cows
Measurements
Haematological parameters and acute phase proteins
Blood samples were taken from all animals at −24 (s.d. 11.5), 3 (s.d. 2.2) and 35 (s.d. 3.8) days relative to calving, representing three time-points: pre-calving, calving and post-calving, respectively. Two samples were taken per sample point per animal. One set of samples was collected into 7 ml sterile glass tubes with K3 EDTA (Vacutainer™; Unitech Ltd, Dublin, Ireland). These blood samples were analysed for total red blood cells (RBCs), mean corpuscular volume (MCV), haemoglobin (Hb), mean corpuscular haemoglobin concentration (MCHC), mean corpuscular haemoglobin (MCH), platelet number, white blood cells (WBCs) count as well as WBC differential including neutrophil (mature), lymphocyte, monocyte and eosinophil counts. These analyses were carried out using an automated electronic particle analyser (Abbott Cell Dyn 3500; CD 3500, Haematology analyzer; Abbott Laboratories, Abbott Park, Illinois, USA) at the Irish Equine Centre laboratories (Johnstown, Naas, Co. Kildare, Ireland) on the same day as the blood samples were collected.
The second blood sample was collected into 7 ml lithium heparinised glass tubes (Vacutainer™). Immediately after collection, samples were centrifuged at 2000 × g for 10 min at 5°C. Plasma samples were stored at −20°C until analysed for two acute phase proteins: haptoglobin (Hp) and serum amyloid A (SAA). Plasma Hp concentrations were determined using a commercially available kit (Phase™ Range; Tridelta Development Ltd, Maynooth, Co. Kildare, Ireland). This kit is based on the ability of Hp to combine with Hb to form the complex HpHb. At low pH, the complex HpHb preserves the peroxidise activity of the bound Hb, which is directly proportional to the amount of Hp present in the specimen. The minimum detectable concentration of the assay was 0.05 g/l. The intra- and inter-assay CVs based on controls were <2.5% and <3.0%, respectively. The SAA plasma concentrations were determined using a commercially available solid phase enzyme-linked immunosorbent assay (ELISA; Tridelta Development Ltd, Maynooth, Co. Kildare, Ireland). The minimum detectable concentration of SAA was 0.3 mg/l. The intra- and inter-assay CVs based on controls were <3.0% and <5.6%, respectively.
Rectal temperature
Rectal temperature (RT) was recorded using a single digital thermometer (GLA Agricultural Electronics, San Luis Obispo, CA, USA; reading accuracy 0.1°C; temperature range −0.3°C to 65°C). The RT was recorded daily during morning milking from the first morning after calving (day 1) until 10 days post-calving. The daily RT of each cow was classified as normal (<39.5°C) or pyrexial (⩾39.5°C).
Calving difficulty and stillbirth
Calving difficulty was scored as (1) normal, (2) slight difficulty, (3) considerable difficulty, (4) veterinary assisted or (5) caesarean section. Calf mortality was recorded as alive (coded = 0) or dead at birth (i.e. stillbirths, coded = 1). The occurrence of twins and the weight of the calf at birth were also recorded.
Reproductive tract parameters
The reproductive tract of each cow was examined using trans-rectal ultrasound imaging (ALOKA SSD 500 V with a 5 MHz transducer; ALOKA Ltd, Tokyo, Japan) at 35 (s.d. 6) days post-calving. Each animal was assessed for the presence (yes = 1, no = 0) and severity of endometritis [0 = involuted uterus with no fluid, 1 = small volume of mixed echogenicity (grey or white) fluid in a spoke-wheel=shaped lumen with infolding of the endometrium and enlarged centre, ⩾2 = moderate or large volume of mixed echogenicity (grey or white) fluid in a stellate or circular distended lumen, (Mee et al., 2009)] and the resumption (yes = 1, no = 0) of ovarian cyclicity [i.e. presence of a corpus luteum in either ovary or uterine tone, clear mucus and a post-ovulatory follicle in either ovary (Mee et al., Reference Mee, Buckley, Ryan and Dillon2009)].
Somatic cell counts
Somatic cell count (SCC) was determined from morning milk samples once weekly from individual cows. The SCC was recorded using a flow-cytometer (Bentley 3000; Bentley Instruments Incorporated, Chaska, Minnesota, USA). Milk samples were heated to 40°C, to disperse the fat, prior to aliquot sampling by the flow-cytometer whereupon the milk cells were stained with ethidium bromide. Sampling started the second week after calving. On average, five samples were taken from each cow over the first 42 days post-calving.
Intra-mammary infections at calving and clinical mastitis
A milk sample was collected at calving from each quarter of each cow (quarter-case) in an aseptic manner and deposited into individual, sterile plastic containers after drawing of foremilk. These samples were sent to the laboratory for analysis, which included a semi-quantitative test, the ‘California mastitis test’ (CMT score: 0 = negative, 1 = trace, 2 = distinct precipitation with no gel, 3 = mixture thickens immediately, 4 = gel forms on surface, with CMT score ⩾2 indicating clinical mastitis (CM)) as well as the determination of presence (yes/no), quantity (0, 1–50, 51–100 and >100 cfu/μl) and type of bacteria (i.e. contagious (yes/no: presence/absence of Streptococcus agalactiae, Staphylococcus aureus and Staphylococcus epidermidis, Corynebacterium bovis or Mycoplasma) and/or environmental (yes/no: presence/absence of Escherichia coli, Klebsiella, Serratia, Pseudomonas, Proteus, Enterobacter spp., Streptococcus uberis, Streptococcus dysgalactiae) (Fox and Gay, Reference Fox and Gay1993, Smith and Hogan, Reference Smith and Hogan1993)) in each quarter sample.
The existence of CM throughout the study was monitored when cows were fore-stripped prior to morning and evening milking. The presence of milk clots, redness, soreness and/or inflammation in at least one quarter was defined as a case of CM. On identification of a case of CM in any quarter, a sample of milk from the individual quarter was aseptically taken and sent to the laboratory, where the tests outlined above were carried out. The probability of a cow getting CM in any quarter (cow-case) from day 0 to 42 post-calving was defined as a binary variable (yes/no) as well as the presence of bacteria in the sample and type of bacteria isolated (contagious (yes/no) or environmental (yes/no)).
Statistical analysis
Analysis of continuous data
Haematological parameters, concentrations of acute phase proteins, RT and SCC were classified as continuous variables. As both immature neutrophils and basophils were recorded in highly variable and low numbers and not consistently at each sampling point pre- and post-calving, neither count was statistically analysed. All variables were tested for normality both visually and analytically using the univariate procedure in SAS (Version 9.1); when a variable was not normally distributed, the Box–Cox methodology was used to identify the most appropriate transformation. The analyses were undertaken on the transformed, normally distributed data and back-transformed results are presented. This approach was used for all variables except SCC. For SCC, the natural logarithm transformation was used to approach normality. The transformed variable is referred to as somatic cell score (SCS).
The effect of genetic group on the continuous variables was determined using mixed models (PROC MIXED), with time (i.e. sampling point relative to calving) included as a repeated effect within cow. The most appropriate covariance structure among records within cow was determined using the Akaike Information Criterion for all the models. Fixed effects tested in the model were as follows: genetic group, parity, time relative to calving and time relative to calving by genetic group interaction with cow as a random effect. Individual cow concentrate input in the peripartum period was included as a covariate to account for possible feed system differences. Other covariates considered for inclusion in the model were calving date and sampling date centred within average sample point, to account for variability within each blood sampling point relative to calving. Only factors significantly (P < 0.05) affecting the dependent variable were retained in the models, except for genetic group and parity, which were forced into all models. Biologically plausible two-way interactions were also tested for significance in the model.
Analysis of binary and ordinal data
The occurrence of pyrexia from day 0 to 10 post-calving, stillbirth, reproductive tract parameters (i.e. presence of endometritis and resumption of ovarian cyclicity), presence and type of bacteria (no bacteria v. contagious bacteria and no bacteria v. environmental bacteria) and CM were classified as binary variables. The logit of the probability of a positive outcome for these variables was evaluated using logistic regression (PROC GENMOD) when only one record per animal was present; however, when repeated records were present generalised estimating equations (GEE) in PROC GENMOD were used. In both cases, genetic group and parity were included as factors in the model and calving day of the year was included as a covariate. Service sire (i.e. sire of the calf) predicted transmitted ability for direct perinatal mortality was also included as a covariate when the dependent variable was stillbirth. For the reproductive tract parameters and CM, the individual concentrate input in the peripartum period was included in the model. All biologically plausible interactions were also tested in the models. Only factors significantly (P < 0.05) affecting the model were retained, except genetic group and parity, which were forced into all models.
Calving difficulty score, severity of endometritis, CMT score and bacterial counts were treated as ordinal outcomes. For such variables preliminary tests were carried out to determine whether the odds across different threshold values were proportional for the different genetic groups. In the case of CMT and bacterial count, the assumption was true and the variables were analysed by ordinal regression in PROC GENMOD with a cumulative link function assuming a multinomial distribution. Decisions on fixed effects to be included in the model were as described previously. Calving difficulty failed the assumption of the proportionality of odds. Therefore, the data were rearranged as a binary outcome (0 = normal or slight difficulty, 1 = considerable difficulty or greater) and analysed as previously described, including service sire predicted transmitting ability for direct calving difficulty as a covariate.
The results of binary and ordinal variables are presented as odds ratios, calculated as the exponent of the model solutions. The odds ratio is an estimation of the likelihood of the event occurring (e.g. presenting endometritis at 35 days post-calving or presenting CMT > 0) in the exposed group v. a reference group or class. In all instances the LOW-NA was the reference class for the genetic group. Therefore an odds ratio of 1 indicates that the likelihood of endometritis (e.g. binary outcome) or having a CMT > 0 (e.g. ordinal outcome) is equal in both groups. However, an odds ratio greater than 1 indicates a greater likelihood of endometritis or having a CMT > 0 compared to the reference class.
Grass allowance across feed systems was not different, but some differences in the concentrate input existed. Thus, for variables evaluated ⩾35 days post-calving, differences in concentrate input due to feed system were accounted for by including in the model a covariate of the individual concentrate input of each cow up to day 35 post-calving.
Results
Haematological parameters and acute phase proteins
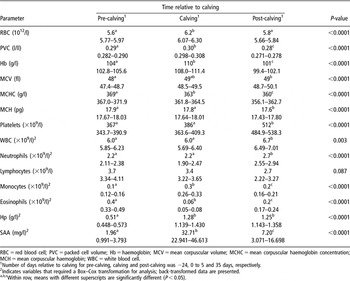
Sample point means for the haematological parameters and acute phase proteins are presented in Table 3. Sample point relative to calving (i.e. time) had a significant effect on all the haematological parameters and acute phase proteins, with the exception of lymphocyte counts (Table 3). For RBC, Hb, PCV, MCV, monocytes, Hp and SAA the highest point was at calving (i.e. 0–5 days post-calving) while eosinophils were lowest at calving. Platelets, WBC and neutrophils were at their highest values post-calving (i.e. 31 to 39 days post-calving).
Effect of time relative to calving (mean, 95% CI) for haematological parameters and acute phase proteins (haptoglobin (Hp) and serum amyloid A (SAA)) in a herd of 126 spring-calving Holstein–Friesians

RBC = red blood cell; PVC = packed cell volume; Hb = haemoglobin; MCV = mean corpuscular volume; MCHC = mean corpuscular haemoglobin concentration; MCH = mean corpuscular haemoglobin; WBC = white blood cell.
1Number of days relative to calving for pre-calving, calving and post-calving was −24, 0 to 5 and 35 days, respectively.
2Indicates variables that required a Box–Cox transformation for analysis; back-transformed data are presented.
a,b,cWithin row, means with different superscripts are significantly different (P < 0.05).
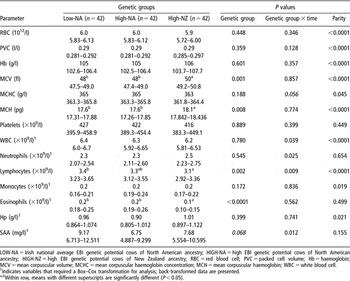
Results on the effects of genetic group and time interactions for these variables are presented in Table 4. In summary, genetic group had an effect (P < 0.05) on MCV, MCH, lymphocytes and eosinophils. For MCV and MCH, the HIGH-NZ animals had the highest values, whereas for lymphocytes and eosinophils they had lowest values compared to animals in the other two groups. Moreover, the LOW-NA animals tended (P < 0.10) to have a higher SAA concentration compared to the HIGH-NZ and HIGH-NA animals.
Effect of genetic group of Holstein–Friesian, genetic group × time relative to calving interaction and parity (mean, 95% CI) on peripartum haematological parameters and acute phase proteins (serum amyloid A (SAA) and haptoglobin (Hp))

LOW-NA = Irish national average EBI genetic potential cows of North American ancestry; HIGH-NA = high EBI genetic potential cows of North American ancestry; HIGH-NZ = high EBI genetic potential cows of New Zealand ancestry; RBC = red blood cell; PVC = packed cell volume; Hb = haemoglobin; MCV = mean corpuscular volume; MCHC = mean corpuscular haemoglobin concentration; MCH = mean corpuscular haemoglobin; WBC = white blood cell.
1Indicates variables that required a Box–Cox transformation for analysis; back-transformed data are presented.
a,bWithin row, means with different superscripts are significantly different (P < 0.05).
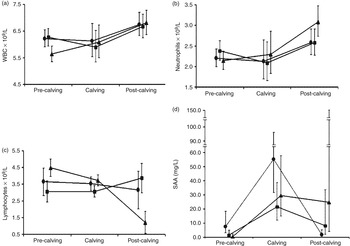
Genetic group × time interactions were significant (P < 0.05) for WBC (Figure 1a), neutrophil counts (Figure 1b), lymphocytes (Figure 1c) and SAA (Figure 1d). The HIGH-NZ animals had the lowest WBC counts pre-calving compared to the HIGH-NA and LOW-NA animals. However, WBC counts increased pre-calving to post-calving in the HIGH-NZ animals, whilst in the HIGH-NA and LOW-NA animals there was a minor depression in WBC counts at calving and a rise post-calving (Figure 1a). Similar dynamics were observed for the neutrophil counts, with the HIGH-NZ having the highest neutrophil counts post-calving compared to the HIGH-NA and LOW-NA animals (Figure 1b). In the case of lymphocytes, the HIGH-NZ animals had the highest lymphocyte counts pre-calving but the lowest counts post-calving. In contrast, the HIGH-NA animals had the lowest counts pre-calving but the highest counts post-calving (Figure 1c). The change in lymphocyte dynamics for LOW-NA animals was similar to the HIGH-NA animals. In the case of SAA, the LOW-NA animals differed from the HIGH-NZ animals in that they had the highest concentration of SAA pre-calving but the lowest concentration post-calving (Figure 1d). The HIGH-NA animals had a similar concentration of SAA to the HIGH-NZ animals. There was large variation in the 95% confidence interval between groups and sampling time relative to calving, in particular post-calving (Figure 1d).
Significant (P < 0.05) peripartum interactions in (a) WBC, (b) neutrophil counts, (c) lymphocyte counts and (d) SAA for three genetic groups (LOW-NA (-●-), HIGH-NA (-▪-) and HIGH-NZ (-▴-)) of Holstein–Friesian presented as least-square means and 95% CI at three times points relative to calving.

Post-partum concentrate input had no effect on any parameter and there were no significant interactions with genetic group (data not shown). The mean values for RBC, PVC, Hb, MCH, platelets, WBC, lymphocytes and monocytes were lower (P < 0.05) in pluriparous animals while mean values for the MCV, neutrophils (count and %), eosinophils (count and %) and Hp increased (P < 0.05) with parity, respectively (data not shown).
Rectal temperature
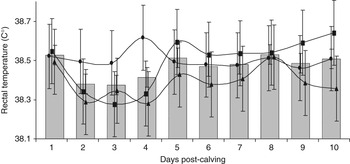
The average RT for the herd in the first 10 days post-calving was 38.5°C (s.d. = 0.58) although it differed with days post-calving (Figure 2). Pyrexia (i.e. temperature ⩾39.5°C) was present at least once in the first 10 days post-calving in 34% of all cows (HIGH-NZ = 31%, HIGH-NA = 38% and LOW-NA = 33%; P > 0.05). Furthermore, the HIGH-NZ animals had a lower (38.4°C, s.e. = 0.04, P < 0.05) RT compared to animals in the HIGH-NA (38.5°C, s.e. = 0.04) and LOW-NA (38.5°C, s.e. = 0.04) genetic groups. No day × genetic group interaction was present (P > 0.05). The daily mean (s.e.) RT for each genetic group is also shown in Figure 2. Parity had an effect on the mean RT (P < 0.01) and the odds of pyrexia (P < 0.05); pluriparous animals had a higher mean RT (38.6°C, s.e. = 0.06 v. 38.4°C, s.e. = 0.04) and lower odds (0.17, 95% CI: 0.041 to 0.713) of pyrexia compared to primiparous animals.
Daily least square mean (±1 s.e.) rectal temperature (RT) for three genetic groups (LOW-NA (-●-), HIGH-NA (-▪-) and HIGH-NZ (-▴-)) of Holstein–Friesian in the first 10 days post-calving. Bars show the herd daily least-square mean (±1 s.e.) RT in the first 10 days post-calving.

Calving performance (calving difficulty, stillbirth and twins)
The overall incidence of calving difficulty with score ⩾3 (i.e. considerable difficulty or greater) and stillbirths was 32% and 5.6%, respectively. Neither genetic group nor parity had an effect on the odds of calving difficulty or stillbirth (P > 0.05). The rate of twins was 1.2% with only two sets of twins recorded in the HIGH-NZ genetic group.
Reproductive tract parameters (ovarian cyclicity and presence of endometritis)
In total, 58% of the animals had resumed ovarian cyclicity by day 35 post-calving while 18% had endometritis at the same inspection with 5% of the animals receiving a severity score ⩾2. The percentage of animals that had resumed ovarian cyclicity at 35 days post-calving was HIGH-NZ = 55%, HIGH-NA = 65% and LOW-NA = 61% (P > 0.05). The percentage of animals with endometritis was HIGH-NZ = 21%, HIGH-NA = 17% and LOW-NA = 17% (P > 0.05) and the percentage of severity score ⩾2 was 3%, 2%, and 9%, respectively. Only two cases of follicular cysts were observed at the 35 days post-calving inspection, one each in the HIGH-NZ and HIGH-NA groups. Neither parity nor feed system had an effect on these parameters (data not shown).
Somatic cell score in the first 6 weeks post-calving
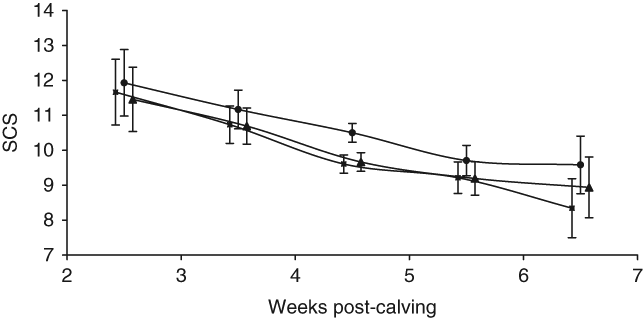
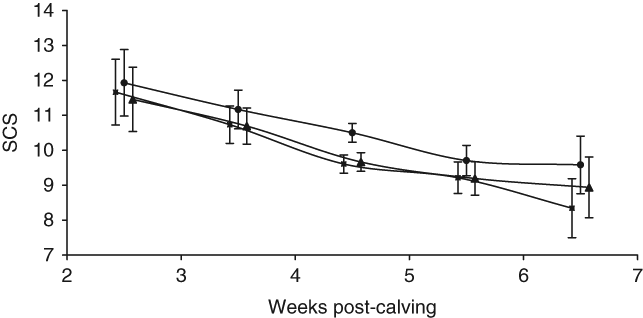
Mean SCS for the herd was 10.16 (s.e. = 0.220) for the first 6 weeks post-calving. The SCS decreased (P < 0.01) from 11.68 (s.e. = 0.913) in the second week to 8.96 (s.e. = 0.814) in the sixth week post-calving. The SCS had a strong tendency (P < 0.10) to differ between genetic groups; the HIGH-NA animals had the lowest SCS (9.91, s.e. = 0.210) compared to the HIGH-NZ (9.99, s.e. = 0.218) and LOW-NA (10.58, s.e. = 0.223) animals (Figure 3). Neither concentrate input nor parity had an effect on SCS (data not shown).
Weekly least-square mean (±1 s.e.) somatic cell score (SCS) of three genetic groups (LOW-NA (-●-), HIGH-NA (-▪-) and HIGH-NZ (-▴-)) of Holstein–Friesian.
Intra-mammary infections at calving
A score for CMT ⩾2 was present in 11% of the sampled udder quarters (i.e. quarter-case), but bacteria were isolated from only 8% (70% of the samples with a CMT ⩾2) of the sampled udder quarters. The bacteria isolated as a percentage of the samples were: S. aureus = 46%, S. epidermidis = 38.5%, S. uberis = 8%, E. coli = 5% and S. dysgalactie = 2.5%. Thus out of all samples, 7% had an intra-mammary infection due to contagious bacteria and 1% due to environmental bacteria. Only 1% of all samples had a bacterial count 1–50 cfu/μl, while 3% and 4% of the samples had a count of 51–100 and >100 cfu/μl, respectively.
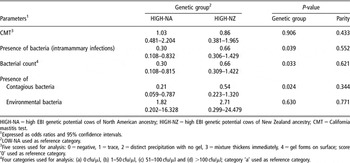
The effect of genetic merit on intra-mammary infections (IMI) at calving is summarised in Table 5. The percentage of all samples with a CMT ⩾ 2 was 11% and was equal across the genetic groups. Furthermore, the odds of a score >0 for the CMT did not differ across genetic groups. The presence of bacteria (yes/no) in the udder quarter samples and in consequence the presence of IMI were as follows: HIGH-NZ = 8%, HIGH-NA = 4% and LOW-NA = 12%. The odds for detecting bacteria and having an increased bacterial count were lower for the HIGH-NA animals (P < 0.05) compared to the LOW-NA animals (Table 5), but not different from HIGH-NZ animals.
Effect of genetic group of Holstein–Friesian and parity on the likelihood (95%CI) of intramammary infections on udder quarter samples at calving

HIGH-NA = high EBI genetic potential cows of North American ancestry; HIGH-NZ = high EBI genetic potential cows of New Zealand ancestry; CMT = California mastitis test.
1Expressed as odds ratios and 95% confidence intervals.
2LOW-NA used as reference category.
3Five scores used for analysis: 0 = negative, 1 = trace, 2 = distinct precipitation with no gel, 3 = mixture thickens immediately, 4 = gel forms on surface; score ‘0’ used as reference category.
4Four categories used for analysis: (a) 0 cfu/μl, (b) 1–50 cfu/μl, (c) 51–100 cfu/μl and (d) >100 cfu/μl; category ‘a’ used as reference category.
The detection rate of contagious bacteria in the sampled udder quarters was HIGH-NZ = 6%, HIGH-NA = 2.5% and LOW-NA = 11%, and the detection rate of environmental bacteria was HIGH-NZ = 2%, HIGH-NA = 1% and LOW-NA = 1%. The odds for detecting contagious bacteria were lower for the HIGH-NA animals (P < 0.05) compared to the LOW-NA animals, but not different for the HIGH-NZ animals. However, the odds for detecting environmental bacteria did not differ among the genetic groups. Parity had no effect on the odds of CMT score or on the presence, count and type of IMI at calving.
Clinical mastitis
The herd incidence of CM (cow-cases) was 21% (HIGH-NZ = 21%, HIGH-NA = 29% and LOW-NA = 14%) from day 0 to 42 post-calving. When analysed in the laboratory, only 67% of the collected samples (representing 14% of the cows) had a score ⩾2 for the CMT with bacteria isolated. Thus, the prevalence of IMI was HIGH-NZ = 14%, HIGH-NA = 19% and LOW-NA = 12%. The total cow-cases of CM with contagious bacteria were 4% (HIGH-NZ = 0%, HIGH-NA = 10% and LOW-NA = 5%) and with environmental bacteria were 10% (HIGH-NZ = 14%, HIGH-NA = 10% and LOW-NA = 7%). No effect of genetic group was found for the odds of presenting CM (Table 5). Furthermore, genetic group had no effect on the odds for CMT score or presence and type of bacteria.
Parity had an effect (P < 0.05) on the odds of detecting bacteria and the type of bacteria. Pluriparous cows had lower odds for presenting bacteria, especially environmental bacteria, than primiparous cows (data not shown). Concentrate level had no effect on any of the CM variables from day 0 to 42 post-calving (data not shown).
Discussion
Our aim was to investigate the influence of genetic groups differing in overall genetic merit (EBI value low v. high) and genetic background (NA v. NZ), on peripartum and early lactation haematological and acute phase proteins profiles, health and fertility. Genetic groups did indeed differ in certain immune and sub-clinical health indicators such as WBC re-distribution, RBC indices, SAA concentration, RT and SCS. Yet, no differences were observed in clinical health outcomes. There were differences in the type and number of bacteria isolated in milk samples at calving. The majority of the differences were found for the HIGH-NZ animals compared to the low and high EBI animals with an NA ancestry indicating genetic origin rather than level of genetic merit effects. Resistance and disease susceptibility (e.g. mastitis) or success in overcoming stressful events (e.g. calving) is dependent upon the challenge itself, with environment, inherent animal responsiveness and physiological status playing contributory roles (Mallard et al., Reference Mallard, Dekkers, Ireland, Leslie, Sharif, Vankampen, Wagter and Wilkie1998; Bannerman et al., Reference Bannerman, Paape, Lee, Zhao, Hope and Rainard2004; Feldman et al., Reference Feldman, Zinkl and Jain2006). The challenge (i.e. calving process and infectious agents) and the environment (i.e. farm, management and climatic conditions) were common to all genetic groups. Thus, it is argued that differences in peripartum responses were due to inherent animal characteristics. It is speculated that such mechanisms are a reflection of evolved adaptation processes to match environment and selection criteria. The breeding goals and production systems (confinement v. pasture-based) where the ancestors (NA v. NZ) of the genetic groups were selected differed greatly in terms of disease challenge, nutrition, climate and management strategies and goals; thus the genetic groups likely evolved dissimilar responsive strategies to successfully overcome the challenges associated with peripartum and early lactation.
The incidence of stillbirth and calving difficulty recorded in this study is similar to that recorded previously for similar production systems (Esslemont and Kossaibati, Reference Esslemont and Kossaibati2001; McCarthy et al., Reference McCarthy, Berry, Dillon, Rath and Horan2007a and Reference McCarthy, Berry, Dillon, Rath and Horan2007b). Likewise, reproductive tract health parameters (i.e. ovarian cyclicity and endometritis) were also representative of the current prevalence in Irish dairy herds (Mee et al., Reference Mee, Buckley, Ryan and Dillon2009).
Genetic group effect on WBC distribution peripartum and in early lactation
Genetic groups in the study had WBC counts within the normal international ranges (Feldman et al., Reference Feldman, Zinkl and Jain2006). The HIGH-NZ animals, however, had a different WBC profile from the HIGH-NA and LOW-NA animals. Their profile was consistent with an increase in WBC and an increase in neutrophils, with higher circulating neutrophil counts at calving than the other two groups. On the basis of this finding alone, HIGH-NZ cows could be expected to display increased resistance to disease, assuming that the increased counts were accompanied by increased cell activity, e.g. phagocytosis, oxidative burst and secretion of inflammatory mediators, which were not evaluated in this study. However, the HIGH-NZ cows, in contrast to HIGH-NA and LOW-NA cows, showed low levels of lymphocytes post-calving. Paradoxically, this profile is indicative of stress, a greater risk of mastitis, metabolic diseases and reproductive tract disorders (Harp et al., Reference Harp, Kehrli, Hurley, Wilson and Boone1991; Van Kampen and Mallard, Reference Van Kampen and Mallard1997; Mallard et al., Reference Mallard, Dekkers, Ireland, Leslie, Sharif, Vankampen, Wagter and Wilkie1998). Peripartum stress also results in a reduction of eosinophils (Feldman et al., Reference Feldman, Zinkl and Jain2006) yet the reduction was greater in the HIGH-NZ animals compared to the HIGH-NA and LOW-NA animals, again highlighting an alternative immune response strategy in the HIGH-NZ cows. The reported differences among genetic groups in leucocyte profiles might not be considered of practical significance to a veterinary clinician. However, the robust statistical analyses support a possible phylogenetic significance; HIGH-NZ cows have developed a mechanism of WBC re-distribution peripartum and in early lactation differing from the more conventional profiles (Cai et al., Reference Cai, Weston, Lund, Brodie, McKenna and Wagner1994; Detilleux et al., Reference Detilleux, Kehrli, Stabel, Freeman and Kelley1995; Klinkon and Zadnik, Reference Klinkon and Zadnik1999), which were seen in the HIGH-NA and LOW-NA groups.
Given the fact that the health status across the genetic groups was comparable, the unconventional distribution pattern of WBCs displayed by the HIGH-NZ cows must provide comparable protection against disease. The WBC profile reported for the HIGH-NZ cows in the peripartum period and in early lactation has not been previously reported. Nevertheless, similar mechanisms have been reported in genetically different groups of sheep where antibody production decreased in the genetic group displaying superior daily weight gain (Sayers et al., Reference Sayers, Good, Hanrahan, O’Donovan, Mulcahy and Sweeney2007). Furthermore, Patton et al. (Reference Patton, Murphy, O’Mara and Butler2008) reported that NZ animals partition more nutrients towards body reserves earlier post-calving than the NA animals, indicating a divergent feed efficiency by the NZ animals. Thus, the differences reported for the HIGH-NZ group may indicate a function of adaptive changes evolved in NZ cows that help them to save energy in the peripartum and early lactation periods.
Genetic group effect on RBC indices peripartum and in early lactation
The entire herd presented the expected periparturient transient reticulocyte response (i.e. an increase in MCV and a reduction in MCHC) due to the effect of calving blood loss and haematopoietic hormonal effect (Feldman et al., Reference Feldman, Zinkl and Jain2006). However, regardless of peripartum sample point, the HIGH-NZ group consistently displayed greater MCV and MCH values, presumably due to a higher turnover in erythrocytes than that of cows with NA ancestry. This finding is previously unreported in Holstein–Friesian dairy cattle but has been reported in beef cattle breeds, greyhounds and thoroughbred horses (Feldman et al., Reference Feldman, Zinkl and Jain2006). The reported difference in MCV (i.e. 1 fl) between genetic groups reported in this study is similar to those found in previous reports comparing genetic groups (Richardson et al., Reference Richardson, Herd, Colditz, Archer and Arthur2002) and breeds (Feldman et al., Reference Feldman, Zinkl and Jain2006) of beef cattle.
Comparative studies have demonstrated that RBC lifespan correlates with body size, metabolic rate and oxidative stress. Small animals have a higher metabolic rate, greater cumulative oxidative stress and shorter erythrocyte lifespan. This shorter lifespan leads to an increased reticulocyte response (Feldman et al., Reference Feldman, Zinkl and Jain2006). Parallel studies in the same genetic groups as studied here reported that HIGH-NZ animals are lighter (i.e. small body size) compared to HIGH-NA and LOW-NA, yet have a similar milk solids yield per cow (Coleman et al., Reference Coleman, Horan, Berry, Brennan and Pierce2008a and Reference Coleman, Horan, Berry, Brennan and Pierce2008b). As a result, HIGH-NZ cows have a higher metabolic demand (i.e. oxidative stress) since they produce more milk solids per kg weight compared to HIGH-NA and LOW-NA cows. As the physical and metabolic requirements of the cow increase at the commencement of lactation, oxygen demand also increases (Blake et al., Reference Blake, Olsen, Walters and Lamb1982; Reynolds et al., Reference Reynolds, Huntington, Tyrrell and Reynolds1988; Drackley, Reference Drackley1999). Thus the increased reticulocyte turnover in HIGH-NZ cows may indicate an adaptive strategy to cope with an increased metabolic rate due to a comparatively larger milk solids production level and increased peripartum metabolic demand. This could be indicative of animals adapting rapidly to be more efficient in a pasture-based system.
Genetic group effect on udder health indicators and SAA concentrations in the peripartum and early lactation periods
The CM (quarter-case and cow-case) and SCS values recorded in the present study are similar to those previously recorded in comparable production systems (Esslemont and Kossaibati, Reference Esslemont and Kossaibati2001; McCarthy et al., Reference McCarthy, Berry, Dillon, Rath and Horan2007a and Reference McCarthy, Berry, Dillon, Rath and Horan2007b). However, differences were recorded across genetic groups. The LOW-NA animals tended to have the highest SCS; the HIGH-NA cows had the lowest likelihood of high bacterial counts, specifically for contagious bacteria (e.g. S. aureus) at calving. Nevertheless, no differences were found in the clinical cases of mastitis in the first 42 days in milk. Additionally, temporal differences in the concentrations of SAA were found between genetic groups, where the LOW-NA animals had the highest SAA concentrations. The large variation (95%CI) in SAA values at and post-calving (Figure 1d) reflects individual cows with CM. An increase in SAA in the plasma and/or milk is part of the acute phase response of the animal at calving or during a disease challenge and is a good indicator of IMI (Bannerman et al., Reference Bannerman, Paape, Lee, Zhao, Hope and Rainard2004; O’Mahony et al., Reference O’Mahony, Healy, Harte, Walshe, Torgerson and Doherty2006). Bannerman et al. (Reference Bannerman, Kauf, Paape, Springer and Goff2008) reported small temporal breed differences (Jersey v. Holstein–Friesian) in the onset, duration and cessation of SAA response. It is difficult to identify whether the presence of an intra-mammary infection elicits an acute phase response causing the alteration of the immunological parameters, or whether it is the individual cow’s immunological capabilities that modify susceptibility to mastitis (Kelm et al., Reference Kelm, Detilleux, Freeman, Kehrli, Dietz, Fox, Butler, Kasckovics and Kelley1997; Bannerman et al., Reference Bannerman, Paape, Lee, Zhao, Hope and Rainard2004 and Reference Bannerman, Kauf, Paape, Springer and Goff2008). It has been demonstrated that bacteria type (e.g. E. coli v. S. aureus), bacteria number and host immunocompetence elicit differing innate immune responses (Bannerman et al., Reference Bannerman, Paape, Lee, Zhao, Hope and Rainard2004 and Reference Bannerman, Kauf, Paape, Springer and Goff2008). All groups were managed under similar circumstances in the present study. Hence the bacterial challenge should have been similar. Thus, differences observed in this study are likely to be due to genetic group. McCarthy et al. (Reference McCarthy, Berry, Dillon, Rath and Horan2007a) suggested that phenotypic differences in udder conformation between NA and NZ Holstein–Friesians may have contributed to the differences in SCS and CM observed in their study. Thus, the quantitative and qualitative bacterial differences between genetic groups reported in this study, as well as SCS are a reflection of possible phenotypic differences in udder conformation in addition to differences in the innate immune system (i.e. WBC differential and WBC functionality) and acute phase response (e.g. SAA concentrations).
Genetic group effect on rectal temperature
The mean RTs recorded in this study are in the lower normal range (Radostits et al., Reference Radostits, Gay, Hinchcliff and Constable2007). This is probably due to the early morning recordings of RT (ambient temperature range −3 to +5°C), reflecting the normal diurnal fluctuation in body temperature of cows (Baracos et al., Reference Baracos, Whitmore and Gale1987; Kluger, Reference Kluger1991), with the lowest temperature occurring in the morning (Radostits et al., Reference Radostits, Gay, Hinchcliff and Constable2007).
The genetic groups did not differ in the likelihood of pyrexia in the first 10 days post-calving nor was there a day by genetic group interaction. The results do, however, show that HIGH-NZ animals had a lower average RT compared to the NA animals, regardless of their health status (similar) or time post-calving. Temperature differences could be explained as sub-clinical differences in immunological patterns, as previously discussed or as differences in thermoregulatory capabilities. Breed differences in cow RT (i.e. Bos indicus v. Bos taurus) were attributed to improved thermoregulatory capabilities based on differing environmental conditions during rearing (Carvalho et al., Reference Carvalho, Lammoglia, Simoes and Randel1995; Radostits et al., Reference Radostits, Gay, Hinchcliff and Constable2007). Low environmental temperatures cause a reduction in thermoregulation, thus reducing core body temperature (Baracos et al., Reference Baracos, Whitmore and Gale1987; Kluger, Reference Kluger1991). In pasture-based systems the ambient temperature fluctuates more than in confinement systems. These environmental differences could have affected the core body temperatures of animals in each genetic group in this study and thus the RT readings. Based on normal bovine temperature ranges (Radostits et al., Reference Radostits, Gay, Hinchcliff and Constable2007), the HIGH-NZ low mean temperature suggests an altered thermoregulatory process in these animals; instead of expending energy resources on strict thermoregulation, they have adapted to a lower temperature set-point (Baracos et al., Reference Baracos, Whitmore and Gale1987; Kluger, Reference Kluger1991). This would reduce the threshold at which thermoregulatory mechanisms need to be engaged, thereby improving the balance between heat loss and heat gain, which is consistent with a more energy-efficient thermoregulation system necessary for a pasture-based environment.
Parity effects
Parity (i.e. age) had an effect on most of the haematological parameters across genetic groups. Such differences have been reported previously and are explained as an effect of the ongoing maturation process on the erythrocyte and immune system in addition to the challenge differences between primiparous and pluriparous cows (Klinkon and Zadnik, Reference Klinkon and Zadnik1999; Mehrzard et al., Reference Mehrzard, Duchateau, Pyörälä and Burvenich2002; Feldman et al., Reference Feldman, Zinkl and Jain2006).
Conclusion
This study is novel in reporting differences in selected health indicators between Holstein–Friesian genetic groups in a pasture-based system. It is proposed that HIGH-NZ cows have inherited a different peripartum coping strategy (i.e. atypical WBC peripartum re-distribution, increased reticulocyte response, lower temperature set-point) yet display similar disease outcomes to HIGH-NA and LOW-NA genetic groups. LOW-NA cows tended to have higher SCS and more mastitis at calving compared with the HIGH-NA group. This indicates that selection in contrasting environments (pasture v. confinement), coupled with EBI ranking play a role in the expression of different physiological mechanisms peripartum and in early lactation.
Acknowledgments
We thank the staff of Curtins farm for their co-operation, care and management of the experimental animals. We acknowledge Tommy Condon for his great support in the collection of data and Prof. Peter O’Brien (UCD), Prof. Sean Arkins (University of Limerick), Dr Sara Llamas-Moya (Teagasc, Moorepark), Dr Keelin O’Driscoll (Cambridge University) and Dr Bernadette Early (Teagasc, Grange) for their useful discussions and comments on this manuscript.