Implications
Sheep during late gestation often suffer from negative energy balance, which might trigger body fat mobilization and modulate metabolic pathways, leading to lipid metabolism disorder and pregnancy toxemia (PT). The present study established the pathological model of PT by feed restriction and evaluated the alteration of lipid metabolism-associated pathways in livers of PT ewes. This is the first report to illustrate the molecular mechanisms of lipid metabolism disorder in livers of ewes with PT, which may provide a theoretical basis for novel therapeutic methods of PT.
Introduction
Morbidity of PT approximately ranges from 5% to 20%, and mortality can reach 80% in untreated animals (Rook and Herdt, Reference Rook and Herdt2000), resulting in a significant economic loss (Lima et al., Reference Lima, Pascoal and Stilwell2012). Pregnancy toxemia is the most common metabolic disease for ewes during late gestation, when insufficient energy intake due to the extruded abdomen is unable to meet the increased energy demands of fetuses. Negative energy balance can trigger body fat mobilization and prompt ketone body production and hepatic lipidosis. Thus, PT is characterized by elevated blood β-hydroxybutyrate (BHBA) (Firat and Ozpinar, Reference Firat and Ozpinar2002; Ismail et al., Reference Ismail, Almajali, Amireh and Alrawashdeh2008) and non-esterified fatty acids (NEFAs) (Lacetera et al., Reference Lacetera, Bernabucci, Ronchi and Nardone2001; Calpereyra et al., Reference Calpereyra, Borteiro, Benech, Rodas, Abreu, Cruz and Gonzálezmontaña2009 and Reference Calpereyra, Benech, Gonzálezmontaña, Acostadibarrat, Da and Martín2015) as well as accumulated hepatic triglyceride (Calpereyra et al., Reference Calpereyra, Borteiro, Benech, Rodas, Abreu, Cruz and Gonzálezmontaña2009; Wang et al., Reference Wang, Enzhong and Wang2014). However, to the best of our knowledge, information on the molecular mechanisms underlying lipid metabolism disturbance and the contribution of this to the pathogenesis of PT remains unclear.
We hypothesize that negative energy balance may alter the expression of key enzyme genes involved in fatty acid oxidation (FAO), acetyl-CoA metabolism (ACM) and triglyceride synthesis (TGS), then cause the disorder of lipid metabolism in the liver, resulting in PT of ewes. Therefore, the objective of the present study was to explore pathways including FAO, ACM and TGS in livers of PT ewes, and to clarify the underlying molecular mechanisms of lipid metabolism disorder.
Material and methods
Animals, diets and treatment
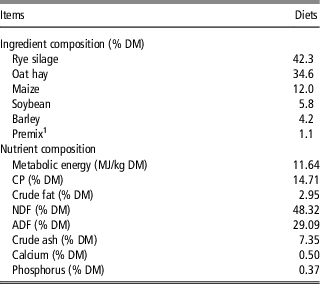
In all, 20 purebred Hu sheep (BW 60.6±4.9 kg) carrying multiple fetuses with similar body condition scores (3.0 to 3.5 on a 1 to 5 scale) and similar parity (2 to 3 parity) and gestating for 108 days were enrolled in this study. All ewes were fed ad libitum in individual pens for a 7-day adaption period. After that, these ewes were assigned to two groups (10 ewes in each group) randomly at 115 days of gestation (considered as day 0 of the experimental period). Ewes in the control (CON) group were fed normally (1.56 kg total mixed ration, dry matter basis; according to the feed intake calculated in adaption period), whereas ewes in the treated (TR) group were subjected to a 70% level feed restriction (0.47 kg total mixed ration, dry matter basis) for 15 days, with free access to water. Ingredients and nutritional compositions of the total mixed ration are presented in Table 1.
Ingredients and nutrient composition of the experimental diets for pregnant sheep (Ovis aries) in this study

DM=dry matter basis.
1 The premix (per kg) contained: vitamin A 64.8 mg, vitamin D2 1.35 mg, vitamin E 1080 mg, nicotinic acid 353 mg, Mn 537 mg, Cu 540 mg, Zn 2422 mg, Co 7.2 mg, I 32 mg, Se 18 mg, P 66 g, Ca 130 g, NaHCO3 89 g and NaCl 140~180 g.
Samples collection
Blood samples were collected from the jugular vein every 5 days before morning feeding at days 0, 5, 10 and 15. After 15 days of treatment, all ewes were sacrificed, and livers were separated and weighed to calculate the liver index (liver weight/BW). Then, hepatic samples of ewes in the CON group and TR group were all collected from the left lobes within 30 min. A part of each liver sample was stored in liquid nitrogen immediately to analyze the metabolites and the expression of genes, whereas another part was promptly fixed in either 4% paraformaldehyde or 2.5% glutaraldehyde to make hematoxylin–eosin staining sections or electron transmission microscopic sections, respectively.
Biochemical analysis
The BHBA level in the blood was determined using the Free Style Optium Blood Glucose and Ketone Monitoring System (Abbott Diabetes Care Ltd, Oxon, UK). Glucose, NEFA, cholesterol, triglyceride and glycerol levels in plasma as well as NEFA, BHBA, cholesterol, triglyceride, glycerol and protein contents in livers were all determined by commercially available kits (Jian-Cheng Bioengineering Institute, Nanjing, China) following the manufacturer’s instructions.
Microscopic study
Hepatic tissues were prepared for light microscopy histological analysis using methodology previously described by Odongo et al. (Reference Odongo, AlZahal, Lindinger, Duffield, Valdes, Terrell and McBride2006). In brief, 4% paraformaldehyde (Sigma, St. Louis, MO, USA)-fixed, paraffin-embedded specimens were sectioned at a 6-μm thickness, stained with hematoxylin–eosin and mounted for analysis. In addition, hepatic tissues were prepared for transmission electron microscope using methods reported by Graham and Simmons (Reference Graham and Simmons2005). Briefly, hepatic tissues were fixed in 2.5% glutaraldehyde immediately for 24 h, post-fixed for 1 h in 1% osmium, and then, dehydrated in ethanol solutions with different concentration gradients. Subsequently, the dehydrated specimens were transferred into a mixture of Spurr resin and acetone (1:1) for 30 min, followed by immersion in 100% resin for 10 h. Specimens containing resin were shifted to molds and polymerized at 40°C or 60°C for 48 h. Semithin sections (0.25 to 0.5 μm) were cut with a glass knife and stained with 1% toluidine blue-O in 1% sodium borate. Ultrathin sections (70 to 90 nm) were cut with a diamond knife, stained with methanolic uranyl acetate and lead citrate and finally observed and photographed using transmission electron microscope (Hitachi H-7650; Hitachi Technologies, Tokyo, Japan). The microscopist was blinded to treating methods between two groups during the microscopy histological analysis.
Ribonucleic acid extraction, purification and complementary DNA synthesis
Total RNA was extracted from frozen hepatic tissue samples (~100 mg for each sample) in the CON and TR groups using the TRIzol method (Takara Bio, Otsu, Japan), as described by Chomczynski and Sacchi (Reference Chomczynski and Sacchi1987). Ribonucleic acid yield was detected using the Nanodrop spectrophotometer ND-1000 UV-Vis (Thermo Fisher Scientific, Madison, WI, USA). The quality of RNA extracted was also verified by ensuring all RNA samples had an absorption ratio (A260/A280) between 1.8 and 2.0, and the integrity of RNA was checked using 1% agarose gel electrophoresis. All RNA solution samples were diluted to the same concentration (500 ng/µl). Total RNA (1 µg) was reverse transcribed to complementary DNA using a PrimeScript reverse transcription kit (Takara Bio, Otsu, Japan) according to the manufacturer’s instructions.
Quantitative real-time polymerase chain reaction
Primer 5 software (Whitehead Institute, Cambridge, MA, USA) and the BLAST computer program (National Center for Biotechnology Information, Bethesda, MD, USA) were utilized to design the primers used in the present study. All primers were synthesized by a commercial supplier (Invitrogen Life Technology, Shanghai, China). Details of the primer sets used for real-time PCR in the current study are listed in Supplementary Table S1. After reverse transcription, complementary DNA was quantified by using the QuantStudio 5 real-time PCR Instrument (Thermo Fisher Scientific, Waltham, MA, USA). The PCR mixture contained 2.0 µl of complementary DNA template, 0.4 µl of each primer (10 µM), 10 µl of SYBRR Premix Ex TaqTM (2*), 0.4 µl of ROX Reference Dye (50*) and PCR-grade sterile water to a final volume of 20 µl. The program for PCR amplification was as follows: 95°C for 30 s for pre-denaturation, and 40 cycles of 95°C for 5 s, 60°C for 34 s, followed by a melting curve program (60°C to 99°C with a ramping rate of 0.1°C/s and fluorescence measurement). A melting curve was generated for each sample to ensure the purity of PCR-amplified products. The relative messenger RNA (mRNA) expression level of each studied gene was normalized to β-actin (as a housekeeping gene), and the data were analyzed according to the
 $$2^{{{\minus}\Delta \Delta C_{t} }} $$
method (Livak and Schmittgen, Reference Livak and Schmittgen2001).
Statistical analysis
Statistical analyses were carried out by using the SPSS software package (SPSS version 19.0; SPSS Inc., Chicago, IL, USA). Data were presented as means with their standard errors. Statistical analyses of blood indicators were performed using the GLM for repeated-measures analysis procedure with Bonferroni’s post hoc testing. Univariate GLM covariance analysis, with Bonferroni adjustment, was used to test differences between groups, with the liver index, hepatic biochemical indicators and gene expression levels as the dependent factors, treatment variable as the fixed factor and BW change value as covariate. The Spearman’s correlation coefficients (r) of biochemical indicators between blood (day 15) and liver of the 20 sheep were calculated with bivariate correlation analysis. P-values <0.05 (two-sided) were considered statistically significant.
Results
Animal behavior description
Ewes in the CON group remained alert and active throughout the dietary treatment period. However, ewes in the TR group showed clinical signs of toxemia including anorexia, grinding teeth, languishment, hindlimb ataxia and locomotion disturbances.
Biochemical indicators in blood and liver
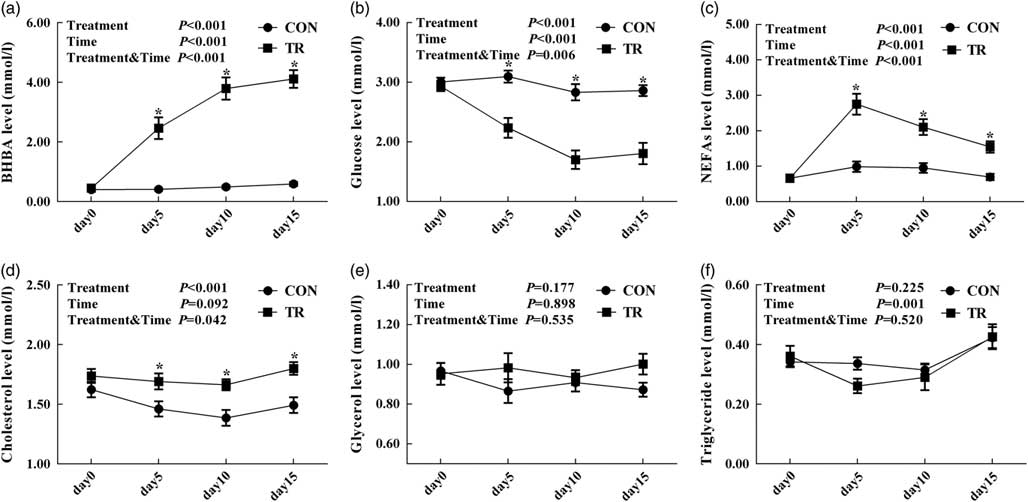
As shown in Figure 1, with the prolongation of feed restriction for ewes in the TR group, blood BHBA level increased whereas blood glucose level decreased, and blood NEFAs level increased at the outset and subsequently decreased. Main effects of treatments for the levels of blood BHBA (P<0.001), glucose (P<0.001), NEFAs (P<0.001) and cholesterol (P<0.001) were significant, whereas those for the levels of blood glycerol (P=0.177) and triglyceride (P=0.225) were nonsignificant. Blood BHBA levels (P<0.001, <0.001, <0.001), NEFAs levels (P=0.002, =0.002, <0.001) and cholesterol levels (P=0.042, =0.003, =0.003) at days 0, 10 and 15 of ewes in the TR group were significantly higher than those of the CON group, respectively. Blood glucose levels (P=0.005, =0.006, =0.002) at days 0, 10 and 15 of ewes in the TR group were significantly lower than those of the CON group, respectively.
Blood biochemical indicators of pregnant sheep in the control (CON, fed in normal level) and treated (TR, restricted to 30% level of feed intake) group. (a) β-hydroxybutyrate (BHBA) level. (b) Glucose level. (c) Non-esterified fatty acids (NEFAs) level. (d) Cholesterol level. (e) Glycerol level. (f) Triglyceride level. Values are means (n=10), with their standard errors represented by vertical bars. *Mean values with asterisks were significantly different between two groups (P<0.05, GLM for repeated-measures analysis procedure with Bonferroni’s post hoc testing).

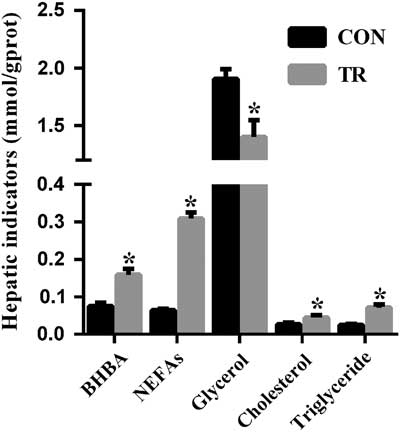
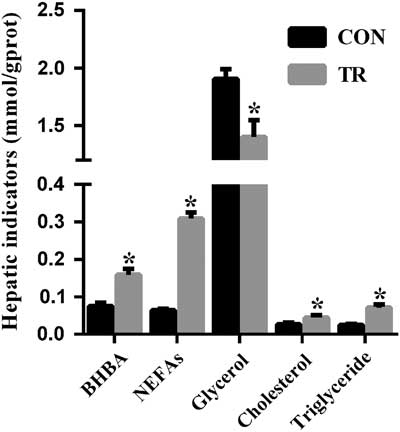
As shown in Figure 2, the contents of NEFAs (P<0.001), BHBA (P=0.001), cholesterol (P=0.033) and triglyceride (P<0.001) in livers of ewes upon feed restriction were higher compared with the CON group. Whereas, the content of hepatic glycerol in feed-restricted ewes was lower (P=0.035) than that of the CON group.
Hepatic biochemical indicators of pregnant sheep in the control (CON, fed in normal level) and treated (TR, restricted to 30% level of feed intake) group. Values are means (n=10), with their standard errors represented by vertical bars. *Mean values with asterisks were significantly different between two groups (P<0.05, univariate GLM covariance analysis with Bonferroni adjustment). BHBA=β-hydroxybutyrate; NEFAs=non-esterified fatty acids.
Histological changes of livers in pregnancy toxemia ewes
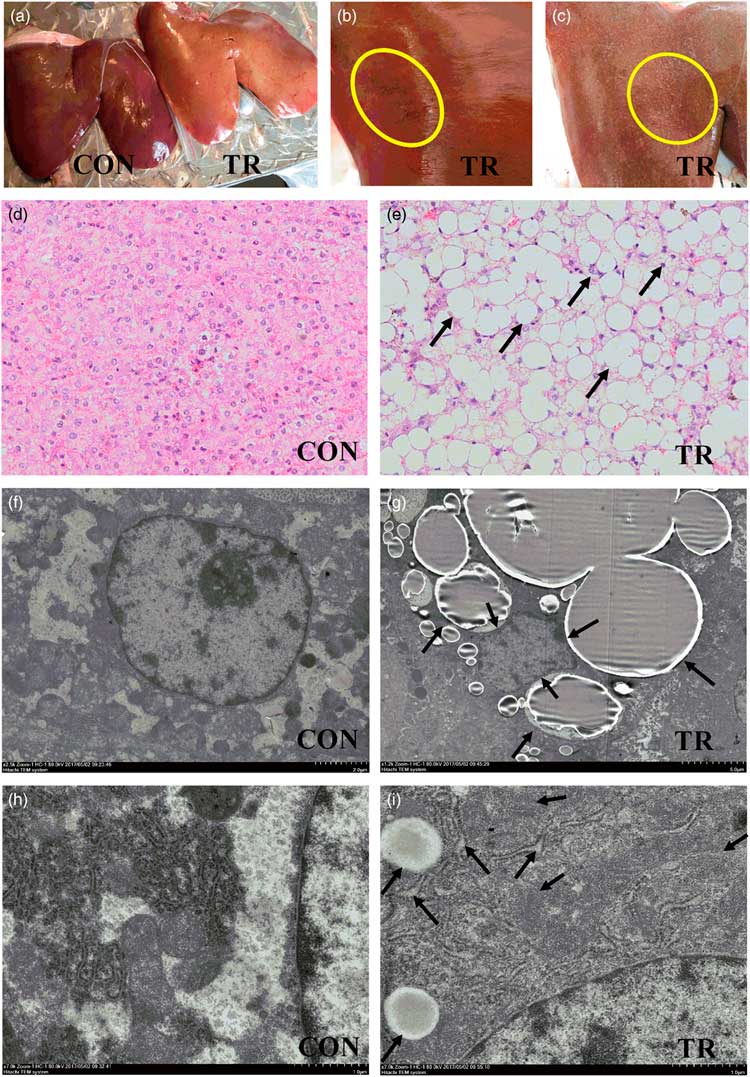
Visual inspection showed that livers in the CON group were deep red, soft and elastic whereas livers in the TR group were swollen, deep yellow and fragile (Figure 3a). Moreover, there were local hemorrhages and regional degeneration on the surface of livers in the TR group (Figure 3b and c). Hepatic tissues stained with hematoxylin–eosin exhibited red coloration, which made apparent to see a large amount of fat vacuoles being distributed in the TR group (Figure 3e), yet only a few lipid droplets had been observed in the CON group (Figure 3d). Results of transmission electron microscope further showed the morphology of nuclei (Figure 3f), endoplasmic reticulum (Figure 3h) and mitochondria (Figure 3h) was normal in hepatocytes of the CON group. However, in hepatocytes of the TR group, nuclei were extruded by fat vacuoles and lost their basic shapes (Figure 3g). Dilatation and vesiculation occurred in the endoplasmic reticulum of hepatocytes in the TR group, and many polyribosomes originally attached to the endoplasmic reticulum had desquamated (Figure 3i). The double-layer membrane structure and inner cristae structure of mitochondria had partly disappeared, making the appearance of swell and vacuolation (Figure 3i). In addition, the liver index of the TR group (1.49%) was significantly higher (P=0.004) than that of the CON group (1.15%).
(Color online) Hepatic visual inspection, microstructure analysis and ultrastructure analysis of pregnant sheep in the control (CON, fed in normal level) and treated (TR, restricted to 30% level of feed intake) group. (a–c) Visual inspection of livers in the two groups, indicated by deep red color for livers in the CON group but the deep yellow color (a), local hemorrhage (b) as well as regional degeneration (c) for livers in the TR group. (d, e) Hematoxylin–eosin staining of liver sections from the two groups, indicated by normal microstructure for livers in the CON group (d) but many fat vacuoles for livers in the TR group (e). (f–i) Transmission electron microscopic images of livers in two groups indicated normal nuclei (f), rough endoplasmic reticulum and mitochondria (h) for livers in the CON group, but extruded and shape-modified nuclei (g), dilated and vesiculated rough endoplasmic reticulum, as well as swollen and disaggregated mitochondria for livers in the TR group (i). Magnification ×200, 200, 2500, 1200, 7000 and 7000 was used from (d) to (i), respectively.

Fatty acid oxidation in liver
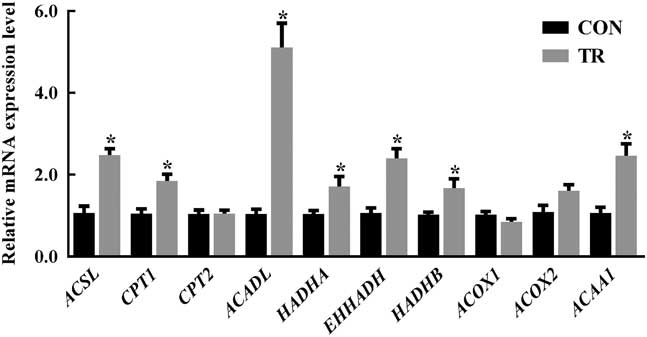
The expression levels of genes involved in FAO, including long-chain acyl-CoA synthase (ACSL) (P<0.001), carnitine palmitoyltransferase 1 (CPT1) (P=0.001), long-chain acyl-CoA dehydrogenase (ACADL) (P<0.001), hydroxy acyl-CoA dehydrogenase (P=0.002), enoyl-CoA hydratase (P<0.001), 3-ketoacyl-CoA thiolase (P=0.001) and acetyl-CoA acyltransferase 1 (P=0.002), in the TR group were higher than those of the CON group, respectively. Whereas, carnitine palmitoyltransferase 2 (P=0.505), acyl-CoA oxidation 1 (P=0.166) and acyl-CoA oxidation 2 (P=0.074) expression in the TR group were unchanged compared with the CON group (Figure 4).
Relative messenger RNA (mRNA) expression levels of genes related to fatty acid oxidation (FAO) in livers of pregnant sheep in the control (CON, fed in normal level) and treated (TR, restricted to 30% level of feed intake) group. Values are means (n=10), with their standard errors represented by vertical bars. *Mean values with asterisks were significantly different between two groups (P<0.05, univariate GLM covariance analysis with Bonferroni adjustment). ACSL=long-chain acyl-CoA synthase; CPT1=carnitine palmitoyltransferase 1; CPT2=carnitine palmitoyltransferase 2; ACADL=long-chain acyl-CoA dehydrogenase; HADHA=hydroxy acyl-CoA dehydrogenase; EHHADH=enoyl-CoA hydratase; HADHB=3-ketoacyl-CoA thiolase; ACOX1=acyl-CoA oxidation 1; ACOX2=acyl-CoA oxidation 2; ACAA1=acetyl-CoA acyltransferase 1.

Acetyl-CoA metabolism in liver
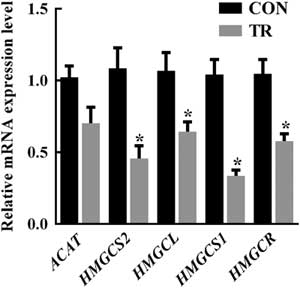
As the product of FAO, some acetyl-CoA will be incompletely oxidized to ketone bodies and cholesterol. The expression levels of genes involved in ketogenesis and cholesterol synthesis, including β-hydroxy-β-methylglutaryl CoA (HMG-CoA) synthase 2 (HMGCS2) (P=0.007), HMG-CoA lyase (P=0.020), HMG-CoA synthase 1 (HMGCS1) (P<0.001) and HMG-CoA reductase (HMGCR) (P=0.006), in the TR group, were lower than those of the CON group, respectively. Whereas, the expression level of acetyl-coA acyltransferase (P=0.156) in the TR group remained unchanged compared with the CON group (Figure 5).
Relative messenger RNA (mRNA) expression levels of genes related to acetyl-CoA metabolism (ACM) in livers of pregnant sheep in the control (CON, fed in normal level) and treated (TR, restricted to 30% level of feed intake) group. Values are means (n=10), with their standard errors represented by vertical bars. *Mean values with asterisks were significantly different between two groups (P<0.05, univariate GLM covariance analysis with Bonferroni adjustment). ACAT=acetyl-CoA acyltransferase; HMGCS2=β-hydroxy-β-methylglutaryl CoA (HMG-CoA) synthase 2; HMGCL=HMG-CoA lyase; HMGCS1=HMG-CoA synthase 1; HMGCR=HMG-CoA reductase.

Triglyceride synthesis in liver
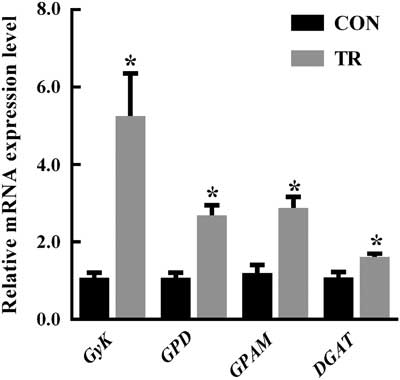
In addition to FAO, NEFAs can also be esterified to triglycerides, which are stored in hepatocytes as lipid droplets. The expression levels of genes involved in TGS, including glycerol kinase (P<0.001), glycerol-3-phosphate dehydrogenase (P<0.001), mitochondrial glycerol-3-phosphate acyltransferase (P=0.002) and diacylglycerol acyltransferase (P=0.004) in the TR group were greater than those of the CON group, respectively (Figure 6).
Relative messenger RNA (mRNA) expression levels of genes related to triglyceride synthesis (TGS) in livers of pregnant sheep in the control (CON, fed in normal level) and treated (TR, restricted to 30% level of feed intake) group. Values are means (n=10), with their standard errors represented by vertical bars. *Mean values with asterisks were significantly different between two groups (P<0.05, univariate GLM covariance analysis with Bonferroni adjustment). GyK=glycerol kinase; GPD=glycerol-3-phosphate dehydrogenase; GPAM=glycerol-3-phosphate acyltransferase, mitochondrial; DGAT=diacylglycerol acyltransferase.

Correlations between blood and liver biochemical indicators
To further understand the material flow, correlations between blood (day 15) and liver biochemical indicators of the 20 sheep were evaluated. Results showed that blood NEFAs level was positively correlated with the contents of NEFAs (r=0.605, P=0.005), BHBA (r=0.646, P=0.002), cholesterol (r=0.573, P=0.008) and triglyceride (r=0.906, P<0.001) in liver. Blood glucose level was negatively correlated with the contents of NEFAs (r=−0.571, P=0.009), BHBA (r=−0.483, P=0.031) and triglyceride (r=−0.525, P=0.017) in liver. Blood BHBA level was linked with the contents of NEFAs (r=0.776, P<0.001), BHBA (r=0.671, P=0.001), triglyceride (r=0.714, P<0.001) and glycerol (r=−0.569, P=0.009) in liver. Blood cholesterol level was positively correlated with the contents of NEFAs (r=0.498, P=0.025), BHBA (r=0.529, P=0.016) and triglyceride (r=0.658, P=0.002) in liver. Blood glycerol level was positively linked with the contents of BHBA (r=0.621, P=0.004) and triglyceride (r=0.465, P=0.039) in liver.
Discussion
Although PT is a rather commonly studied disease, available information about this disease mainly focuses on clinical features, biochemical indicators, diagnosis and conventional therapy (Marteniuk, Reference Marteniuk and Herdt1988; Rook and Herdt, Reference Rook and Herdt2000; Calpereyra et al., Reference Calpereyra, Acostadibarrat, Benech, Silva, Martín and González-Montaía2012). This is the first study to explore the molecular mechanisms of lipid metabolism disruption in livers of ewes with PT. Ewes subjected to feed restriction presented a series of symptoms, which were consistent with the clinical signs of PT in previous reports (Marteniuk, Reference Marteniuk and Herdt1988; Rook and Herdt, Reference Rook and Herdt2000; Calpereyra et al., Reference Calpereyra, Acostadibarrat, Benech, Silva, Martín and González-Montaía2012). The blood BHBA levels of feed-restricted ewes were all above the threshold (BHBA <0.8 mmol/l, normal; 0.8 to 1.6 mmol/l, subclinical PT; >1.6 mmol/l, clinical PT) (Firat and Ozpinar, Reference Firat and Ozpinar2002; Ismail et al., Reference Ismail, Almajali, Amireh and Alrawashdeh2008), further confirming the successful induction of the pathological model of clinical PT (West, Reference West1996; Calpereyra et al., Reference Calpereyra, Borteiro, Benech, Rodas, Abreu, Cruz and Gonzálezmontaña2009).
Previous studies reported that elevated body fat mobilization in feed-restricted animals induced liver degeneration and vacuolation (Calpereyra et al., Reference Calpereyra, Borteiro, Benech, Rodas, Abreu, Cruz and Gonzálezmontaña2009). In the present study, the protoplasm of many hepatocytes appeared to be replaced by lipid, which was similar to Snook’s description (Snook, Reference Snook1939). Furthermore, the changed structures of hepatocytes, including nuclear shape alteration, mitochondrial vacuolation and endoplasmic reticulum derangement, were consistent with the findings reported by Wang et al. (Reference Wang, Enzhong and Wang2014). Some endoplasmic reticulum might be smooth reticulum, and their derangements were likely related to the disordered lipid metabolism in liver of PT ewes. Although some morphological changes might be the result from the fixation defects, however, when compared with the CON, severe alteration of nuclei, mitochondria and endoplasmic reticulum in the TR group implied that there was damage to hepatocytes’ internal structures in PT ewes.
A significantly elevated liver index also certified the turgidity of livers in PT ewes. This could be due to the progressive accumulation of triglyceride that the livers of PT ewes became enlarged, deep yellow and degenerated (Wang et al., Reference Wang, Enzhong and Wang2014; Abba et al., Reference Abba, Abdullah, Chung, Sadiq, Mohammed, Osman, Rahmat, Razak, Lila, Haron and Saharee2015). The increased level of triglyceride and decreased level of glycerol can be partly explained by the elevated expression of genes linked to TGS in livers of PT ewes. This finding corresponds to previous reports that increased plasma NEFAs results in up-regulated fatty acid esterification and triglyceride storage in livers of dairy cows (Grummer, Reference Grummer1993). Furthermore, previous studies have shown that only a very small part of triglyceride can be transported out of the liver by very low-density lipoprotein (Kleppe et al., Reference Kleppe, Aiello, Grummer and Armentano1988). Officially because of this, no difference in plasma triglyceride level between two groups and no correlation between the level of triglyceride in plasma and liver was observed. Generally, the excessively accumulated triglyceride in livers of PT ewes caused fatty liver.
Normally, when NEFAs overwhelm the capacity of fatty acid metabolism, the alternative way of re-esterification to triglyceride for NEFAs with free glycerol in liver proceeds substantially (Brickner et al., Reference Brickner, Pires, Gressley and Grummer2009). In line with the enhanced FAO in ketotic (Loor et al., Reference Loor, Everts, Bionaz, Dann, Morin, Oliveira, Rodriguezzas, Drackley and Lewin2007) and energy-restricted (Loor et al., Reference Loor, Dann, Guretzky, Everts, Oliveira, Green, Litherland, Rodriguez-Zas, Lewin and Drackley2006) dairy cows, the increased expression levels of genes linked to fatty acid activation, acyl-CoA transportation and acyl-CoA oxidation in the present study imply that there is an enhancement of FAO in liver of PT ewes. It has been proven that the transcriptional levels of ACSL, ACADL and CPT1 are elevated significantly with increased NEFAs in cultured bovine hepatocytes (Li et al., Reference Li, Liu, Zhang, Long, Guo, Wang, Li, Zhang, Li and He2013b). Another research has also shown that CPT1, the rate-limiting enzyme of FAO, can be activated by long-chain fatty acids (Louet et al., Reference Louet, Le, Pégorier, Decaux and Girard2001). In the present study, NEFAs were accumulated both in livers and blood of PT ewes. Therefore, the intensified FAO in livers of PT ewes may be partly due to the rising level of NFEAs.
The major finding of the current study was that ACM was inhibited in livers of ewes with PT, which might further increase NEFAs accumulation and aggravate fatty liver. Acetyl-CoA, as the product of FAO, and its outlets include complete and incomplete oxidation. Nonetheless, the oxaloacetic acid pool is very limited, especially when ketosis occurs (Xu et al., Reference Xu, Liu, Li, Xia, Zhang and Wang2010), and represses acetyl-CoA to generate citric acid and enter citrate cycle for complete oxidation. The alternative pathway of incomplete oxidation to produce ketone bodies (mainly BHBA) and cholesterol may be activated. As a result, a significant increase of BHBA and cholesterol was detected in the blood and livers of PT ewes. It is well known that ketogenesis is controlled by substrate availability (Williamson and Whitelaw, Reference Williamson and Whitelaw1978; McGarry and Foster, Reference McGarry and Foster1980) and ketogenesis-associated genes (Rodriguez et al., Reference Rodriguez, Gil-Gómez, Hegardt and Haro1994). It also has been proven that BHBA (more than 1.5 mmol/l) shows a dose-dependent inhibitory effect on HMGCS2 expression in bovine hepatocytes (Li et al., Reference Li, Li, Fu, Wu, Wang, Yu, Long, Wang and Liu2013a). In the current study, substrates were abundant due to the up-regulated FAO, so the down-regulated ketogenesis pathway in livers of PT ewes might result from feedback regulation with the substantial accumulation of BHBA. In addition, down-regulated mRNA expression level of HMGCS2 (Li et al., Reference Li, Liu, Long, Guo, Wang, He and Liu2012) has also been reported in ketotic cows. For cholesterol synthesis, previous findings reveal that HMGCS1 expression is inhibited by fasting and by accumulated product (Royo et al., Reference Royo, Ayté, Albericio, Giralt, Haro and Hegardt1991). Thus, the decreased expression of HMGCS1 in livers of PT ewes might result from the restricted feeding and accumulated cholesterol. Consistent with our results, down-regulated HMGCR has also been observed in ketotic cows (Loor et al., Reference Loor, Everts, Bionaz, Dann, Morin, Oliveira, Rodriguezzas, Drackley and Lewin2007). In general, both ketogenesis and cholesterol synthesis have been down-regulated, which represses the metabolism of NEFAs.
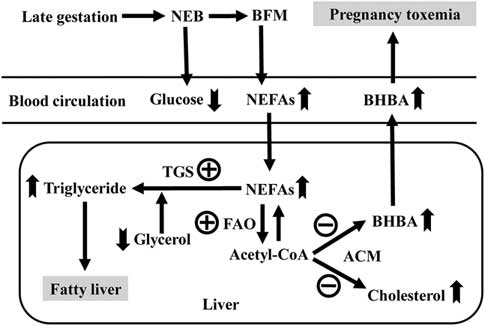
In conclusion, negative energy balance could enhance FAO and TGS with the excessive deposition of NEFAs in the liver. However, ACM was repressed with the accumulation of BHBA and cholesterol in the liver. Fatty liver, which was always accompanied with PT, resulted from continuously accumulated triglyceride and caused severe liver damage. When liver function was injured, decreased ability of energy conversion would trigger much more severe negative energy balance and body fat mobilization, resulting in more severe PT (Figure 7). Generally, as discussed above, several critical molecular mechanisms of lipid metabolism disorders were recognized in livers of PT ewes, and the findings of this research have important implications for developing the novel therapeutic strategies of PT.
Integrated analysis of lipid metabolism disturbance in livers of ewes with nutrition-induced pregnancy toxemia. Up swallowtail arrows represent increased substances; down swallowtail arrows represent decreased substances; plus signs represent up-regulated pathways; minus signs represent down-regulated pathways. NEB=negative energy balance; BFM=body fat mobilization; NEFAs=non-esterified fatty acids; BHBA= β-hydroxybutyrate; TGS=triglyceride synthesis; FAO=fatty acid oxidation; ACM=acetyl-CoA metabolism.

Acknowledgments
The present study was supported by the National Key Research and Development Program of China (grant no. 2016YFD0501200) and Postgraduate Research & Practice Innovation Program of Jiangsu Province (grant no. KYCX17_0607).
The authors’ contributions are as follows: S. Y. M. and Y. F. X. conceived and designed the study; Y. F. X., C. Z. G. and F. H. conducted the research; Y. F. X., D. M. S. and J. H. L. analyzed and interpreted the data; and Y. F. X. wrote the manuscript. All authors read and approved the final version of the manuscript.
Declaration of interest
The authors declare that there is no conflict of interest.
Ethics statement
The animal experimental design and procedures were approved by the Animal Care and Use Committee of Nanjing Agricultural University (SYXK(Su)2015-0656). This experiment was performed using Hu-sheep at a breeding farm in Shanghai, China.
Software and data repository resources
The authors declare that the data of this research are not deposited in any official repository.
Supplementary material
To view supplementary material for this article, please visit https://doi.org/10.1017/S1751731118002136