


Hyperuricemia is a metabolic disorder characterized by dysregulated serum uric acid (SUA) homeostasis (L. Du et al., Reference Du, Zong, Li, Wang, Xie, Yang, Pang, Zhang, Zhong and Gao2024). Most affected individuals remain asymptomatic for years, presenting solely with persistently elevated SUA levels. In addition to its established roles in gout and uric acid nephrolithiasis (Ragab et al., Reference Ragab, Elshahaly and Bardin2017), hyperuricemia has now been recognized as an independent risk factor for cardiovascular disease (Johnson et al., Reference Johnson, Bakris, Borghi, Chonchol, Feldman, Lanaspa, Merriman, Moe, Mount, Sanchez Lozada, Stahl, Weiner and Chertow2018), chronic kidney disease (Sharma et al., Reference Sharma, Dubey, Nolkha and Singh2021) and type 2 diabetes (Mortada, Reference Mortada2017), thereby contributing substantially to the global public health burden.
The SUA level is jointly regulated by genetic background as well as environmental and lifestyle factors (Boyle et al., Reference Boyle, Greig, Jasani, Duncan, Diver and Buchanan1967; Kilpinen & Dermitzakis, Reference Kilpinen and Dermitzakis2012). Heritability estimates for SUA range from 35% to 77%, and genomewide association studies (GWAS) have identified multiple genetic variants associated with SUA regulation (Reginato et al., Reference Reginato, Mount, Yang and Choi2012; Voruganti et al., Reference Voruganti, Nath, Cole, Thameem, Jowett, Bauer, MacCluer, Blangero, Comuzzie, Abboud and Arar2009; W. Wang et al., Reference Wang, Zhang, Xu, Wu, Duan, Li and Tan2018). However, these variants collectively explain only a small proportion of SUA variability. Emerging evidence indicates that epigenetic mechanisms may also contribute to SUA variation through long-term modifications acting as nongenetic effects (Tin et al., Reference Tin, Schlosser, Matias-Garcia, Thio, Joehanes, Liu, Yu, Weihs, Hoppmann, Grundner-Culemann, Min, Kuhns, Adeyemo, Agyemang, Ärnlöv, Aziz, Baccarelli, Bochud, Brenner and Köttgen2021; Xavier et al., Reference Xavier, Roman, Aitken and Nixon2019). Nevertheless, the relevant studies in Chinese populations remain limited.
Epigenetics refers to trait changes that occur without alterations in the DNA sequence (Peixoto et al., Reference Peixoto, Cartron, Serandour and Hervouet2020). Among epigenetic mechanisms, DNA methylation (DNAm) has attracted considerable attention and has been implicated in metabolic and inflammatory processes relevant to hyperuricemia (Liu et al., Reference Liu, Crișan, Qi, Gupta, Liu, Moorlag, Koeken, Jiang, Ballan, De Bree, Mourits, Gao, Baccarelli, Schwartz, Pessler, Guzmán, Li, Netea, Joosten and Xu2025; Tin et al., Reference Tin, Schlosser, Matias-Garcia, Thio, Joehanes, Liu, Yu, Weihs, Hoppmann, Grundner-Culemann, Min, Kuhns, Adeyemo, Agyemang, Ärnlöv, Aziz, Baccarelli, Bochud, Brenner and Köttgen2021). Moreover, evidence suggests that DNAm may modulate SUA levels through mechanisms such as immune cell reprogramming, activation of the NLRP3 inflammasome, and excessive IL-1β responses to urate crystals (Agrawal et al., Reference Agrawal, Niroula, Cunin, McConkey, Shkolnik, Kim, Wong, Weeks, Lin, Miller, Gibson, Sekar, Schaefer, Neuberg, Stone, Bick, Uddin, Griffin, Jaiswal and Ebert2022; Leask et al., Reference Leask, Crișan, Ji, Matsuo, Köttgen and Merriman2024). A prior epigenomewide association study (EWAS) had identified DNAm changes in genes such as SLC2A9, potentially affecting renal urate reabsorption (Tin et al., Reference Tin, Schlosser, Matias-Garcia, Thio, Joehanes, Liu, Yu, Weihs, Hoppmann, Grundner-Culemann, Min, Kuhns, Adeyemo, Agyemang, Ärnlöv, Aziz, Baccarelli, Bochud, Brenner and Köttgen2021). Candidate gene studies have reported that hypomethylation of the CCL2 promoter and hypermethylation of the UMOD promoter were linked to gout susceptibility (B. Li et al., Reference Li, Chen, Jiang, Yang, Zhong, Zhou, Hu and Duan2017; Y. Yang et al., Reference Yang, Chen, Hu, Jiang, Yu, Dai, Mao and Duan2017). In addition, a study in a Dutch population found that urate alters the epigenetic landscape of monocytes or whole blood in individuals with hyperuricemia, suggesting that urate-induced epigenetic changes in bone marrow-derived cells may contribute to the development of gout (Badii et al., Reference Badii, Gaal, Cleophas, Klück, Davar, Habibi, Keating, Novakovic, Helsen, Dalbeth, Stamp, Macartney-Coxson, Phipps-Green, Stunnenberg, Dinarello, Merriman, Netea, Crişan and Joosten2021). Nevertheless, current EWAS evidence regarding SUA remains scarce and is derived solely from European populations (Tin et al., Reference Tin, Schlosser, Matias-Garcia, Thio, Joehanes, Liu, Yu, Weihs, Hoppmann, Grundner-Culemann, Min, Kuhns, Adeyemo, Agyemang, Ärnlöv, Aziz, Baccarelli, Bochud, Brenner and Köttgen2021). Given that DNAm patterns vary across different genetic background and environmental exposures, studies in Chinese populations are urgently needed.
Monozygotic (MZ) twins, who share identical genomes and similar early-life environments, offer a unique natural matching design that enables powerful control of genetic and environmental confounders (W. Li et al., Reference Li, Christiansen, Hjelmborg, Baumbach and Tan2018; Tan et al., Reference Tan, Christiansen, Von Bornemann Hjelmborg and Christensen2015; D. Zhang et al., Reference Zhang, Li, Tan and Pang2012). This design greatly strengthens the ability to identify associations between DNAm and phenotypic traits. Furthermore, traditional EWAS typically rely on observational designs, such as cross-sectional or case-control studies, which makes it difficult to establish causal relationships. The Inference about Causation from Examination of Familial Confounding (ICE FALCON) method, developed specifically for family designs, including twin pairs, allows for exploring the bidirectional causal inference between DNAm and the phenotype of interest (S. Li et al., Reference Li, Wong, Bui, Nguyen, Joo, Stone, Dite, Dugué, Milne, Giles, Saffery, Southey and Hopper2019, Reference Li, Bui and Hopper2020). Applying ICE FALCON method to SUA in twins may help clarify whether DNAm influences SUA levels or whether SUA itself induces DNAm alterations.
Therefore, in this study of MZ twins from Qingdao, China, we aimed to: (1) perform an EWAS to identify differentially methylated cytosine-phosphate-guanines (CpGs), genes, and regions as well as biological pathways potentially associated with SUA; (2) determine the causal relationship between the identified DNAm and SUA using ICE FALCON approach; and (3) validate key findings by integrating gene expression data and further replicating the results in a longitudinal twin cohort.
Methods
Participants
Participant recruitment and data collection procedures have been described in detail elsewhere (W. Wang, Li, Jiang, et al., Reference Wang, Li, Jiang, Lin, Wu, Wen, Xu, Tian, Li, Tan and Zhang2021; W. Wang, Li, Wu, et al., Reference Wang, Li, Wu, Tian, Duan, Li, Tan and Zhang2021; W. Wang, Yao, Li, et al., Reference Wang, Yao, Li, Wu, Duan, Xu, Tian, Li, Tan and Zhang2023; Xu et al., Reference Xu, Zhang, Tian, Wu, Pang, Li and Tan2017). Briefly, recruitment of MZ twins took place in residential communities in Qingdao using household registration information and public messages from local media. After providing written informed consent, all participants completed a standardized questionnaire, underwent physical examination, and provided fasting venous blood samples. We extracted and analyzed follow-up data from 2023 to 2024. Participants were excluded if they were pregnant or lactating; had a clinical diagnosis of gout or systemic lupus erythematosus; had an estimated glomerular filtration rate (eGFR) < 60 mL/min/1.73 m2 or serum creatinine > 1.4 mg/dL; or had used febuxostat or other uric acid-altering medications within the preceding month (W. Wang, Yao, Li, et al., Reference Wang, Yao, Li, Wu, Duan, Xu, Tian, Li, Tan and Zhang2023). The SUA level was measured using a semi-automatic analyzer (Hitachi 7600, Japan) and log10-transformed prior to statistical analyses. Considering the characteristics of MZ twin samples and based on our previous research experience (Qi et al., Reference Qi, Wang, Wang, Wang and Zhang2025; W. Wang, Yao, Tan, et al., Reference Wang, Yao, Tan, Li, Duan, Tian, Xu and Zhang2023), we employed a discordant MZ twin design, in which twin pairs with an intrapair SUA difference ≥ 1 μmol/L were included. Finally, we included 50 MZ twin pairs for the DNAm analysis, and a randomly selected subset of 46 pairs were used in the gene expression analysis. This study was conducted in accordance with the Declaration of Helsinki and was approved by the Regional Ethics Committee of the Qingdao Center for Disease Control (Approval No. 2012-01; Date: January 20, 2012).
Study Power Estimation
Previous research has demonstrated that, compared with conventional case-control designs, trait- or disease-discordant twin designs can substantially reduce the required sample size for detecting epigenetic associations (W. Li et al., Reference Li, Christiansen, Hjelmborg, Baumbach and Tan2018; D. Zhang et al., Reference Zhang, Li, Tan and Pang2012). When the target phenotype has a moderate to high heritability (>0.3) and environmental influences show weak correlations with DNAm, a sample of only 22 to 63 discordant twin pairs can provide approximately 80% statistical power (W. Li et al., Reference Li, Christiansen, Hjelmborg, Baumbach and Tan2018). According to previous studies, the heritability of SUA levels was estimated to be 70.5% (95% CI [65.9, 74.6]; Duan et al., Reference Duan, Pang, Zhang, Wang, Zhai, Zhang and Tan2010). Based on the study by W. Li et al. (Reference Li, Christiansen, Hjelmborg, Baumbach and Tan2018), the statistical power of our study based on 50 MZ twin pairs was estimated to reach 80%.
Zygosity Determination
Zygosity was initially assessed using sex and ABO blood type. The twin pairs with opposite sex or discordant blood types were classified as dizygotic (DZ). Same-sex twin pairs with identical blood types subsequently underwent DNA-based zygosity testing using 16 short tandem repeat markers for confirmation (Duan et al., Reference Duan, Ning, Zhang, Wang, Zhang, Tan, Tian and Pang2013; Jackson et al., Reference Jackson, Snieder, Davis and Treiber2001).
Genomewide DNAm Measurement
Genomewide DNAm was profiled using the Infinium MethylationEPIC v2.0 BeadChip (935K), an advanced methylation profiling platform that extends the coverage of the earlier 450K and 850K arrays (Noguera-Castells et al., Reference Noguera-Castells, García-Prieto, Álvarez-Errico and Esteller2023). Genomic DNA was extracted from peripheral whole blood and subjected to bisulfite conversion following standard procedures. DNAm levels were then quantified using the Infinium MethylationEPIC v2.0 BeadChip. Briefly, the laboratory workflow comprised DNA amplification, fragmentation, precipitation, resuspension, hybridization to BeadChips, chip washing, single-base extension, staining, scanning, and raw signal extraction (L. Wang et al., Reference Wang, Qu and Yang2025).
The raw methylation data covered 937,055 CpGs across the genome for each individual. Data preprocessing, including quality control (QC) and normalization, was performed using the minfi R package (Aryee et al., Reference Aryee, Jaffe, Corrada-Bravo, Ladd-Acosta, Feinberg, Hansen and Irizarry2014). Data normalization was performed using Subset-quantile Within Array Normalization (SWAN; Maksimovic et al., Reference Maksimovic, Gordon and Oshlack2012). CpGs with detection p values > .01 were removed after excluding samples containing >10% low-quality CpGs. Non-CpG probes, including SNP and quality-control probes, were discarded. CpGs overlapping SNPs with a minor allele frequency > 0.05 in the EAS population were excluded. Probes with nonspecific genomic mapping were filtered out. Finally, CpGs on sex chromosomes were removed to avoid sex-related methylation bias. After filtering, 861,569 CpGs were retained for subsequent analysis. The DNAm levels were summarized by calculating β values defined according to the Illumina formula.
Adjustment for Blood Cell Composition
Since DNAm data were measured in whole blood, variation in cell-type–specific methylation patterns can confound association analyses (Jaffe & Irizarry, Reference Jaffe and Irizarry2014). We applied Smart Surrogate Variable Analysis (SmartSVA), a reference-free approach applicable to heterogeneous tissues including whole blood, to account for latent sources of variation in DNAm data without relying on predefined cell-type reference panels (Chen et al., Reference Chen, Behnam, Huang, Moffatt, Schaid, Liang and Lin2017). By iteratively weighting CpGs according to their probabilities of being affected by unmodeled confounders, SmartSVA derives surrogate variables capturing major latent sources of variation. These surrogate variables were included in the preprocessing step, and the resulting SV-adjusted DNAm β values were subsequently transformed into M values using the formula M = log2[β/(1 − β)] to facilitate downstream statistical analyses (P. Du et al., Reference Du, Zhang, Huang, Jafari, Kibbe, Hou and Lin2010). Therefore, explicit adjustment for cell-type proportions was not performed in subsequent regression analyses, in order to avoid redundant or potential over-adjustment (Brägelmann & Lorenzo Bermejo, Reference Brägelmann and Lorenzo Bermejo2019).
Gene Expression Data Preparation
Consistent with our previous work (W. Wang et al., Reference Wang, Jiang, Hou, Duan, Wu, Xu, Tan, Li and Zhang2017), total mRNA was extracted from peripheral whole blood, and RNA-seq libraries were subsequently prepared and sequenced. Sequencing reads were mapped to the human reference genome using TopHat 2 (Kim et al., Reference Kim, Pertea, Trapnell, Pimentel, Kelley and Salzberg2013), and gene expression levels were quantified as fragments per kilobase of transcript per million mapped reads (FPKM) values with Cufflinks (Trapnell et al., Reference Trapnell, Williams, Pertea, Mortazavi, Kwan, Van Baren, Salzberg, Wold and Pachter2010).
Statistical Analysis
Step 1: DNA Methylation Analysis
Genomewide DNAm association analysis. As an exploratory analysis, we conducted individual-level EWAS using generalized estimating equations (GEE) implemented in the geepack package in R. This approach was chosen to estimate population-averaged associations between DNAm M values at individual CpGs and SUA levels, with adjustment for potential confounding factors. Twin-pair identifiers (family id) were specified as the clustering variable in the GEE models to account for the relatedness between twins. By adjusting for covariate effects on individual DNAm levels and incorporating methylation data from all participants, this approach maximizes statistical power to detect differentially methylated sites associated with SUA levels (Kandaswamy et al., Reference Kandaswamy, Hannon, Arseneault, Mansell, Sugden, Williams, Burrage, Staley, Pishva, Dahir, Roberts, Danese, Mill, Fisher and Wong2021). To control for type I errors due to multiple testing, we applied Bonferroni correction across the 861,569 CpGs, yielding a genomewide significance threshold of p < 5.8 × 10⁻⁸ (corresponding to a Bonferroni-adjusted p < .05) (J. Li, Luo, et al., Reference Li, Luo, Wang, Tian, Xu, Wang and Zhang2025). All CpGs were annotated to their nearest genes with the BiomaRt package (Durinck et al., Reference Durinck, Spellman, Birney and Huber2009).
Causal inference analysis. Genomewide significant CpGs (Bonferroni-adjusted p < .05) were examined for causal associations with SUA using ICE FALCON method (S. Li et al., Reference Li, Bui and Hopper2020), a regression-based approach designed for twin or family studies. By controlling for genetic and shared environmental influences in MZ twins, ICE FALCONE allows inference of potential causal relationships. Four estimates were calculated: βself (overall association including both causal and familial confounding), βco-twin (familial confounding), β′self, and β′co-twin from the fully adjusted model. If |βco-twin − β′co-twin| was similar to |βself − β′self|, the association was attributed to familial confounding; if the ratio of these differences exceeded 1.5, the association was considered likely causal (S. Li et al., Reference Li, Bui and Hopper2020).
Differentially methylated regions analysis. The SUA-related differentially methylated regions (DMRs) were identified using comb-p approach, applying the Stouffer-Liptak-Kechris (slk) correction (Pedersen et al., Reference Pedersen, Schwartz, Yang and Kechris2012). The DMRs with slk-corrected p < .05 were considered statistically significant (Pedersen et al., Reference Pedersen, Schwartz, Yang and Kechris2012).
Interaction network analysis. To explore interactions among genes associated with SUA-related CpGs (Bonferroni-adjusted p < .05) and DMRs, we used GeneMANIA to construct functional interaction networks by integrating co-expression, physical and genetic interactions, and shared pathway data, with the maximum number of resultant genes set to 10 (Franz et al., Reference Franz, Rodriguez, Lopes, Zuberi, Montojo, Bader and Morris2018).
Functional enrichment analysis. Functional enrichment analysis was conducted using the Database for Annotation, Visualization, and Integrated Discovery (DAVID) tool for genes annotated to CpGs with p < .05 (Sherman et al., Reference Sherman, Hao, Qiu, Jiao, Baseler, Lane, Imamichi and Chang2022). Biological processes and pathways with a false discovery rate (FDR) < 0.05 were considered statistically significant (Sherman et al., Reference Sherman, Hao, Qiu, Jiao, Baseler, Lane, Imamichi and Chang2022).
Step 2: Differential Gene Expression Analysis
We further measured gene expression levels in 50 pairs of MZ twins. Four pairs were excluded due to unqualified mRNA sample during the extraction process, leaving 46 pairs available for differential gene expression analysis. The associations of mRNA expression of genes covering top CpGs and DMRs with SUA levels were analyzed using a GEE model, adjusting for age and sex, with twin-pair identifiers included to account for the paired structure.
Step 3: Quantitative Methylation Analysis of Candidate Gene
Based on the top CpG annotations identified in our genomewide DNAm analysis, together with the results from the causal inference analysis and differential gene expression analyses, we selected the candidate genes for validation in the longitudinal study. The CpGs within the candidate genes that met Benjamini-Hochberg FDR < 0.05 threshold in the EWAS were extracted for validation.
We further utilized baseline data and blood samples (2012–2013) from the same 50 MZ twin pairs included in the EWAS, enabling longitudinal validation in combination with follow-up data collected in 2023–2024. The DNAm profiling of the baseline samples was also performed using the 935K method, and the methylation levels of CpGs within the candidate genes were extracted. The β values were transformed into M values using the formula M = log2 (β/(1 − β)) for statistical analyses. Given the causal effects observed for the candidate genes, we employed GEE to assess the longitudinal association between SUA and CpG methylation levels, adjusting for baseline age, sex, and the baseline outcome (SUA or DNAm), while accounting for twin clustering.
Results
DNA Methylation Analysis
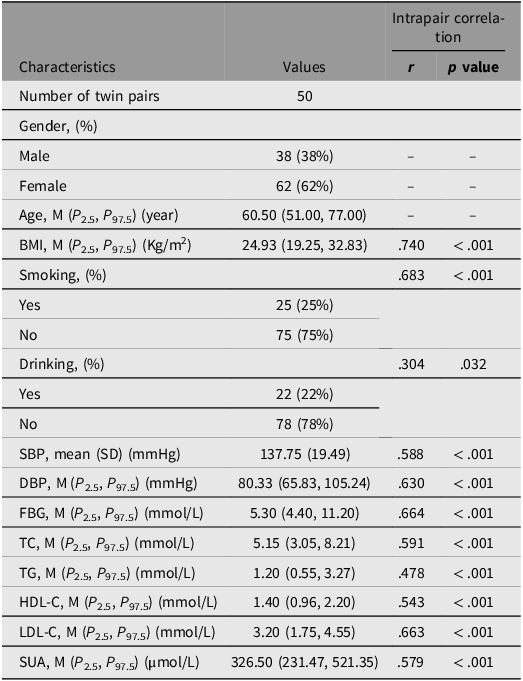
Sample characteristics. The characteristics of 50 MZ twin pairs are shown in Table 1. The median (P 2.5, P 97.5) of SUA levels was 326.50 (231.47, 521.35) μmol/L, and the median (P 2.5, P 97.5) of age was 60.50 (51.00, 77.00) years. All phenotypic traits, such as body mass index (BMI), diastolic blood pressure, systolic blood pressure (SBP), total cholesterol (TC), and triglycerides (TG), showed significant intrapair correlations, underscoring the advantage of the discordant MZ twin design, and these factors were not included as covariates in the subsequent GEE model. We included age and sex as covariates in the following analysis.
Basic characteristics of the participants

Table 1 Long description
A table showing the characteristics of 50 monozygotic twin pairs, including various health metrics and their intrapair correlations. The table has 15 rows and 4 columns. The columns are labeled Characteristics, Values, r, and p value. The rows are labeled with different characteristics such as Number of twin pairs, Gender, Age, BMI, Smoking, Drinking, SBP, DBP, FBG, TC, TG, HDL-C, LDL-C, and SUA. Each row provides specific values and intrapair correlation data for these characteristics. For example, the Number of twin pairs is 50. Gender is divided into Male (38 percent) and Female (62 percent). Age has a median of 60.50 years. BMI has a median of 24.93 Kg per square meter with an intrapair correlation r value of 0.740 and a p value of less than 0.001. Smoking is divided into Yes (25 percent) and No (75 percent) with an intrapair correlation r value of 0.683 and a p value of less than 0.001. Drinking is divided into Yes (22 percent) and No (78 percent) with an intrapair correlation r value of 0.304 and a p value of 0.032. SBP has a mean of 137.75 mmHg with an intrapair correlation r value of 0.588 and a p value of less than 0.001. DBP has a median of 80.33 mmHg with an intrapair correlation r value of 0.630 and a p value of less than 0.001. FBG has a median of 5.30 mmol per liter with an intrapair correlation r value of 0.664 and a p value of less than 0.001. TC has a median of 5.15 mmol per liter with an intrapair correlation r value of 0.591 and a p value of less than 0.001. TG has a median of 1.20 mmol per liter with an intrapair correlation r value of 0.478 and a p value of less than 0.001. HDL-C has a median of 1.40 mmol per liter with an intrapair correlation r value of 0.543 and a p value of less than 0.001. LDL-C has a median of 3.20 mmol per liter with an intrapair correlation r value of 0.663 and a p value of less than 0.001. SUA has a median of 326.50 micromoles per liter with an intrapair correlation r value of 0.579 and a p value of less than 0.001.
Note: Continuous variables are presented as mean (standard deviation, SD) or median (M) (P 2.5, P 97.5); categorical variables are presented as numbers with percentiles. BMI, body mass index; SBP, systolic blood pressure; DBP, diastolic blood pressure; FBG, fasting blood glucose; TC, total cholesterol; TG, triglyceride; HDL-C, high-density lipoprotein cholesterol; LDL-C, low-density lipoprotein cholesterol; SUA, serum uric acid.
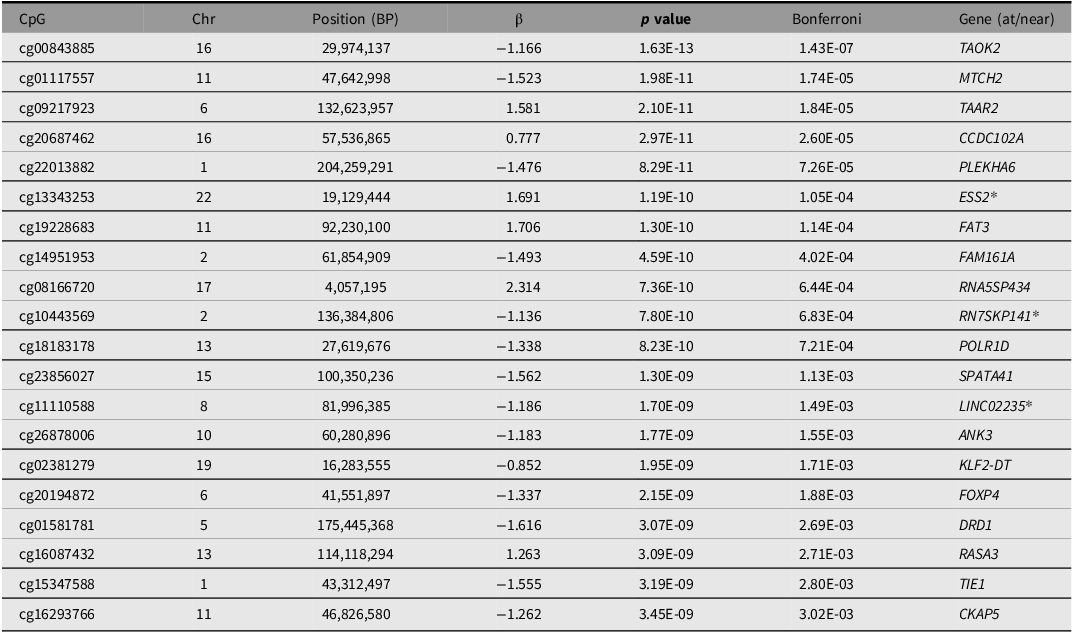
Genomewide DNAm association analysis. The Manhattan plot for the SUA EWAS is shown in Figure 1. As shown in Figure 1 and Table 2, we identified 70 CpGs that met genomewide significant level (Bonferroni-adjusted p < .05). The cg00843885, located in TAOK2, was identified as the most significant CpG (Bonferroni-adjusted p = 1.43 × 10⁻⁷). Among these top CpGs, 24 CpGs, such as those located in the TAAR2, PKM, and DOK6 genes, showed a positive association with SUA levels, indicating that higher methylation levels at these CpGs correspond to higher SUA concentrations. The remaining 46 CpGs, such as those located in NGLY1, TAOK2, MTCH2, CKAP5, and LDHB genes, showed a negative association with SUA levels, suggesting that higher methylation levels at these CpGs were associated with lower SUA concentrations (Table 2 and Table S1).
Circular Manhattan plot for the epigenomewide association study of serum uric acid.

The results of epigenome-wide association study on serum uric acid (Top 20)

Table 2 Long description
The table presents data on CpG sites associated with serum uric acid levels. It includes 20 rows and 7 columns. The columns are labeled CpG, Chr, Position (BP), β, p value, Bonferroni, and Gene (at/near). Each row lists a specific CpG site with its chromosomal position, beta value, p-value, Bonferroni correction, and associated gene. Row 1: CpG, cg00843885; Chr, 16; Position (BP), 29,974,137; β, -1.166; p value, 1.63E-13; Bonferroni, 1.43E-07; Gene (at/near), TAOK2. Row 2: CpG, cg01117557; Chr, 11; Position (BP), 47,642,998; β, -1.523; p value, 1.98E-11; Bonferroni, 1.74E-05; Gene (at/near), MTCH2. Row 3: CpG, cg09217923; Chr, 6; Position (BP), 132,623,957; β, 1.581; p value, 2.10E-11; Bonferroni, 1.84E-05; Gene (at/near), TAAR2. Row 4: CpG, cg20687462; Chr, 16; Position (BP), 57,536,865; β, 0.777; p value, 2.97E-11; Bonferroni, 2.60E-05; Gene (at/near), CCDC102A. Row 5: CpG, cg22013882; Chr, 1; Position (BP), 204,259,291; β, -1.476; p value, 8.29E-11; Bonferroni, 7.26E-05; Gene (at/near), PLEKHA6. Row 6: CpG, cg13343253; Chr, 22; Position (BP), 19,129,444; β, 1.691; p value, 1.19E-10; Bonferroni, 1.05E-04; Gene (at/near), ESS2*. Row 7: CpG, cg19228683; Chr, 11; Position (BP), 92,230,100; β, 1.706; p value, 1.30E-10; Bonferroni, 1.14E-04; Gene (at/near), FAT3. Row 8: CpG, cg14951953; Chr, 2; Position (BP), 61,854,909; β, -1.493; p value, 4.59E-10; Bonferroni, 4.02E-04; Gene (at/near), FAM161A. Row 9: CpG, cg08166720; Chr, 17; Position (BP), 4,057,195; β, 2.314; p value, 7.36E-10; Bonferroni, 6.44E-04; Gene (at/near), RNA5SP434. Row 10: CpG, cg10443569; Chr, 2; Position (BP), 136,384,806; β, -1.136; p value, 7.80E-10; Bonferroni, 6.83E-04; Gene (at/near), RN7SKP141*. Row 11: CpG, cg18183178; Chr, 13; Position (BP), 27,619,676; β, -1.338; p value, 8.23E-10; Bonferroni, 7.21E-04; Gene (at/near), POLR1D. Row 12: CpG, cg23856027; Chr, 15; Position (BP), 100,350,236; β, -1.562; p value, 1.30E-09; Bonferroni, 1.13E-03; Gene (at/near), SPATA41. Row 13: CpG, cg11110588; Chr, 8; Position (BP), 81,996,385; β, -1.186; p value, 1.70E-09; Bonferroni, 1.49E-03; Gene (at/near), LINC02235*. Row 14: CpG, cg26878006; Chr, 10; Position (BP), 60,280,896; β, -1.183; p value, 1.77E-09; Bonferroni, 1.55E-03; Gene (at/near), ANK3. Row 15: CpG, cg02381279; Chr, 19; Position (BP), 16,283,555; β, -0.852; p value, 1.95E-09; Bonferroni, 1.71E-03; Gene (at/near), KLF2-DT. Row 16: CpG, cg20194872; Chr, 6; Position (BP), 41,551,897; β, -1.337; p value, 2.15E-09; Bonferroni, 1.88E-03; Gene (at/near), FOXP4. Row 17: CpG, cg01581781; Chr, 5; Position (BP), 175,445,368; β, -1.616; p value, 3.07E-09; Bonferroni, 2.69E-03; Gene (at/near), DRD1. Row 18: CpG, cg16087432; Chr, 13; Position (BP), 114,118,294; β, 1.263; p value, 3.09E-09; Bonferroni, 2.71E-03; Gene (at/near), RASA3. Row 19: CpG, cg15347588; Chr, 1; Position (BP), 43,312,497; β, -1.555; p value, 3.19E-09; Bonferroni, 2.80E-03; Gene (at/near), TIE1. Row 20: CpG, cg16293766; Chr, 11; Position (BP), 46,826,580; β, -1.262; p value, 3.45E-09; Bonferroni, 3.02E-03; Gene (at/near), CKAP5.
Note: *CpGs located near the gene. Chr, chromosome; BP, base pair.
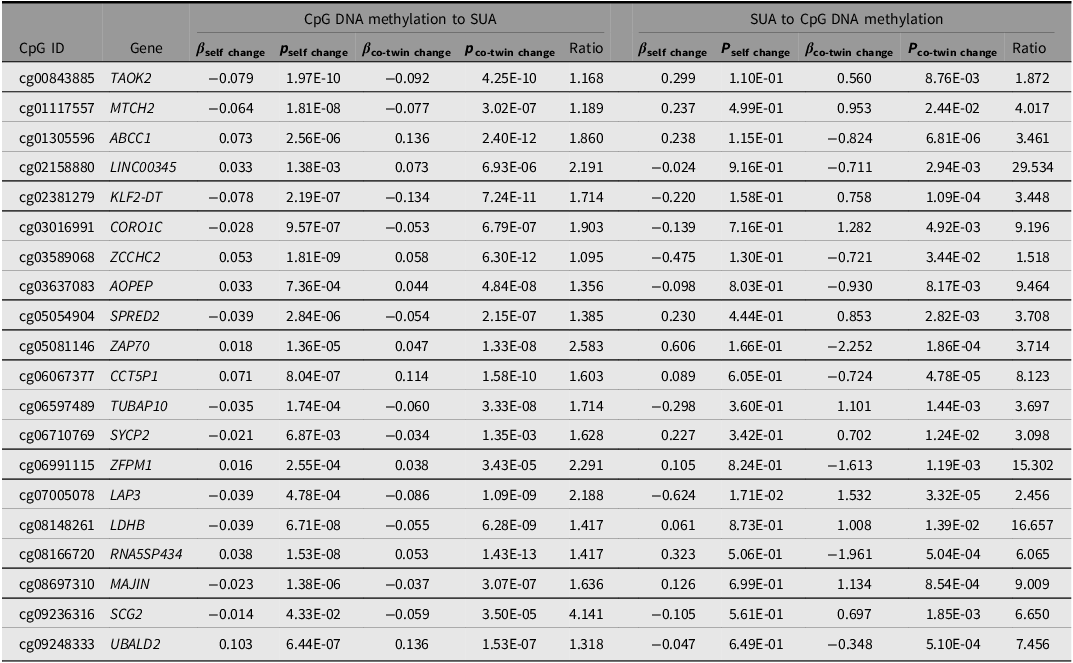
Causal inference analysis. The results of causal inference of the top CpGs are summarized in Table 3 and Table S2. In total, the DNAm of 56 CpGs showed evidence of causal associations with SUA. Among them, one CpG located in the SPINK8 gene exhibited a unidirectional causal effect from DNAm to SUA. Another 22 CpGs, distributed across genes such as TAOK2, MTCH2, LDHB, PKM, and DOK6, showed a unidirectional causal effect from SUA to DNAm. In addition, 33 CpGs located in genes such as ABCC1, CORO1C, ZAP70, and RBM44 demonstrated bidirectional causal relationships between DNAm and SUA.
Results of causal inference analysis using ICE FALCON for serum uric acid (Top 20)

Table 3 Long description
.
*DNAm has a causal effect on SUA, #SUA has a causal effect on DNAm, *#DNAm and SUA have bidirectional causal effect
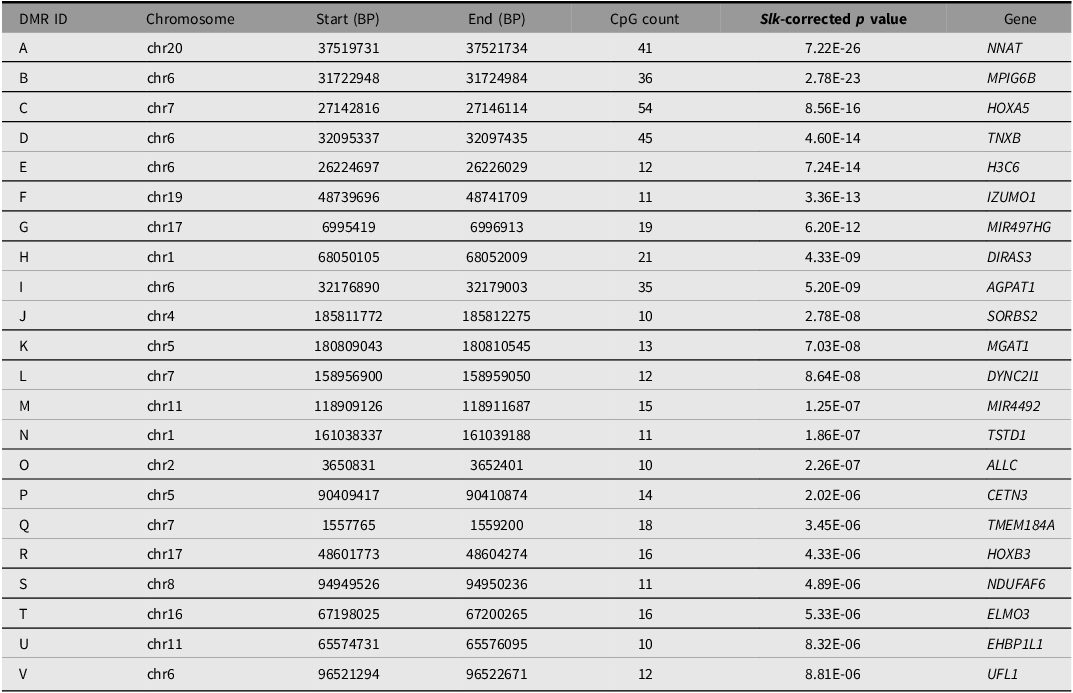
Analysis of differentially methylated regions. Table 4 shows that a total of 22 DMRs potentially related to SUA were identified in this study. Of these, 18 DMRs located in genes such as NNAT, MPIG6B, HOXA5, TNXB, H3C6, and IZUMO1 showed negative associations with SUA. No DMR demonstrated a significant positive association. The remaining four DMRs (G, K, P, and U) showed uncertain associations with SUA, and their directional effects could not be clearly determined (Figure 2).
The results of annotation to significant differentially methylated regions

Table 4 Long description
A table with 22 rows and 7 columns. The columns are labeled DMR ID, Chromosome, Start (BP), End (BP), CpG count, SII-corrected p value, and Gene. Each row lists data for a specific differentially methylated region (DMR). Row 1: DMR ID, A; Chromosome, chr20; Start (BP), 37519731; End (BP), 37521734; CpG count, 41; SII-corrected p value, 7.22E-26; Gene, NNAT. Row 2: DMR ID, B; Chromosome, chr6; Start (BP), 31722948; End (BP), 31724984; CpG count, 36; SII-corrected p value, 2.78E-23; Gene, MPIG6B. Row 3: DMR ID, C; Chromosome, chr7; Start (BP), 27142816; End (BP), 27146114; CpG count, 54; SII-corrected p value, 8.56E-16; Gene, HOXA5. Row 4: DMR ID, D; Chromosome, chr6; Start (BP), 32095337; End (BP), 32097435; CpG count, 45; SII-corrected p value, 4.60E-14; Gene, TNXB. Row 5: DMR ID, E; Chromosome, chr6; Start (BP), 26224697; End (BP), 26226029; CpG count, 12; SII-corrected p value, 7.24E-14; Gene, H3C6. Row 6: DMR ID, F; Chromosome, chr19; Start (BP), 48739696; End (BP), 48741709; CpG count, 11; SII-corrected p value, 3.36E-13; Gene, IZUMO1. Row 7: DMR ID, G; Chromosome, chr17; Start (BP), 6995419; End (BP), 6996913; CpG count, 19; SII-corrected p value, 6.20E-12; Gene, MIR497HG. Row 8: DMR ID, H; Chromosome, chr1; Start (BP), 68050105; End (BP), 68052009; CpG count, 21; SII-corrected p value, 4.33E-09; Gene, DIRAS3. Row 9: DMR ID, I; Chromosome, chr6; Start (BP), 32176890; End (BP), 32179003; CpG count, 35; SII-corrected p value, 5.20E-09; Gene, AGPAT1. Row 10: DMR ID, J; Chromosome, chr4; Start (BP), 185811772; End (BP), 185812275; CpG count, 10; SII-corrected p value, 2.78E-08; Gene, SORBS2. Row 11: DMR ID, K; Chromosome, chr5; Start (BP), 180809043; End (BP), 180810545; CpG count, 13; SII-corrected p value, 7.03E-08; Gene, MGAT1. Row 12: DMR ID, L; Chromosome, chr7; Start (BP), 158956900; End (BP), 158959050; CpG count, 12; SII-corrected p value, 8.64E-08; Gene, DYNC2I1. Row 13: DMR ID, M; Chromosome, chr11; Start (BP), 118909126; End (BP), 118911687; CpG count, 15; SII-corrected p value, 1.25E-07; Gene, MIR4492. Row 14: DMR ID, N; Chromosome, chr1; Start (BP), 161038337; End (BP), 161039188; CpG count, 11; SII-corrected p value, 1.86E-07; Gene, TSTD1. Row 15: DMR ID, O; Chromosome, chr2; Start (BP), 3650831; End (BP), 3652401; CpG count, 10; SII-corrected p value, 2.26E-07; Gene, ALLC. Row 16: DMR ID, P; Chromosome, chr5; Start (BP), 90409417; End (BP), 90410874; CpG count, 14; SII-corrected p value, 2.02E-06; Gene, CETN3. Row 17: DMR ID, Q; Chromosome, chr7; Start (BP), 1557765; End (BP), 1559200; CpG count, 18; SII-corrected p value, 3.45E-06; Gene, TMEM184A. Row 18: DMR ID, R; Chromosome, chr17; Start (BP), 48601773; End (BP), 48604274; CpG count, 16; SII-corrected p value, 4.33E-06; Gene, HOXB3. Row 19: DMR ID, S; Chromosome, chr8; Start (BP), 94949526; End (BP), 94950236; CpG count, 11; SII-corrected p value, 4.89E-06; Gene, NDUFAF6. Row 20: DMR ID, T; Chromosome, chr16; Start (BP), 67198025; End (BP), 67200265; CpG count, 16; SII-corrected p value, 5.33E-06; Gene, ELMO3. Row 21: DMR ID, U; Chromosome, chr11; Start (BP), 65574731; End (BP), 65576095; CpG count, 10; SII-corrected p value, 8.32E-06; Gene, EHBP1L1. Row 22: DMR ID, V; Chromosome, chr6; Start (BP), 96521294; End (BP), 96522671; CpG count, 12; SII-corrected p value, 8.81E-06; Gene, UFL1.
Note: Chr, chromosome; BP, base pair.
The plot of the different methylation patterns of the identified differentially methylated regions.

Figure 2 Long description
Panel A: A line graph shows methylation patterns with the x-axis labeled as position and the y-axis labeled as beta value. The graph includes a blue line representing the trend and shaded gray area indicating confidence intervals. Panel B: Another line graph displays similar data with distinct patterns. Panel C: This line graph shows a different methylation region with its unique trend. Panel D: The line graph here illustrates another region with noticeable variations. Panel E: This graph presents a distinct pattern with a clear trend line and confidence intervals. Panel F: The line graph shows a different methylation region with its specific trend. Panel G: This graph depicts another region with varying methylation patterns. Panel H: The line graph illustrates a unique trend in methylation. Panel I: This graph shows a distinct pattern with its trend line and confidence intervals. Panel J: The line graph presents another region with noticeable variations. Panel K: This graph depicts a different methylation region with its specific trend. Panel L: The line graph shows another region with varying patterns. Panel M: This graph illustrates a distinct trend in methylation. Panel N: The line graph presents another region with noticeable variations. Panel O: This graph depicts a different methylation region with its specific trend. Panel P: The line graph shows another region with varying patterns. Panel Q: This graph illustrates a distinct trend in methylation. Panel R: The line graph presents another region with noticeable variations. Panel S: This graph depicts a different methylation region with its specific trend. Panel T: The line graph shows another region with varying patterns. Panel U: This graph illustrates a distinct trend in methylation. Panel V: The line graph presents another region with noticeable variations.
Gene interaction network analysis. The resulting network comprised 51.31% physical interactions, 29.36% co-expression, and 19.28% genetic interactions (Figure S1). PKM and AGPAT1 showed co-expression; DOK6 and SUSD4 exhibited genetic interactions; NGLY1 and AKNAD1 also demonstrated genetic interactions; TAOK2 and PKM displayed physical interactions; and NGLY1 and ALLC shared common protein domains.
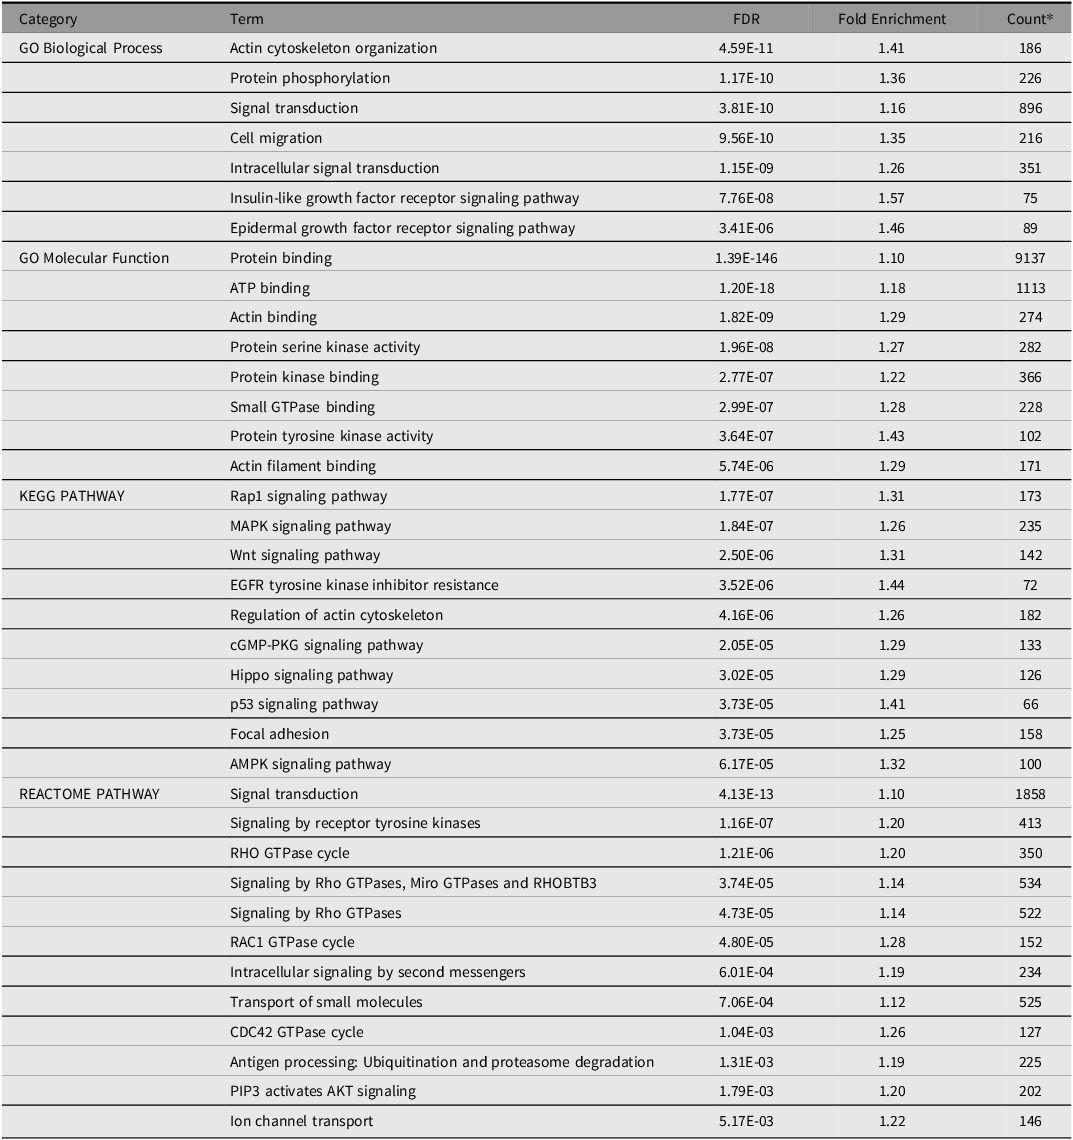
Functional enrichments analysis. Enrichment analysis identified many key pathways potentially related to SUA, hyperuricemia, or gout (Table 5), such as protein phosphorylation, ATP binding, AMPK signaling pathway, MAPK signaling pathway, Wnt signaling pathway and transport of small molecules.
The DAVID ontology enrichments potentially related to SUA

Table 5 Long description
The table presents functional enrichments analysis with three main categories: GO Biological Process, GO Molecular Function, and KEGG PATHWAY. It has 42 rows and 5 columns. The columns are labeled Term, FDR, Fold Enrichment, and Count. The table lists various terms under each category along with their corresponding FDR values, fold enrichment, and count. For example, under GO Biological Process, terms include Actin cytoskeleton organization, Protein phosphorylation, and Signal transduction. Under GO Molecular Function, terms include Protein binding, ATP binding, and Actin binding. Under KEGG PATHWAY, terms include Rap1 signaling pathway, MAPK signaling pathway, and Wnt signaling pathway. Each term is associated with specific values for FDR, Fold Enrichment, and Count.
Note: *The number of genes annotated to this function or pathway.
Differential Gene Expression Analysis
The baseline characteristics of the subsample are presented in Table S3. The median (P 2.5, P 97.5) age of 46 pairs of MZ twins was 61 (52.00, 77.00) years and the median (P 2.5, P 97.5) SUA level was 321.00 (233.93, 468.42) μmol/L.
Among the genes examined (Table S4), the expression levels of 11 genes showed significant associations with SUA. Specifically, the expression levels of genes SLC44A1 (β = −34.99), AGPAT1 (β = −8.44), MPIG6B (β = −2.27), PKM (β = −1.17), DOK6 (β = −37.87), and NGLY1 (β = −9.17) were negatively associated with SUA levels, whereas ADORA2A (β = 3.77) and UBALD2 (β = 0.47) were positively associated with SUA levels.
Quantitative Methylation Analysis of Candidate Genes
Based on the results of EWAS, causal inference, and differential gene expression analyses, DOK6, NGLY1, PKM, and SLC44A1 were identified as candidate genes. Across these four genes, a total of five CpGs met the significance threshold of FDR < 0.05 and were further examined in longitudinal analyses. We found that the causal direction for all candidate genes was consistently from SUA to DNAm. Therefore, we evaluated the association between baseline SUA (2012–2013) and follow-up CpG methylation levels (2023–2024).
Ultimately, of the five CpGs, three loci, cg25071680 in DOK6, cg11750789 in NGLY1 and cg23699147 in DOK6, were verified to be affected by baseline SUA levels (Table S5).
Discussion
Based on MZ twin samples, we identified 70 CpGs, 22 DMRs, and 92 genes associated with SUA levels, along with several related biological pathways in this study. Additionally, our causal analyses suggested a potential causal association between SUA and the identified CpGs. We further found that 11 genes showed significant associations with SUA at the gene expression level. Moreover, in the follow-up cohort, we observed that SUA affected the methylation levels of the candidate genes, particularly DOK6 and NGLY1. These findings deepen our understanding of the relationship between SUA and epigenetic regulation and suggest that SUA may influence DNAm levels at loci within DOK6 and NGLY1. This may provide new insights into the epigenetic mechanisms underlying diseases associated with SUA levels.
Previous epigenetic studies on SUA have primarily focused on how CpG methylation influences SUA levels, rather than the reverse direction (Leask et al., Reference Leask, Crișan, Ji, Matsuo, Köttgen and Merriman2024; Tin et al., Reference Tin, Schlosser, Matias-Garcia, Thio, Joehanes, Liu, Yu, Weihs, Hoppmann, Grundner-Culemann, Min, Kuhns, Adeyemo, Agyemang, Ärnlöv, Aziz, Baccarelli, Bochud, Brenner and Köttgen2021). For example, Mendelian randomization analyses have shown that increased promoter methylation at SLC2A9 suppresses its expression, thereby reducing urate transport and elevating circulating SUA concentrations (Tin et al., Reference Tin, Schlosser, Matias-Garcia, Thio, Joehanes, Liu, Yu, Weihs, Hoppmann, Grundner-Culemann, Min, Kuhns, Adeyemo, Agyemang, Ärnlöv, Aziz, Baccarelli, Bochud, Brenner and Köttgen2021). However, studies examining whether SUA itself can induce changes in DNAm remain scarce. One study involving 85 healthy participants reported that urate exposure can remodel the epigenetic landscape of monocytes and whole blood, suggesting that urate-induced epigenetic alterations in bone marrow-derived cells may contribute to the pathogenesis of gout (Badii et al., Reference Badii, Gaal, Cleophas, Klück, Davar, Habibi, Keating, Novakovic, Helsen, Dalbeth, Stamp, Macartney-Coxson, Phipps-Green, Stunnenberg, Dinarello, Merriman, Netea, Crişan and Joosten2021). Consistent with this study, our findings also revealed SUA-induced changes in DNAm, particularly at DOK6 and NGLY1, and these associations were further validated in longitudinal analyses. Together, these results indicate a potential bidirectional relationship between SUA and epigenetic regulation. This highlights the potential interplay between SUA and epigenetic modifications and provides new insights into the mechanisms underlying SUA-related diseases, warranting further investigation.
Several CpGs located in genes such as DOK6, FAT3 and PKM showed positive associations with SUA levels. Previous studies have shown that elevated SUA increases the risk of peripheral neuropathy in patients with type 2 diabetes, although the underlying mechanisms remain unclear (X. Zhang et al., Reference Zhang, Zhang, Li, Zhao, Wei, Shi, Yang, Fan, Zhao, Zhu, Du, Guo and Cao2024). Here, we observed that higher SUA levels were associated with increased DNAm at DOK6, with evidence suggesting a potential causal relationship. Given that DOK6 has been implicated in the pathogenesis of peripheral neuropathy, these findings provide new mechanistic insights into the link between SUA and the risk of neuropathy (Guo et al., Reference Guo, Xiang, Sun, Liu, Zhou, Yin, Hou, Qiang, Li, Shu and Peng2024). The uric acid precursor hypoxanthine can enter the purine salvage pathway via HPRT1, and hypoxanthine-mediated HPRT1 activation may promote the expression of downstream genes of relevant transcription factors, including FAT3, thereby inducing FAT3 expression (X. Li et al., Reference Li, Wang, Wang, Malovannaya, Xi, Li, Guerra, Hawke, Qin and Chen2015; Okajima et al., Reference Okajima, Gu, Teruya, Yano, Taketomi, Sato, Chiba and Tsuruta2020). PKM is highly expressed in nearly all cancers and regulates glycolysis to support tumor growth (Ma et al., Reference Ma, Voss, Scharner, Costa, Lin, Jeon, Wilkinson, Jackson, Rigo, Bennett and Krainer2022). Our study suggests that elevated SUA increases PKM methylation, which may affect its expression or activity, promoting metabolic reprogramming and proliferation of cancer cells (Voss et al., Reference Voss, Kral, Sim, Utama, Lin, Cizmeciyan, Schafer, Cunniff, Vakoc, Caruthers, Mishra and Krainer2025). These findings indicate that targeting purine metabolism or PKM epigenetic modifications could represent potential therapeutic strategies.
We also identified a negative association between SUA and CpG methylation in genes such as NGLY1, and MTCH2. Our study suggests a potential unidirectional causal relationship between SUA and NGLY1, which differs to some extent from findings reported in previous studies. Loss of NGLY1 disrupts mitophagy, leading to pronounced mitochondrial fragmentation and impaired mitochondrial function (K. Yang et al., Reference Yang, Huang, Fujihira, Suzuki and Yan2018). Reduced mitochondrial activity diminishes ATP production, resulting in AMP accumulation and potentiating uric acid production via purine breakdown (J. Li, Yin et al., Reference Li, Yin, Wen, Liang, Yang, Ju, Liu, Tong and Cai2025). However, the effect of SUA on NGLY1 DNAm and the underlying molecular mechanisms remain unclear and warrant further investigation. MTCH2 has been linked to reduced HDL levels and several metabolic disorders, including metabolic syndrome. Genetic variants near MTCH2 may influence purine metabolism and energy balance, thereby affecting uric acid accumulation (Peng et al., Reference Peng, Yang, Hou, Zhang, Shen, Yang, Luo, Yin and Cao2024). However, the associations between SUA and other genes, such as SLC44A1, TAOK2, and TAAR2 have not been well investigated and warrant further research.
Using the ICE FALCON method, we found that the selected candidate genes, including DOK6, NGLY1, PKM, and SLC44A1, exhibited a unidirectional causal relationship from SUA to DNAm. This relationship, particularly for DOK6 and NGLY1, was further supported by longitudinal analyses, offering new insights into SUA-related epigenetic alterations. GeneMANIA analysis further showed that PKM physically interacts with LDHB, DOK6 is co-expressed with PLEKHA6, and NGLY1 has genetic interactions with AKNAD1. LDHB regulates lactate production in β-cells to maintain insulin secretion (Fan et al., Reference Fan, Wu, Zhao, Yuan, Ma, Zhu, Chen, Ding, Yi and Chen2021), while AKNAD1 plays an essential role in the development of type 2 diabetes (Dajani et al., Reference Dajani, Li, Wei, Glessner, Chang, Cardinale, Pellegrino, Wang, Hakooz, Khader, Sheshani, Zandaki and Hakonarson2015). Given the well-documented relationship between SUA and type 2 diabetes (Hu et al., Reference Hu, Rong, Wang, Sun, Bao, Chen and Liu2021), these findings further support the biological relevance of the DNAm-SUA associations identified in this study.
A major strength of this study is its MZ twin-based design, in which we applied the ICE FALCON method to clarify the directionality and nature of the relationship between CpG methylation and SUA levels, and further validated the identified candidate CpGs in a longitudinal cohort. These findings provide valuable insights into epigenetic modifications related to SUA.
Nonetheless, several limitations should be acknowledged. First, due to the rarity and difficulty of recruiting twin samples, the overall sample size was relatively small compared with ordinary case-control studies. However, the discordant-twin design greatly enhances analytical efficiency, offering higher statistical power compared with more conventional observational frameworks such as cross-sectional or case-control studies. According to our previous research, SUA levels in this population exhibited moderate heritability (W. Wang et al., Reference Wang, Zhang, Xu, Wu, Duan, Li and Tan2018). In the present study, with a sample of 50 twin pairs, the estimated statistical power was approximately 80% (W. Li et al., Reference Li, Christiansen, Hjelmborg, Baumbach and Tan2018). Second, although we made every effort to control for confounding, the influence of unknown or unmeasured factors cannot be fully ruled out. Finally, although ICE FALCON method provides a useful framework for exploring causal hypotheses, it relies on strong assumptions and has been subject to methodological criticism (Sjölander & Frisell, Reference Sjölander and Frisell2024). Therefore, further studies are needed to confirm these findings. However, the longitudinal validation in our study strengthens the robustness of the causal inference.
Conclusions
Our analysis identified CpGs, genomic regions, genes, and pathways associated with SUA levels. We demonstrated that SUA and DNAm patterns may have a causal relationship. Longitudinal analyses further confirmed that SUA influences the methylation levels of DOK6 and NGLY1. These findings provide valuable evidence for further investigating the association between SUA and epigenetic modifications related to SUA.
Supplementary material
To view supplementary material for this article, please visit https://doi.org/10.1017/thg.2026.10063.
Data availability
Reasonable requests for access to the datasets generated and/or analyzed in this study can be made to the corresponding author.
Acknowledgments
Not applicable.
Author contributions
R.Y., W.W., X.T. and D.Z. contributed to the conception and design of the study. W.W. and J.L. collected, entered and validated the medical data. R.Y. and J.L. performed the statistical analysis. R.Y. wrote the first draft of the manuscript. W.W., X.T. and D.Z. revised the manuscript. All authors met the ICMJE criteria for authorship and approved the final manuscript for submission.
Funding
This study was funded by the National Natural Science Foundation of China (Grant No. 82073641).
Competing interests
The authors declare no competing interests.
Ethics approval
All participants provided written informed consent, and the study protocol was reviewed and approved by the Regional Ethics Committee of the Qingdao Center for Disease Control (Approval No. 2012-01; Date: 2012-01-20). The research adhered to the principles outlined in the Declaration of Helsinki.