Introduction
The prevalence of psychological distress rises through early adulthood, peaks in middle age and declines subsequently (Snowdon, Reference Snowdon2001; Jorm et al. Reference Jorm, Windsor, Dear, Anstey, Christensen and Rodgers2005; Blanchflower & Oswald, Reference Blanchflower and Oswald2008). This general pattern of peak prevalence in midlife has also been shown for the common ‘neurotic’ disorders including depression (Snowdon, Reference Snowdon2001; Jorm et al. Reference Jorm, Windsor, Dear, Anstey, Christensen and Rodgers2005) and anxiety (Jorm et al. Reference Jorm, Windsor, Dear, Anstey, Christensen and Rodgers2005) in the general population.
Mental health is also known to be strongly associated with material deprivation. A systematic review of epidemiological studies of the prevalence of common mental disorders in disadvantaged socio-economic groups found that low income was the most important single marker statistically explaining socio-economic group differences (Fryers et al. Reference Fryers, Melzer and Jenkins2003) and meta-analysis has demonstrated a strong dose–response relationship between income and prevalence of depression (Lorant et al. Reference Lorant, Deliege, Eaton, Robert, Philippot and Ansseau2003).
Studies of the relationship between age and psychological distress have adjusted for the effects of income differences within populations but have not assessed whether the age relationship differs at different levels of income (Blanchflower & Oswald, Reference Blanchflower and Oswald2008). We hypothesized that the midlife peak in measured psychological distress and common mental illness prevalence would be higher in low-income groups and reduced or absent in higher-income groups. Our aim was to estimate prevalences of a range of markers across the adult age range within household income groups. To do this we used data from a nationally representative study with a very large sample that includes measures of psychological distress as well as histories of reported common mental illness and receipt of prescribed psychiatric medication.
Method
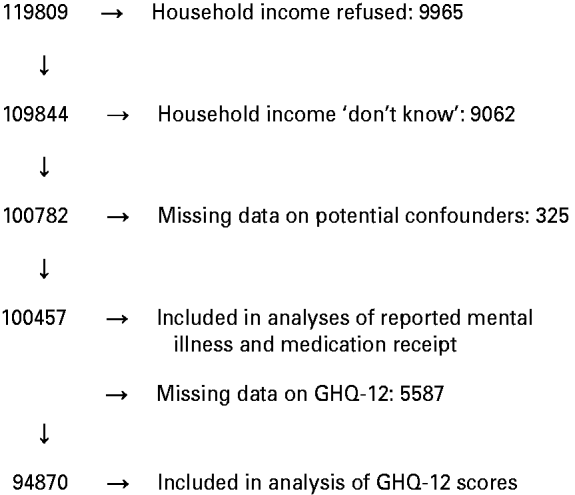
Data for this study came from consecutive waves of the Health Survey for England (HSE). The HSE is a nationally representative survey of individuals aged ⩾2 years living in households in England. Each year a new sample is drawn and respondents are interviewed about several core topics including demographic and socio-economic indicators, general health and psychosocial indicators and use of health services. HSE data are publicly accessible as part of the Data Archive of the UK Economic and Social Data Service (www.esds.ac.uk). We downloaded and combined data on income and mental health for 119 809 individuals aged ⩾16 years who participated in the HSE in each year from 1997 to 2006. Of these individuals, 100 457 had data on household income, mental health outcomes and potential confounders and were used in those analyses and 94 870 had complete 12-item General Health Questionnaire (GHQ-12) scores. Fig. 1 contains a flowchart showing selection for inclusion in the study. Mean response rate to the HSE over the years included here was 69%.
Flowchart showing inclusion in the study of individuals aged ⩾16 years from Health Surveys for England 1997–2006. GHQ-12, 12-item General Health Questionnaire.

Exposures
Each participant's age on their last birthday was recorded. For each household, one participant answered questions on behalf of the household about all sources of income (earnings, pensions, welfare benefits, income from investments and other income). They were then shown a card and asked to select, from a range of grouped incomes, the group representing the total income for the household prior to tax deductions. Groups were given as weekly, monthly and annual amounts. As annual incomes (£), the groups were <520, 520–1600, 1600–2600, 2600–3600, 5200–7800 and by intervals of 2600 up to 36 400, 36 400–41 600 and by intervals of 5200 up to 52 000, 52 000–60 000 and then by intervals of 10 000 up to 150 000 and ⩾150 000. To compare the effects of different levels of income, we split responses by quintiles. Because the incomes of individuals differ by age, we calculated income quintiles specific to 5-year age bands. To test the sensitivity of our model, we repeated analyses with income scores equivalized using the McClements scale, i.e. adjusted for the number of potential income earners and dependants in the household (McClements, Reference McClements1978).
Outcome measures
The HSE uses GHQ-12 to assess levels of psychological distress (Goldberg & Williams, Reference Goldberg and Williams1998). The GHQ-12 comprises 12 questions in which respondents are asked about their general level of happiness, experience of depressive and anxiety symptoms and sleep disturbance over the preceding 4 weeks. The questionnaire is intended for self-administration and was administered as part of the HSE in a self-completion booklet. Answers are given on a 4-point response scale and we assigned a score of 0 to responses of ‘not at all’, ‘same as usual’ and ‘more than usual’ and a score of 1 for ‘much more than usual’. In keeping with previous usage of this test, we took a score of ⩾4 to indicate a high GHQ-12 score (Prior et al. Reference Prior, Teers, Brookes and Primatesta2002).
Respondents were asked: ‘Do you have any longstanding illness, disability or infirmity? By longstanding, I mean anything that has troubled you over a period of time, or that is likely to affect you over a period of time?’ Those who replied that they did were asked what was wrong with them and prompted to report any additional problems. Responses were categorized into 42 possible illnesses or conditions and these are contained in the HSE dataset. We assigned respondents a score of 1 if they reported a longstanding problem with mental illness, anxiety or depression, i.e. related to psychological distress, and 0 otherwise.
As part of the HSE interview a nurse recorded the prescribed medications that individuals received, including the British National Formulary (BNF) code for each. We grouped together medications with the BNF codes 4.1.2 (anxiolytics), 4.2.1 (antipsychotics) and 4.3 (antidepressants). In each case, we assigned respondents a score of 1 if they received medication and 0 otherwise.
In addition to age and gender, analyses were adjusted for potential confounders associated with income and psychological distress:
• Education (Gallo et al. Reference Gallo, Royall and Anthony1993): categorized as age of completion of continuous full-time education (⩽14, 15, 16, 17, 18, ⩾19 years).
• Occupational social class (Jenkins et al. Reference Jenkins, Lewis, Bebbington, Brugha, Farrell, Gill and Meltzer1997): the class of the head of household in one of the seven categories of the UK National Statistics Socio-Economic Classification: professional; managerial-technical; skilled non-manual; skilled manual; semi-skilled manual; unskilled manual; other.
• Race/ethnicity (Jackson-Triche et al. Reference Jackson-Triche, Greer Sullivan, Wells, Rogers, Camp and Mazel2000): categorized by self-description as white, Asian or Asian British, black or black British and Chinese or other ethnic group.
• Smoking (Bergen & Caporaso, Reference Bergen and Caporaso1999; Lasser et al. Reference Lasser, Boyd, Woolhandler, Himmelstein, McCormick and Bor2000): categorized as current smoker, ex-regular smoker or non-smoker.
• Number of co-morbidities (Dickey et al. Reference Dickey, Normand, Weiss, Drake and Azeni2002): categorized as the number of reported diagnosed long-term conditions aside from mental health conditions.
Statistical analysis
Analyses were conducted using Stata SE 9.2 (Stata Corp LP, USA). We used logistic regression to estimate odds ratios and 95% confidence intervals (CI) for each of our outcomes of interest, separately for men and women. Analyses were done separately within age group (in 10-year bands) and by age-specific household income split by quintiles. All models were adjusted for the potential confounders described above and treated as if clustered within HSE years and analyses took into account the complex sampling strategy of the HSE.
Results
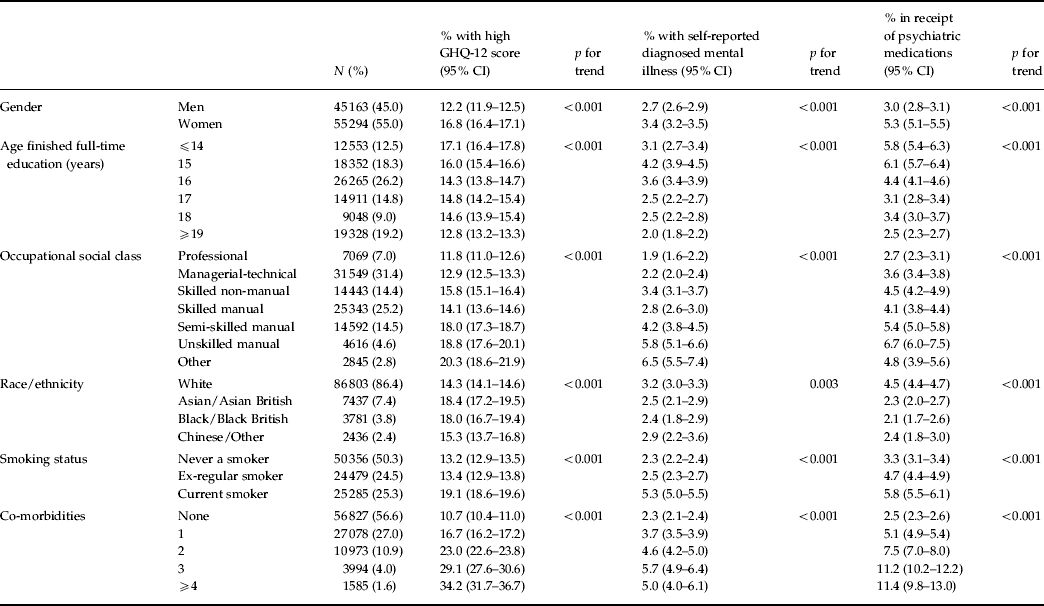
Characteristics of the sample population and proportions with high GHQ-12 scores, with self-reported diagnosed mental illness, and in receipt of psychiatric medications by category are presented in Table 1. These proportions were higher in women, in those who had completed fewer years of full-time education, in those with lower occupational social class, in current smokers compared with ex-smokers or those who had never smoked and in those with more co-morbidities. Proportions were higher in those who described their ethnicity as Asian, Asian British, black or black British than in those who said they were white, Chinese or of some other ethnicity. The mean age of men was 46.7 years (95% CI 46.6–46.8) and of women was 47.8 (95% CI 47.6–47.9).
Characteristics of sample showing proportion with high 12-item General Health Questionnaire (GHQ-12) score with self-reported diagnosed mental illness and in receipt of psychiatric medication

Percentages may not sum to 100 because of rounding.
A high GHQ-12 score indicates a score of ⩾4 out of 12; psychiatric medications are those with British National Formulary codes 4.1.2 (anxiolytics), 4.2.1 (antipsychotics), and 4.3 (antidepressants).
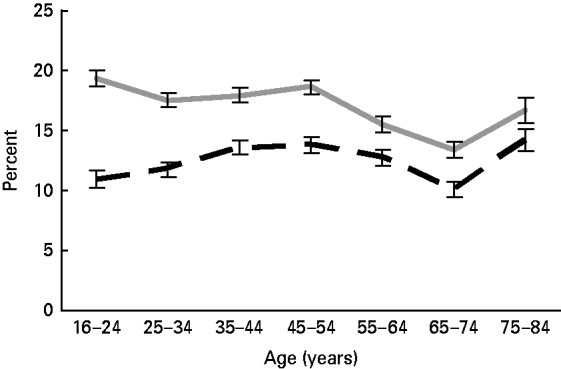
The overall association between age and high GHQ-12 scores (score ⩾4) in men and women is presented in Fig. 2. In men, the pattern of association showed a prevalence rising from young adulthood to midlife and falling subsequently, with the lowest levels in the 65–74 year age group. In women, the highest prevalence was in the 16–24 year age group but there was a second peak in the 45–54 year group followed by a decline with age, with the lowest level in the 65–74 year age group.
Prevalence of high 12-item General Health Questionnaire scores (⩾4) by gender and age group (years). , Men;
 , women.

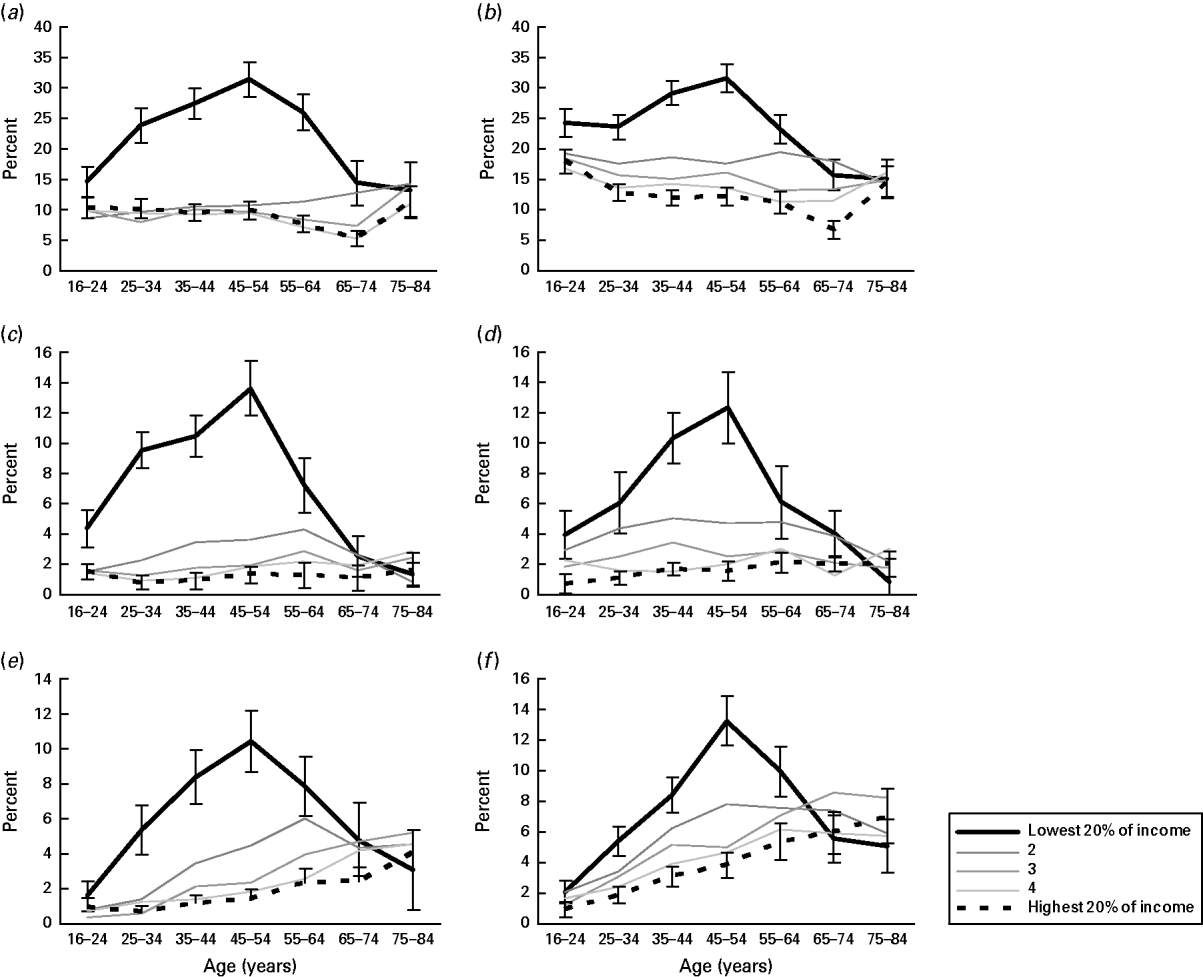
Fig. 3 presents unadjusted graphs of the relationships between age group, income category and each of our outcomes of interest: high GHQ-12 score; reported mental illness; receipt of psychiatric medications. For clarity, 95% CI are shown only for the highest and lowest income categories. Distributions were similar for each outcome and for both men and women, with a marked peak in levels of psychological distress in low-income groups and the highest levels in the 45–54 year group. There was no evidence of a comparable peak in the middle- or high-income categories. The midlife peak in psychological distress in the lowest income group represents the greatest absolute difference in prevalence between the highest and lowest income categories.
Proportion of individuals with outcomes of interest, by gender. (a) Men with 12-item General Health Questionnaire (GHQ-12) score ⩾4; (b) women with GHQ-12 score ⩾4; (c) men with reported mental illness; (d) women with reported mental illness; (e) men in receipt of psychiatric medication; (f) women in receipt of psychiatric medication.

In models adjusted for age, gender, race/ethnicity, level of education, social class and smoking status, peak differences between upper and lower income groups for all outcomes occurred in either the 35–44 or the 45–54 year age groups. Odds ratios of adverse outcomes in relation to income category were slightly higher in men than in women. The greatest differences were around reporting of mental illness. For men aged 35–44 years, the odds ratio for reporting mental illness associated with being in the lowest compared with the highest income group was 16.8 (95% CI 9.2–30.6). In women, the difference was greatest in the 45–54 year age group and the corresponding odds ratio was 10.3 (95% CI 6.2–17.1). Within age groups, there was a dose–response relationship between income category and our outcomes of interest. (Full results are available from the authors on request.)
To test the sensitivity of our models to different ways of categorizing income, we reran them with income scores equivalized using the McClements scale. This produced outcomes very similar to those in our main models, with the same peak in midlife. Analyses were also rerun with different cut-points on the GHQ-12 score; with the cut-point set at 3 or at 5 instead of 4, outcomes were very similar. To test the effect of including those for whom household income data were missing, participants with missing income data were included in models in three ways, with their income assigned as being in the top, middle and bottom income categories. The differences between the top and bottom income categories were attenuated when the missing data were imputed in these categories but there was no evidence to suggest this item non-response was driving the overall patterns observed. (All results are available from the authors on request.)
Discussion
We found a midlife peak in the prevalence of psychological distress, diagnosed common mental disorders and receipt of psychiatric medications that was specific to low-income groups. Increased prevalence rates of psychological distress, diagnosis and treatment in midlife, with subsequent improvement, occur only in individuals in low-income households and do not represent a universal phenomenon. The gap between low- and high-income groups for all three outcomes was most marked in the midlife period.
These results are significant because we know that, in middle-aged and older people, depressive symptoms make a large and unique contribution to risks of disability, poor health perception and absence from the labour force (Ormel et al. Reference Ormel, Kempen, Deeg, Brilman, van Sonderen and Relyveld1998). The importance of population mental health to public health is increasingly being recognized (Prince et al. Reference Prince, Patel, Saxena, Maj, Maselko, Phillips and Rahman2007) and the results presented here highlight a gross level of health inequality. Crucially, they suggest that the claimed ‘universal’, and by implication unavoidable, increased prevalence of psychological distress in midlife is not universal and is therefore potentially preventable and amenable to intervention. Interventions targeted at those in the most vulnerable groups may be useful in addressing the midlife peak in psychological distress.
This study has a number of strengths. One is its very large size, which allows us to split the sample into age and income groups of adequate size for analysis. Another is the range of outcome measures used: measured psychological distress; reported longstanding mental health problems such as depression and anxiety; receipt of psychiatric medication. The fact that outcomes are consistent across these outcomes indicates the robustness of the findings.
There are two areas in which future research can improve on what has been done in this study. First, we used cross-sectional data and so the inferences we can draw are limited. It is unclear whether middle-aged people are more likely to experience mental health problems because of their low incomes or whether their low incomes are brought about because of their mental health problems. Although reverse causation is possible, i.e. psychological distress may lead to lower incomes rather than vice versa, the decline in problems observed after midlife make this interpretation less likely because it is unclear why those with mental health problems should see their incomes improve between midlife and old age. Longitudinal data will help us to understand this relationship better. They will also help us to explore why, in low-income households, people seem to suffer poorer mental health as they age from young adulthood into midlife but then to experience fewer problems as they move from midlife to old age. Second, and related to the first point, we cannot tell from these results whether we are observing a true age effect or whether a period or cohort effect is operating. Again, longitudinal data will help to clarify this, although one reason for using cross-sectional data here was that there are currently no longitudinal studies with the duration and breadth of coverage to allow us to conduct an analysis similar to the one in this study. Research that replicates these analyses in other settings will also be valuable.
Our findings are in line with observations that mental health disorders are more common in lower income groups (Lorant et al. Reference Lorant, Deliege, Eaton, Robert, Philippot and Ansseau2003; Mangalore et al. Reference Mangalore, Knapp and Jenkins2007). However, previous studies on the relationship between age and mental health have not discriminated by level of income. These findings, showing an age-related effect and a midlife peak in mental health problems limited to those in low-income groups, add considerable detail to our understanding of this relationship. Our results controvert recent findings on middle-aged public sector employees in the UK and Finland, which failed to find associations between common mental disorders, assessed with the GHQ-12, and income, social class or education (Lahelma et al. Reference Lahelma, Laaksonen, Martikainen, Rahkonen and Sarlio2006; Laaksonen et al. Reference Laaksonen, Martikainen, Lahelma, Lallukka, Rahkonen, Head and Marmot2007). It is possible that the lack of associations found in those studies relates to the use of data on individuals in relatively well-paid employment, omitting those with lower incomes whom we found to be most affected by mental health problems.
Why the patterns presented here emerge is unclear. We suggest three avenues of inquiry that further work in this area might usefully explore. First, development theories have characterized midlife not only as a period of stressful turmoil and transitions but also of heightened sense of control and ability to cope with stress (Aldwin & Levenson, Reference Aldwin, Levenson and Lachman2001; Staudinger & Bluck, Reference Staudinger, Bluck and Lachman2001). Observational evidence spans findings of increased prevalence of depression and anxiety in midlife (Snowdon, Reference Snowdon2001; Jorm et al. Reference Jorm, Windsor, Dear, Anstey, Christensen and Rodgers2005; Brockman, Reference Brockman2010) and high levels of well-being in midlife (Keyes & Ryff, Reference Keyes, Ryff, Willis and Reid1999). Some social-psychological theories suggest that older people are more inclined to seek emotional meaning from life and less inclined to attempt to expand their horizons in other ways (Carstensen et al. Reference Carstensen, Isaacowitz and Turk-Charles1999; Charles et al. Reference Charles, Reynolds and Gatz2001). Baltes (Reference Baltes1987) argued that development in adulthood involved achieving a balance between gains and losses and midlife could be characterized as involving physical losses and psychological and social gains (Lachman et al. Reference Lachman, Lewkowicz, Marcus and Ping1994). Individuals of working age in households with low incomes will typically be in monotonous low-status jobs or will be unemployed, both situations known to be associated with higher levels of stress and poorer resilience (Marmot et al. Reference Marmot, Smith, Stansfeld, Patel, North, Head, White, Brunner and Feeney1991; Dooley et al. Reference Dooley, Fielding and Levi1996; Ferrie et al. Reference Ferrie, Shipley, Marmot, Stansfeld and Smith1998; Cropley et al. Reference Cropley, Steptoe and Joekes1999). Given these and other socio-economic status differences in vulnerability to undesirable life events (McLeod & Kessler, Reference McLeod and Kessler1990), it may be that those with low levels of socio-economic and other resources – represented by those in the lowest income group in our analysis – struggle most to achieve this balance and suffer most, in psychological terms, in consequence.
Second, the consequences of being in a low socio-economic position and of having mental health problems may combine to effectively remove affected individuals from view. Common mental disorders are known to increase the risk of physical health problems. For example, depression elevates the risk of morbidity and mortality from cardiovascular (Barefoot & Schroll, Reference Barefoot and Schroll1996; Ramasubbu & Patten, Reference Ramasubbu and Patten2003) and other diseases (Mykletun et al. Reference Mykletun, Bjerkeset, Dewey, Prince, Overland and Stewart2007), increasing risk of disablement in late middle age (van Gool et al. Reference van Gool, Kempen, Penninx, Deeg, Beekman and van Eijk2005) and anxiety is associated with fatal coronary heart disease, especially sudden cardiac death (Kawachi et al. Reference Kawachi, Sparrow, Vokonas and Weiss1994). [Notably, depression predicts mortality in the ‘young old’ but not the oldest old (Rapp et al. Reference Rapp, Gerstorf, Helmchen and Smith2008) and it is possible that something similar differentiates midlife from later life.] We also know that some psychoactive drugs used to treat common mental disorders, such as benzodiazepine, are associated with increased risk of unintentional injuries (Barbone et al. Reference Barbone, McMahon, Davey, Morris, Reid, McDevitt and MacDonald1998). These effects, combined with the links between poor health and low socio-economic status noted above, will tend to increase levels of physical morbidity in the middle-aged who have mental disorders as well as low incomes. We can imagine some effects of this on participation in studies such as those from which the data used here come. In those with mental disorders and low incomes, we observed some of the effects of premature mortality, which are likely highest in this group, and in those with poor mental health and low income and of morbidity related to serious mental or physical disease, which leads to study non-participation. Thus, to some extent we may be seeing a survival effect when we make cross-sectional observations of those in the lowest income group who live, and act as study participants, past middle age. Although this is unlikely fully to explain the patterns observed here, it is likely to play a role of uncertain size.
Third, and as suggested above, what we have observed may not be an effect related to a particular period of life but may be a cohort effect or a period effect. Recent work on the baby boom generation has identified aspects of the shared life experience of this cohort associated with particular aspects of their physical (Rice et al. Reference Rice, Lang, Henley and Melzer2010) and mental (Almeida et al. Reference Almeida, Serido, McDonal, Whitbourne and Willis2006; Jones et al. Reference Jones, Whitbourne, Skultety, Whitbourne and Willis2006; Skaff, Reference Skaff, Whitbourne and Willis2006) health and it may be that these effects are most marked in those with low socio-economic status. These factors may create the effects we have seen in ways that will not be replicated in subsequent generations and it is important that we establish whether this is the case.
These findings suggest scope for clinical or public health intervention where previously there seemed to be none. If there had been some underlying psycho-biological factor that meant people at midlife experienced heightened susceptibility to psychological distress, then there might be little that clinicians could do to counter these problems. If, on the other hand, increased psychological distress at midlife is limited to certain population subgroups, then it is much more likely that what we are observing is a potentially preventable sociocultural phenomenon rather than an inevitable psycho-biological one. Although these findings will benefit from confirmation in other populations, they present a hopeful picture in that we can attempt to identify appropriate interventions to prevent and treat midlife psychological distress rather than regarding it as unavoidable.
Acknowledgements
Dr Lang is funded by NIHR, the UK National Institute for Health Research, as part of PenCLAHRC, the Peninsula Collaboration for Leadership in Applied Health Research and Care. This paper presents independent research and the views expressed are those of the authors and not necessarily those of the NHS, the NIHR or the Department of Health.
Declaration of Interest
None.