INTRODUCTION
Parasitological research, although firmly grounded in fieldwork, has benefited from recent advances in analytical technologies applied to profiling biological extracts or samples obtained from the parasite and host organisms. Perturbations in the metabolic composition of tissues, biofluids or cell media can uncover information relating to the concentrations and fluxes of metabolites through pathways that reflect the mechanism of action of a parasite either in vitro or in the host environment. High-resolution spectroscopic platforms such as mass spectrometry (MS) and nuclear magnetic resonance (NMR) spectroscopy are particularly suited to generating metabolic fingerprints from complex biological samples. The development of mathematical modelling algorithms and network analysis software for analysing, interpreting and visualising ‘omic’ data have also contributed to the practical application of metabolic profiling technology to parasite research. A brief summary of the evolution of metabolic profiling in parasitology is given and the relative benefits and limitations of key analytical platforms and data analysis strategies are discussed in relation to the application of metabolomic and metabonomic technology to developing diagnostics, unravelling molecular mechanisms underlying parasitic infection and to monitoring control and treatment programmes at the individual and population levels.
TECHNOLOGIES FOR METABOLIC PROFILING
Spectroscopic platforms
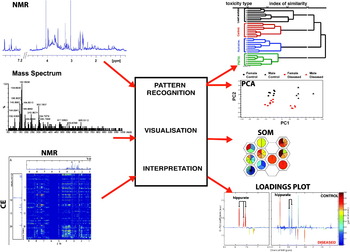
A wide variety of spectroscopic and analytical platforms exist with the capacity to generate metabolic profiles directly from biological samples. Key technologies that have found application within parasite research in a diagnostic capacity or in exploring mechanisms of action of particular parasitic species include nuclear magnetic resonance (NMR) spectroscopy, capillary electrophoresis (CE) and various forms of MS with or without chromatographic separation (Fig. 1). Spectroscopy generally involves the measurement of the emission or absorption of energy by matter. An explanation of the theory of the spectroscopic techniques discussed is beyond the scope of this review, but is well-described in many reference works e.g. Grant and Harris (Reference Grant and Harris1996) for NMR spectroscopy and Gross and Caprioli (Reference Gross and Caprioli2003) for MS. NMR spectroscopy exploits the magnetic features of certain nuclei with the property of spin and the signals generated from a chemical mixture reflect the local environment of each atom within a molecule. The signal intensity is directly proportional to the concentration of the chemical group detected and the shape and splitting pattern, as well as the position of the signal on the chemical registration scale, all contain information regarding molecular structure. Nuclei that have been applied to measuring parasite or host composition or responses include 31P, 13C, 15N and 1H with other nuclei such as 19F being applied to specific studies e.g. characterizing the metabolism of fluorinated chemotherapeutics. Whilst NMR spectroscopy is an excellent analytical tool for molecular structural identification, making identification of biomarkers relatively easy, it lacks sensitivity in comparison with MS technology. Much of the early MS work in parasitology was performed using gas chromatography (GC)-MS, for example determination of parasite glycoconjugates (Ferguson and Homans, Reference Ferguson and Homans1988; McConville and Blackwell, Reference McConville and Blackwell1991) or fatty acids and sterols (Weber et al. Reference Weber, Vosmann, Aitzetmüller, Filipponi and Taraschewski1994). Databases for metabolite identification have been well developed for GC-MS and it remains one of the most useful platforms in post-genomic metabolic profiling. Liquid chromatography (LC)-coupled MS systems have also been employed successfully for metabolic profiling, although there are fewer examples of applications in parasitology. Nevertheless, the development of ultra-performance liquid-chromatography (UPLC)-MS systems, using smaller sorbent particle sizes (<2 μm) than conventional HPLC systems, offer significant analytical improvement, being inherently more sensitive, giving a more rapid separation and thereby reducing the total acquisition time and improving sample throughput (Plumb et al. Reference Plumb, Castro-Perez, Granger, Beattie, Joncour and Wright2004). Another emerging MS tool in parasitology is the Orbitrap Fourier transform (FT) platform, which delivers a high accuracy mass, making metabolite identification in biological samples more tractable than other MS profiles. Coupled with a hydrophilic interaction chromatography (HILIC) column, the rapid elimination of lipids allows a strong profile of metabolites such as the trypanosome-specific trypanothione to be collected (Kamleh et al. Reference Kamleh, Barrett, Wildridge, Burchmore, Scheltema and Watson2008). Capillary electrophoresis (CE), which operates on separation of molecules on the basis of their charge-to-mass ratio, is also an emerging player in the suite of analytical technologies applied to metabolic profiling. CE has the advantage of being relatively inexpensive to acquire and run but relies heavily on databases for metabolite identification. Nevertheless, the ongoing development of such databases and the coupling of CE to MS should increase the utility of this method in the near future. In a study of profiling urine from mice infected with Schistosoma mansoni, CE was found to have a similar capacity to profiling as NMR spectroscopy (Wang et al. Reference Wang, Holmes, Nicholson, Cloarec, Chollet, Tanner, Singer and Utzinger2004; García-Pérez et al. Reference García-Pérez, Whitfield, Bartlett, Angulo, Legido-Quigley, Hanna-Brown and Barbas2008).
Schematic showing examples of common spectral inputs and model outputs used in metabolic profiling studies. Different types of spectral data (e.g. NMR, UPLC-MS, CE) are modelled using a range of multivariate techniques, which each have advantages and limitations in terms of characterization of pathology, visualisation of samples and ease of extraction of discriminatory metabolites or potential biomarkers of a particular infection. Self organising mapping is a type of artificial neural network that allows organisation of the data according to a property of interest in a 2-dimensional space. Hierarchical cluster analysis is typically an unsupervised approach to generating a hierarchy of clusters of objects based on a calculated similarity matrix, the shorter the branch length, the more similar the objects are. PLS-DA (Partial Least Squares Discriminant Analysis) uses classification information to maximise the differential between two or more classes of objects and is typically displayed as scores plots (showing the similarity between objects – the nearer two coordinates are, the more similar the spectra) and coefficient plots (indicating the contribution of the variables, or metabolites in differentiating the classes).

Although various different analytical platforms are utilized for profiling of small molecules, MS methods occupy pole position in proteomic analysis. The complete genome sequences for several parasitic species are now available and there is a drive towards generating proteomic data to match. Whilst traditional proteomic methods relied on the use of two-dimensional gel electrophoresis followed by mass spectrometry or N-terminal sequencing of key proteins on an individual basis, newer mass spec based methods are being developed involving the simultaneous characterization of peptides using high resolution liquid chromatography coupled with tandem mass spectrometry (LC/LC-MS/MS) (Carrucci et al. Reference Carucci, Yates and Florens2002). Coverage of proteomics is beyond the scope of this review but applications include identification of different species and stages of the life cycles of parasites and determination of host-parasite interactions (Cooper and Carucci, Reference Cooper and Carucci2004; Johnson et al. Reference Johnson, Florens, Carucci and Yates2004; Liu et al. Reference Liu, Cui, Hu, Feng, Wang and Han2009). This body of research should progress the understanding of parasite biology and ultimately lead to identification of new therapeutic or vaccine targets.
Analysis and interpretation of spectral data
The generation of high density spectral data delivers molecular fingerprints that can be used in a diagnostic or exploratory capacity is the backbone of metabolic profiling. However, these complex data require careful processing and computational analysis in order to extract systematic multiparameter responses. The profiling of multivariate responses over time to characterize a response to a biological stimulus such as infection, genetic modification or therapeutic intervention led to the term metabonomics, developed largely from the NMR spectroscopic research in the 1980s (Nicholson et al. Reference Nicholson, Lindon and Holmes1999). The related field of metabolomics, grounded in the GC-MS community and concerned more with extensive molecular characterization of biological samples (Fiehn, Reference Fiehn2002) was developed in parallel. In order to interpret the complex spectral data, multivariate statistical and mathematical modelling tools were adapted and developed, including methods such as the linear projection methods (Trygg et al. Reference Trygg, Holmes and Lundstedt2007) e.g. principal components analysis (PCA) or partial least squares discriminant analysis (PLS-DA), and Bayesian probabilistic methods (Webb-Robertson et al. Reference Webb-Robertson, McCue, Beagley, McDermott, Wunschel, Varnum, Hu, Isern, Buchko, Mcateer, Pounds, Skerrett, Liggitt and Frevert2009). These mathematical modelling techniques allow characterization, prediction and visualisation of the ‘omic’ data and also enable rapid detection of outliers or anomalous responses. Superimposed on these primary multivariate methods are a series of data preprocessing and filtering methods. For example, it is generally necessary to align spectral data and to normalise the spectra to an internal or external standard. The metabolic profiling literature is flooded with technical papers describing such methods (e.g. Duran et al. Reference Duran, Yang, Wang and Sumner2003; Katajamaa and Oresik, Reference Katajamaa and Oresic2005; Chae et al. Reference Chae, Shmookler Reis and Thaden2008; Vesselkov et al. Reference Veselkov, Lindon, Ebbels, Crockford, Volynkin, Holmes, Davies and Nicholson2009). Other functions used to simplify data interpretation include curve resolution and fitting to ‘clean’ the spectral profile and diminish background noise (Thysell et al. Reference Thysell, Pohjanen, Lindberg, Schuppe-Koistinen, Moritz, Jonsson and Antti2007; Richards et al. Reference Richards, Wang, Lawler, Kochhar, Holmes, Lindon and Nicholson2008), and orthogonal filtration, to remove parts of the data matrix unrelated to the biological focus. For instance, if the greatest biochemical variation in a host-parasite data set is influenced predominantly by gender or age then the effect of the parasite can be obscured against the background variation. Orthogonal filtration enables subdivision of the spectral matrix into components that vary systematically with parasitic infection and the remaining data relating to other primary sources of variation (Trygg and Wold, Reference Trygg and Wold2002). At the other end of the data analysis pyramid is the requirement to display and interpret the data in the wider context of the whole system and to model interactions between the disparate levels of ‘omics’ data. Here the field of bioinformatics makes a strong contribution (Lacroix et al. Reference Lacroix, Cottret, Thébault and Sagot2008) and network analysis is currently being liberally applied in parasite-related experiments and models (e.g. Breitling et al. Reference Breitling, Vitkup and Barrett2008; Scheltema et al. Reference Scheltema, Kamleh, Wildridge, Ebikeme, Watson, Barrett, Jansen and Breitling2008; Doyle et al. Reference Doyle, MacRae, De Souza, Saunders, McConville and Likić2009; Roberts et al. Reference Roberts, Robichaux, Chavali, Manque, Lee, Lara, Papin and Buck2009) to provide biological maps of both parasite and host metabolism. It is hoped that the impressive array of technology applied to understanding host-parasite biology will result in generation of new therapeutic targets and development of sustainable control strategies for parasites but requires a firm anchoring in the more practical aspects of parasitology conducted through extensive field work.
APPLICATION OF SPECTROSCOPIC TOOLS TO CHEMOTHERAPY
Traditionally NMR spectroscopy was used as a pure structural elucidation tool and one of its most common uses was to confirm the structure and purity of synthesized drugs. Within parasitology, spectroscopy has been widely applied to characterizing therapeutics from both synthetic and natural product-derived sources. Examples of NMR-characterized chemicals displaying anti-parasitic activity include novel sesquiterpenes, aignopsanoic acid, methyl aignopsanoate and isoaignopsanoic acid from Cacospongia mycofijiensis in northern Papua New Guinea, which demonstrated activity against Trypanasoma brucei (Johnson et al. Reference Johnson, Amagata, Sashidhara, Oliver, Tenney, Matainaho, Ang, McKerrow and Crews2009). Cyclic alkyl polyol derivatives e.g. 4,6,2′-trihydroxy-6-[10′(Z)-heptadecenyl]-1-cyclohexen-2-one isolated from the bark of the Tapirira guianensis tree, used in traditional medicine in French Guiana, demonstrated anti-leishmanial, anti-plasmodial and anti-bacterial properties based on Staphylococcus aureus, Staphylococcus epidermidis and Escherichia coli systems (Roumy et al. Reference Roumy, Fabre, Portet, Bourdy, Acebey, Vigor, Valentin and Moulis2009). Other antiparasitic substances with NMR-confirmed molecular structures include tricyclic guanidine alkaloids extracted from the marine sponge Monanchora unguifera with activity against Plasmodium falciparum and Leishmania donovani (Hua et al. Reference Hua, Peng, Fronczek, Kelly and Hamann2004) and antimalarial compounds from root bark of Garcinia polyantha (Lannang et al. Reference Lannang, Louh, Lontsi, Specht, Sarite, Flörke, Hussain, Hoerauf and Krohn2008).
Mass spectrometry has also occupied a prominent position in the isolation and identification of chemotherapeutic compounds in parasitology. Using GC-MS, the sesquiterpene nerolido was identified as an active constituent of the essential oil obtained from the adult leaves of Viola surinamensis, a plant used by the Waiãpi Indians in the Brazilian Amazon to treat malaria. Its activity was related to the inhibition of glycoprotein biosynthesis (Lopes et al. Reference Lopes, Kato, Andrade, Maia, Yoshida, Planchart and Katzin1999). The essential oil of Hexalobus crispiflorus, a Cameroonian plant traditionally used as an antimalarial was profiled using GC-MS technology and found to be potent against Plasmodium falciparum in culture (Boyom et al. Reference Boyom, Ngouana, Zollo, Menut, Bessiere, Gut and Rosenthal2003). Other examples of elucidation of natural products include assessment of the chemical composition of the volatile essential oil of Artemisia annua using two-dimensional GC-ToF-MS (Ma et al. Reference Ma, Wang, Lu, Li, Liu and Xu2007) and identification of components of green tea (Camellia sinensis) catechins using HPLC with GC-MS with known activity against Trypanosoma cruzi (Paveto et al. Reference Paveto, Güida, Esteva, Martino, Coussio, Flawiá and Torres2004).
An extension of the profiling of natural products and synthesised compounds with antiparasitic properties is to explore structure-metabolism relationships for a series of related compounds. Using both NMR and MS tools to characterize the structures of nine alkaloids isolated from young leaves of Guatteria dumetorum, the growth-inhibitory capacity of each compound against Leishmania mexicana was determined. Potency was found to be positively associated with a methylenedioxy functionality, particularly at the 1,2-positions (Correa et al. Reference Correa, Ríos, del Rosario Castillo, Romero, Ortega-Barría, Coley, Kursar, Heller, Gerwick and Rios2006). Spectroscopic methods can also be used to determine molecular structural or behavioural properties such as pK(a) values. One such example was the determination of the PK(a) values for a series of indoloquinoline alkaloids, in view of their antimalarial activities using 1H NMR spectroscopy (Grycová et al. Reference Grycová, Dommisse, Pieters and Marek2009).
The use of natural products without isolation of the active chemical can lead to a wide discrepancy in the activity or potency of these products related to the high degree of variation in the product which is dependent on a variety of genetic and environmental factors including geographic location, macro- and micro-climate and age of plant etc. Spectroscopic tools have been shown to be capable of detecting differences in plant and animal materials sourced under different physiological and environmental conditions (Robosky et al. Reference Robosky, Wells, Egnash, Manning, Reily and Robertson2005; Holmes et al. Reference Holmes, Tang, Wang and Seger2006). In one such study applied to Artemesia annua, a plant with antmalarial activity against multidrug-resistant strains of Plasmodium falciparum, clear differences in the metabolic profile of plant extracts from different sources were found using 1H NMR spectroscopy. Moreover, the metabolic profiles generated were mathematically modeled and were predictive both of anti-plasmodial activity and of cytotoxicity (Bailey et al. Reference Bailey, Wang, Sampson, Davis, Whitcombe, Hylands, Croft and Holmes2004). Later 1H NMR studies have developed quantitative assays for artemisinin, the key active component of Artemesia annua, which is typically present in low concentrations (Castilho et al. Reference Castilho, Gouveia and Rodrigues2008).
There are several documented instances of counterfeit or impure therapeutics being sold, particularly in developing countries. For instance, there is a high prevalence of counterfeit tablets of the antimalarial artesunate found in southeast Asia. Liquid chromatography coupled with mass spectrometry strategies have been developed to detect ‘fake’ products containing the wrong active ingredients (Hall et al. Reference Hall, Newton, Green, De Veij, Vandenabeele, Pizzanelli, Mayxay, Dondorp and Fernandez2006; Sengaloundeth et al. Reference Sengaloundeth, Green, Fernández, Manolin, Phommavong, Insixiengmay, Hampton, Nyadong, Mildenhall, Hostetler, Khounsaknalath, Vongsack, Phompida, Vanisaveth, Syhakhang and Newton2009). Similarly in Myanamar, only 7 of 50 samples of a typical ‘mixed’ medicine product were found to contain curative medicine for malaria as determined via mass and atomic spectroscopy (Newton et al. Reference Newton, Hampton, Alter-Hall, Teerwarakulpana, Prakongpan, Ruangveerayuth, White, Day, Tudino, Mancuso and Fernández2008).
The bioavailability and metabolism of drugs can also be easily monitored using spectroscopy. Bioavailability studies have been conducted on mefloquine (P. falciparum) in humans employing electron-capture negative-ion chemical ionization GC-MS assay to assess the quantification in plasma following administration of both liquid and tablet forms. The method demonstrated good sensitivity and reproducibility with a mean intra- and inter-day variation of <4·5 and 5·5% respectively (Neal et al. Reference Neal, Howald, Kunze, Lawrence and Trager1994). HPLC-MS has similarly been applied to profiling artesunate and its primary active metabolite dihydroartemisinin (Karunajeewa et al. Reference Karunajeewa, Ilett, Dufall, Kemiki, Bockarie, Alpers, Barrett, Vicini and Davis2004). Substantial inter-patient variability was observed and the bioavailability of the second dose relative to the first was found to be 0·72. Similar pharmacokinetic studies on dihydroartemisinin have also been conducted via HPLC-based methods in other populations including Africa and Asia (Mithwani et al. Reference Mithwani, Aarons, Kokwaro, Majid, Muchohi, Edwards, Mohamed, Marsh and Watkins2004). A natural progression from bioavailability and pharmacokinetic studies is to consider metabolism of drugs and therapeutics. Here again spectroscopic tools have a clearly defined role to play in the elucidation of drug metabolites. The metabolism of deoxoartemisinin, a semisynthetic antimalarial with potential for treatment of multiple drug-resistant malaria, was investigated using 1H and 13C-NMR spectroscopy in both microbial and rat model systems. Three microbial metabolites of deoxoartemisinin were identified in the microbial system, and two in the rat plasma, of which one metabolite was the same (Khalifa et al. Reference Khalifa, Baker, Jung, McChesney and Hufford1995). Another study using 31P NMR spectroscopy was used to evaluate the activity of anticancer therapeutic 2-deoxyglucose against a filarial infection of Acanthocheilonema viteae in a Mastomys coucha host (Shukla-Dave et al. Reference Shukla-Dave, Roy, Bhaduri and Chatterjee2000). An unusually long retention time of 2-deoxyglucose-6-phosphate along with a decrease in ATP levels was recorded.
Spectroscopic tools have also been extensively applied to the evaluation of the mechanism of action of drugs. For example, 19F, which has the advantage of having almost equal sensitivity to proton but additionally is not contained within endogenous molecules and so generates a ‘clean’ drug metabolite profile is commonly used in drug metabolism studies. The mechanism of erythrocyte accumulation of mefloquine (San George et al. Reference San George, Nagel and Fabry1984) and the stereochemistry of the carboxylation of phosphoenolpyruvate by Ascaris muscle phosphoenolpyruvate carbokinase (Hwang and Novak, Reference Hwang and Nowak1986) have been investigated using 19F NMR spectroscopy. 31P is also an effective nucleus for studying the effects of drugs and therapeutics on living organisms. Although less sensitive than either 1H or 19F, 31P profiles provide easy access to energy dependent pathways. Thus, for example, 31P profiling of the effect of risedronate on Cryptosporidium parvum growth was able to demonstrate inhibition of cell growth based on the profiled phosphomonoesters and nucleotide diphosphates (Moreno et al. Reference Moreno, Bailey, Luo, Martin, Kuhlenschmidt, Moreno, Docampo and Oldfield2001). Energy changes in several host systems in response to various antimalarials have also been shown (Moreno et al. Reference Moreno, Oatis and Schultz1972; Olsen, Reference Olsen1972).
In addition to investigating drug metabolism and bioavailbility, spectroscopic tools can be used to identify and monitor drug toxicity. Mefloquine is an FDA approved drug for the treatment of malaria and is often used in combination with artesunate. However, adverse neurological effects have been associated with this therapeutic. Mass spectrometry was used to profile and quantify plasma mefloquine and was related to endpoints associated with impairment of motor activity and degeneration of brain stem nuclei (Dow et al. Reference Dow, Bauman, Caridha, Cabezas, Du, Gomez-Lobo, Park, Smith and Cannard2006).
PROFILING OF THE BIOCHEMICAL COMPOSITION OF PARASITES AND IN VITRO PARASITE SYSTEMS
The biochemical composition and metabolism of several parasites in vitro have been studied using NMR profiling techniques. Early metabolic profiling of parasites tended to use 31P or 15N nuclei to map metabolic processes related to energy metabolism. For a human filarial (Brugia malayi) infection in the host Mastomys coucha, detection of parasites was achieved using 1H magnetic resonance imaging and related to the composition of metabolites in the parasite and the host as determined via 31P high-resolution spectroscopy (Shukla-Dave et al. Reference Shukla-Dave, Degaonkar, Roy, Murthy, Murthy, Raghunathan and Chatterjee1999). GPC, the major phospholipid and PEP, the major energy reservoir were present in high concentrations in B. malayi. Sugar phosphates and phosphatemonoesters were found to be decreased in the testis of animals infected with the parasite indicating changes in bioenergetics and phospholipids metabolism. 31P NMR spectroscopy has also been applied in an in vivo flow mode whereby viability of the nematode Steinernema carpocapsae was maintained by continuous circulation of oxygen in the spectrometer, which enabled the kinetics for the interconversion of phosphoarginine to adenosine triphosphate to be calculated (Thompson et al. Reference Thompson, Platzer and Lee1992). A similar 31P-NMR spectroscopic strategy has been applied to studying the metabolism of intact helminth parasites Ascaris suum (intestinal roundworm) and Fasciola hepatica (liver fluke) (Rohrer et al. Reference Rohrer, Saz and Nowak1986). Changes in the concentrations of sugar phosphates but not ATP/ADP were observed. In an extension of this study, the effect of the drug closantel on a F. hepatica infection was studied and found to be predominantly characterized by a decrease in glucose 6-phosphate.
One example of the application of 15N NMR spectroscopy is the study of nitrogen metabolism in Angiostrongylus cantonensis eggs where 15N-aspartic acid was shown to act as an amino group donor for both 2-oxoglutaric-glutamic acid and the pyruvate-alanine transamination systems (Nishina et al. Reference Nishina, Hori, Matsushita, Takahashi, Kato and Ohsaka1990).
Plasmodium falciparum is one of the most studied parasites. In a 1H NMR screen of extracts prepared from the mature trophozoite-stage in parasites isolated by saponin-permeabilisation of the host erythrocyte over 50 metabolites were identified, of which 40 were quantified using four different extraction methods (Teng et al. Reference Teng, Junankar, Bubb, Rae, Mercier and Kirk2009). The major metabolite classes included alpha-amino acids, 4-aminobutyrate, mono-, di- and tri-carboxylic acids polayamines polyols and membrane components such as phosphocholine and phosphoethanolamine.
The metabolism of labeled substrates by parasites has been studied using NMR spectroscopy for several decades. Much of the current understanding of plasmodial metabolism derives from early biochemical studies. More recently techniques such as 13C NMR spectroscopy have been employed to elucidate products of glucose metabolism using D-[1-13C] glucose (Lian et al. Reference Lian, Al-Helal, Roslaini, Fisher, Bray, Ward and Biagini2009). Major metabolites identified in infected erythrocytes e.g. [1,3-13C] glycerol and [3-13C] glycerol-3-phosphate were not found in uninfected erythrocytes incubated under identical conditions. This confirmed suggestions based on transcriptomic and proteomic studies that energy metabolism in Plasmodium falciparum is more complex than originally thought and may represent a metabolic adaptation to growth in O2-limited conditions.
The end products of glycolysis of Leishmania donovani in both the amastigote and promastigote forms have been studied via 1H NMR analysis of the media, wherein alanine, succinate and acetate were found to be the key metabolites with lesser quantities of lactate, pyruvate and glycine generated (Castilla et al. Reference Castilla, Sanchez-Moreno, Mesa and Osuna1995). Likewise, tissue extracts of perchloric acidocalcisomes – storage organelles for calcium and phosphate were evaluated in Trypanosoma brucei, T. cruzi and Leishmania major using 31P NMR spectroscopy – high levels of di- tri- tetra- and pentapolyphosphates suggesting they play a critical role in these parasites (Moreno et al. Reference Moreno, Urbina, Oldfield, Bailey, Rodrigues and Docampo2000). Using advanced metabolic profiling technology involving the coupling of hydrophilic chromatography (HILIC) to Orbitrap Fourier transform mass spectrometry (FT-MS), in vitro procyclic forms of Trypanosoma brucei were profiled and a range of ‘signature’ molecules of the parasite such as trypanothione and glutathione were detected (Kamleh et al. Reference Kamleh, Barrett, Wildridge, Burchmore, Scheltema and Watson2008). The relative uptake and metabolism of different substrates can also be efficiently modelled. In a study investigating the metabolism of Trypanosoma brucei in an in vitro system, L-proline metabolism in the glucose rich and glucose depleted medium was investigated using 13C NMR spectroscopy and showed that trypanosomes can adapt their energy production pathways in response to carbon source availability (Coustou et al. Reference Coustou, Biran, Breton, Guegan, Rivière, Plazolles, Nolan, Barrett, Franconi and Bringaud2008).
PROFILING OF THE HOST METABOLIC STATUS
In order to understand parasite biology, and to identify potential targets for infection control, it is advantageous to understand not only the biology of the parasite, but also that of the host or hosts. Therefore, much effort has been expended in metabolically defining various host systems. Here again spectroscopic tools have a valuable role to play. Studies have been conducted purely to characterize the metabolic status of host species, with particular attention being paid to mosquito vectors of malaria and dengue. For example, a MS-based study was performed on the mitochondria of Anopheles stephensi to profile metabolic pathways that may have relevance to understanding ageing and response to insecticides in this species (Giulivi et al. Reference Giulivi, Ross-Inta, Horton and Luckhart2008). The proline pathway in this mosquito species differed from mammalian mitochondrial metabolism in that oxoglutarate was catabolised by either the tricarboxylic acid cycle or transamination depending on ATP requirement.
Early pilot studies applied NMR and MS technology to elucidating the response of the host to various parasitic infections. Such studies include a 1H NMR analysis of the metabolite profile in human serum in patients with malaria (Nishina et al. Reference Nishina, Hori, Matsushita, Takahashi, Kato and Ohsaka1988) and 1H and 31P NMR studies on blood from murine systems experimentally infected with malaria (Deslauriers et al. Reference Deslauriers, Ekiel, Kroft and Smith1982; Reference Deslauriers, Geoffrion, Butler and Smith1985). In another study exploring the effect of a Plasmodium berghei infection in a rodent model, T1 and T2 relaxation properties were used to explore the changes in liver triglycerides, which were further modified in fasted animals (Desluriers et al. Reference Deslauriers, Somorjai, Geoffrion, Kroft, Smith and Saunders1988). A more detailed characterization of the triglyceride content of the liver was achieved using a targeted GC assay wherein both malaria-infected and fasted mice showed a four-fold increase in phospholipids content.
In Mesocestoides vogae-infected mice, the infected livers had higher concentrations of glycine, choline species, alanine and lactate than controls and lower concentrations of glucose at both 24 and 133 days post-infection (Blackburn et al. Reference Blackburn, Hudspeth and Novak1993). Additionally, at day 133 those animals with a heavy infection showed evidence of higher concentrations of succinate and taurine with lower levels of acetate than controls.
More recent studies have set out to explore the effect of parasitic infection of specific host pathways. The effect of Trichinella spiralis infection on the cerebral pyruvate recycling pathway was investigated in the mouse using 13C-labelled acetate as a substrate detected by 13C-NMR (Nishina et al. Reference Nishina, Suzuki and Matsushita2004). The consequences of the parasitic infection on energy metabolism were also investigated in parallel using 31P-NMR spectroscopy. The study showed that T. spiralis infection induced hypoglycaemia in the host but that cerebral levels of ATP remained unaffected. A combination of 1H-NMR and 31P-NMR were applied to generate metabolic profiles of Echinococcus multilocularis cysts grown subcutaneously and intraperitoneally in Meriones unguiculatus (Novak et al. Reference Novak, Hameed, Buist and Blackburn1992). The cysts grown in the abdominal cavity were found to contain lower concentrations of glucose and phosphocreatine but more succinate, acetate, alanine and 3-D-hydroxybutyrate than subcutaneous cysts. A similar study used D-(1-13C)glucose with 13C NMR monitoring to investigate metabolism in Hymenolepis diminuta-infected and uninfected Tenebrio molitor beetles (Schoen et al. Reference Schoen, Modha, Maslow, Novak and Blackburn1996). Infected beetles contained less glycerophosphocholine and more glycogen than controls. In addition to glucose, labelled trehalose, alanine, succinate and lactate were detected. Complementary in vitro experiments suggested that the trehalose was of parasite and not beetle origin.
Metabolic profiling methods can be used in either a hypothesis generating mode, where a broad screen is undertaken with no prerequisite for selection of molecular analytes, or in a hypothesis testing mode whereby a particular molecular pathway or class is selected for targeted analysis. Modulation of the tryptophan and kynurenine pathways have been implicated in cerebral malaria. A HPLC-GC-MS-MS method was applied to brain extracts from mouse models of cerebral and non-cerebral malaria to detect metabolites of the kynurenine pathway (Sanni et al. Reference Sanni, Thomas, Tattam, Moore, Chaudhri, Stocker and Hunt1998). Kynurenine and quinolinic acid were increased in both cerebral and non-cerebral models of malaria but increased at an earlier stage post-infection in the cerebral malaria model.
Several metabolic profiling studies have focused on elucidating the molecular profiles of intermediate vectors or hosts such as mosquitos or snails. An exemplar study is that of Kittayapong and colleagues who compared a vector and a non-vector strain of Anopheles mosquito using GC analysis of cuticular lipids. The GC chromatograms of n-hexane extracts showed no qualitative differences between strains but did manifest quantitative differences in the concentration of 5 compounds belonging to saturated and unsaturated free fatty acids and n-alkanes (Kittayapong et al. Reference Kittayapong, Clark, Edman, Potter, Lavine, Marion and Brooks1990). Another study of intermediate hosts involved the application of 31P NMR to characterize the metabolic profile of the digestive gland-gonad complex (DGG) of Biomphalaria galbrata, a vector for Schistosoma mansoni (Thompson and Lee, Reference Thompson and Lee1987). The in vivo spectrum was dominated by phosphatides, carbamoyl phosphate, sphingomyelin, phosphonate, nuleotide di- and triphosphate, uridine diphosphoglucose, ceramide, sugar phosphates, phosphoryl choline and glycerophosphoryl choline. Infection induced a reduction in the levels of phosphonate, phospholipids and carbamoyl phosphate. In addition to the direct effects of infection, indirect effects can also be studied. Thus, the metabolic effects of starvation of B. galbrata snails were also assessed. Here a similar decrease in phosphonate was observed but none of the other infection-associates changes (Thompson and Lee, Reference Thompson and Lee1986). In another study by Thompson et al. in vivo 31P NMR was used to explore the difference between S. mansoni infected and non-infected Biomphalaria galbrata snails. The foot of the infected snails had a lower phosphoarginine to adenosine triphosphate than non-infected snails (Thompson et al. Reference Thompson, Lee, Mejia-Scales and Shams el-Din1993).
A major development in metabolic profiling technology is the use of advanced mathematical modelling methods for analysis and interpretation of spectroscopic data. Computer-based pattern recognition algorithms have been applied to various host-parasite systems and initial studies were mainly concerned with the characterization of the metabolic response of the host to parasitic infection, as manifested in biofluid samples (e.g. urine, serum, faeces), in order to explore the potential of the analytical technologies as diagnostic platforms. Both 1H NMR spectroscopy (Wang et al. Reference Wang, Holmes, Nicholson, Cloarec, Chollet, Tanner, Singer and Utzinger2004) and capillary electrophoresis (CE) (Garcia-Perez et al. Reference García-Pérez, Whitfield, Bartlett, Angulo, Legido-Quigley, Hanna-Brown and Barbas2008; Angulo et al. Reference Angulo, García-Pérez, Legido-Quigley and Barbas2009) have been coupled to multivariate statistical analysis methods to characterise a Schistosoma mansoni infection in a murine host system. The two profiling methods overlap in the subset of molecules detected but additionally generate a unique subset making the two technologies complementary in terms of their diagnostic capacity. Both technologies detected Schistosoma-induced perturbation of energy metabolism (e.g. decreased urinary citrate excretion), gut microbial metabolism and liver metabolism as evidenced by decreased hippurate concentrations and increased phenylacetylglycine, amongst other metabolites. In addition to the core set of metabolic perturbations CE identified urate, urea and isocitrate, whereas compounds such as trimethylamine and 2-oxoisocaproate were unique to the NMR fingerprints. In an extension of this initial study, the metabolic response of several other hosts to helminthic and protozoan infections were characterized, including Schistosoma japonicum in hamster urine and serum (Wang et al. Reference Wang, Utzinger, Xiao, Xue, Nicholson, Tanner, Singer and Holmes2006) and Echinostoma caproni in the mouse (Saric et al. Reference Saric, Li, Wang, Keiser, Bundy, Holmes and Utzinger2008).
IDENTIFICATION OF HOST-PARASITE INTERACTIONS AT THE MOLECULAR LEVEL
Since metabolic profiling methods can be applied to both host and parasite systems independently, an obvious step is to integrate the metabolic knowledge from both systems and to probe host-parasite interactions. High resolution electrospray mass spectrometry can also be used to achieve targeted analysis of molecules of interest. In one such study, a small heat-stable chromophore extracted from mosquitoes, that was implicated as the signal that induces mating of Plasmodium was identified as xanthurenic acid, a metabolite in the tryptophan pathway (Garcia et al. Reference Garcia, Wirtz, Barr, Woolfitt and Rosenberg1998). This metabolite was found to activate gametogenesis of P. falciparum and P. gallinaceum in vitro.
The co-evolution of host and parasite has resulted in the development of several biological strategies for co-existence. In a study where HPLC coupled to electrochemical detection and GC-MS. The composition of Ascaris suum was investigated and was found to contain the opiate alkaloid morphine, which was also found in the medium of the in vitro system. Since Ascaris does not express the opiate receptor, it was assumed that the function of the opiate synthesis and excretion related to the microenvironment rather than to the parasite (Gouman et al. Reference Goumon, Casares, Pryor, Ferguson, Brownawell, Cadet, Rialas, Welters, Sonetti and Stefano2000).
For obvious reasons relating to prevalence and severity, malaria is the most widely studied human parasitic disease and this is reflected also in the metabolic profiling literature, with cerebral malaria being of particular interest. Some of the recent advances in malaria diagnostics have been described in a review article by Hawkes and Kain (Reference Hawkes and Kain2007). The metabolic effects of malarial infection have been studied in a range of animal models and in man. Early NMR experiments using labelled substrates have also been employed to monitor differences in metabolism in malaria-infected hosts. Using [2-13C]pyruvate as a labelled substrate, the gluconeogenic activity was compared in perfused livers of mice with and without a P. berghei infection by 13C NMR spectroscopy (Geoffrien et al. Reference Geoffrion, Butler, Pass, Smith and Deslauriers1985). 13C labelling of glucose occurred in positions 1, 2, 5 and 6 regardless of infection but the degree of 13C labelling in glucose carbons was reduced in livers from malaria-infected animals indicating a reduced rate of hepatic gluconeogenesis. The flux of metabolites through the erythrocyte in anaerobic glycolysis has also been measured using 13C NMR. Glucose flux was shown to be several fold higher in human erythrocytes infected with Plasmodium falciparum and was proportional to the parasitaemia (Mehta et al. Reference Mehta, Sonawat and Sharma2005).
One metabolic profiling study showed that for a Plasmodium berghei ANKA infection in a mouse strain resistant to cerebral malaria, brain dysfunction was still observed using magnetic resonance imaging (Penet et al. Reference Penet, Kober, Confort-Gouny, Le Fur, Dalmasso, Coltel, Liprandi, Gulian, Grau, Cozzone and Viola2007). The aetiology of the brain dysfunction was assigned to secondary effects of anaemia and liver damage and was associated with abnormal brain choline profiles and perturbed glutamine, myo-inositol, glycine and alanine concentrations, thought to relate to hepatic encephalopathy.
Alterations in the levels of low molecular weight metabolites and cytokine expression have been reported, in addition to blood cell sequestration, as part of the human response to cerebral malaria. Multinuclear NMR spectroscopy has been used to profile brain tissue from a mouse model of cerebral malaria in comparison with three cytokine knockout strains (TNF(−/−); susceptible to cerebral malaria and IFNgamma(−/−) and LTalpha(−/−); resistant to cerebral malaria). The TNF(−/−) and wildtype susceptible strains manifested decreased utilisation of glucose, high-energy phosphates and tricarboxylic acid cycle intermediates although the levels of parasitaemia were comparable (Parekh et al. Reference Parekh, Bubb, Hunt and Rae2006). The increased glutamine and decreased phosphorylation potential in the susceptible mice implicates the immune response to the pathogenic metabolic alterations associated with cerebral malaria.
For many parasites, the host response relies on the phase of the parasite's developmental cycle. In a recent study a MS-based metabolomic approach was used to investigate the effect of Plasmodium falciparum in various phases of the intraerythrocyte developmental cycle (Olszewski et al. Reference Olszewski, Morrisey, Wilinski, Burns, Vaidya, Rabinowitz and Llinás2009). Some metabolites were modulated throughout all the phases whilst others were phase specific. The main finding of this study was the conversion of extracellular arginine to ornithine by the parasite, which may suggest that systemic arginine depletion plays a role in malarial hypoargininaemia associated with human cerebral malaria. The global metabolic response of P. berghei in NMRI mice has been investigated using 1H NMR spectroscopic profiling of biofluids (Li et al. Reference Li, Wang, Saric, Nicholson, Dirnhofer, Singer, Tanner, Wittlin, Holmes and Utzinger2008) and indicated a parasite-induced up-regulation of gylcolysis and a generalised increase in energy demand (increased plasma lactate and pyruvate with decreased glucose, creatine and glycerophosphocholine). The urine profile of P. berghei infected mice identified increased pipecolic acid as a marker and additionally uncovered alterations in a range of gut microbial metabolites and co-metabolites including methylamines and phenylacetylglycine.
Diagnostic biomarkers of parasitic infection can sometimes be used to monitor response to intervenion. The effect of therapeutic interventions on host-parasite metabolism have been profiled using various spectroscopic technologies. Following the administration of dichloroacetate, an activator of pyruvate dehydrogenase, to mice with murine cerebral malaria, 40% of the animals survived the normally lethal infection of Plasmodium berghei ANKA (Rae et al. Reference Rae, Maitland, Bubb and Hunt2000). NMR spectroscopy was used to show that dichoroacetate reduced brain levels of lactate and alanine and increased those of glutamine.
PRACTICAL SPECTROSCOPY AND TOWARDS SYSTEMS BIOLOGY
The application of post-genomic technologies (transcriptomics, proteomics, lipidomics and metabonomics) in parasitology has opened many avenues for deepening our understanding of parasite biology and of host-parasite interactions across the distinct bio-organisational levels in the host organism, and can aid in the identification of new drug targets and control strategies, or even provide a means of monitoring response to therapeutic intervention at the individual and population level. However, in terms of the applicability of these post-genomic technologies as diagnostic tools in developing countries, installation and operation of the analytical equipment required is expensive and often impractical. Therefore, in metabonomics, as for the other post-genomic disciplines, the major advantage lies in improving mechanistic knowledge of host-parasite interactions or in identifying panels of biomarkers that are specific to a given species of parasite and which can be transformed into a simple biochemical assay – ideally a dip stick or by using some of the newer lab-on-a-chip technology (Domschke et al. Reference Domschke, March, Kabilan and Lowe2006). There is however, an obvious role for metabolic profiling technology in the diagnostic arena. Although spectroscopic equipment is in general expensive and requires highly trained personnel for its operation, there may be scope for implementation of some of the less expensive platforms, for instance some of the basic HPLC-MS or CE platforms in key laboratories in developing countries. Tools such as high resolution NMR spectrometry and FT-MS can be used to optimise the recovery of biomarkers of infection, which can then be translated to less expensive technology. For example, the unique molecular structural elucidation properties of NMR spectroscopy can be applied to the analysis of easily accessible biofluids in well-defined laboratory host-parasite models to identify key signals in CE profiles (Angulo et al. Reference Angulo, García-Pérez, Legido-Quigley and Barbas2009). Many of the commonly used diagnostics of parasitic infection are fairly crude and involve the detection and quantification of parasites or their eggs in faeces or blood. These techniques, although practical and robust, often lack sensitivity and are time- and labour-intensive. Another major issue in developing countries is that multi-parasitism tends to be the norm rather than the exception (Guignard et al. Reference Guignard, Arienti, Freyre, Lujan and Rubinstein2000; Raso et al. Reference Raso, Vounatsou, Singer, N'Goran, Tanner and Utzinger2006; Steinman et al. Reference Steinmann, Du, Wang, Wang, Jiang, Li, Marti, Zhou and Utzinger2008) and thus a diagnostic, which can identify multiple species of infection simultaneously is highly desirable. Initial NMR and MS based screening of human populations to develop diagnostics for various parasite strains proved difficult due to the complexity of human metabolism, which is influenced by a vast number of genetic and environmental factors with infinite capacity for interaction (Singer et al. Reference Singer, Utzinger, Ryff, Wang, Holmes, Lindon, Nicholson and Holmes2007). This promoted the strategy for returning to laboratory-based host-parasite models and defining panels of biomarkers for a series of mono-infected host-parasite systems (Li et al. Reference Li, Wang, Saric, Nicholson, Dirnhofer, Singer, Tanner, Wittlin, Holmes and Utzinger2008, Reference Li, Holmes, Saric, Keiser, Dirnhofer, Utzinger and Wang2009; Wang et al. Reference Wang, Utzinger, Saric, Li, Burckhardt, Dirnhofer, Nicholson, Singer, Brun and Holmes2008; Saric et al. Reference Saric, Li, Wang, Keiser, Veselkov, Dirnhofer, Yap, Nicholson, Holmes and Utzinger2009). More recently, these laboratory studies have been extended to investigate models of co-infection with the ultimate aim of developing a diagnostic tool that accommodates the complexity of human populations. Although the complexity of human metabolic profiles can be daunting, conversely it is this very complexity and variability that offers huge potential in understanding pathological processes at the systems level. Not only does the metabolic signature of urine or serum provide information on the presence of infection, but can also contain parallel information on the nutritional status of an individual, genetic background and information regarding co-morbidities.
Thus, these metabolic signatures hold the key to being able to understand an individual's response or even predisposition to parasitic invasion and promote interpretation of response at the systems level. In tandem with rapid development of the analytical technologies for profiling genes, proteins and metabolites, new mathematical methods have been developed for analysis of such high density data and strategies for the systematic integration of ‘omic’ data may soon be able to achieve a significant leap forward in our understanding of human systems. Systematic integration of ‘omics’ data and application of network modelling tools will provide the optimal overview of the global biological status of an organism. Several new methods of visualising and co-analysing metabolic networks deriving from both the parasite and the host are being developed allowing a clearer picture of the pathological process and highlighting many new candidates for drug targets (Breitling et al. Reference Breitling, Pitt and Barrett2006, Reference Breitling, Vitkup and Barrett2008; Jourdan et al. Reference Jourdan, Breitling, Barrett and Gilbert2008). Molecular screening tools hold promise for population screening initiatives and will deliver a holistic read-out on the health of an individual incorporating information of the presence of infection, the nutritional status and even the response of an individual to therapeutic intervention. There is some preliminary evidence derived from pilot studies that, based on the metabolic phenotype of an individual, their response to drug metabolism can be predicted (Clayton et al. Reference Clayton, Baker, Lindon, Everett and Nicholson2009).
The prospect of being able to conduct global metabolic screening in the developing world and to understand more fully the equilibrium between host and parasite is an exciting and achievable goal. By judicious integration of ‘omic’ technologies with mathematical modelling and bioinformatics tools, we should be able to translate new mechanistic knowledge into practical solutions to control and treatment of parasitic infections and to combat developing drug resistance.