


Introduction
End tidal CO2 (ETCO2) monitoring provides a non-invasive assessment of a patient's ventilatory status and its application has been well established in certain clinical scenarios. It is the standard of care for clinical monitoring of adult and pediatric patients undergoing general anesthesia,Reference Caplan, Vistica, Posner and Cheney1-Reference Cheney, Posner, Lee, Caplan and Domino3 is used extensively in the intensive care unit to monitor mechanical ventilation,Reference Rozycki, Sysyn, Marshall, Malloy and Wiswell4, Reference Morley, Giaimo, Maroszan, Bermingham, Gordon and Griesback5 and is widely accepted as a critical tool to confirm proper endotracheal intubation and airway patency.Reference Ward and Yealy6, Reference Silvestri, Ralls, Krauss, Thundiyil, Rothrock and Senn7 Capnography has also been extensively utilized and validated in the prehospital setting for patients requiring cardiopulmonary resuscitation and emergency cardiovascular care.Reference Falk, Rackow and Weil8, Reference Liu, Lee and Bongard9 In the post-operative setting, ETCO2 has been used to detect sedation-induced hypoventilation, bronchospasm, and apnea.Reference Soto, Fu, Vila and Miguel10, Reference Krauss and Hess11 Many studies have also demonstrated a close correlation between ETCO2 and the partial pressure of arterial CO2 (PaCO2) in certain patient populations.Reference Fuke, Miyamoto, Ohira, Ohira, Odajima and Nishimura12-Reference Sanders, Kern, Costantino, Stiller and Strollo14 As a result, ETCO2 monitoring is increasingly being used by emergency medical providers in the prehospital setting to guide ventilation as a substitute for serial PaCO2.Reference Warner, Cuschieri, Garland, Carlbom, Baker and Copass15
Early and effective management of the acutely injured patient to avoid hypotension and hypoxia are of paramount importance in reducing morbidity and mortality. Proper ventilation strategies for those patients intubated in the prehospital setting improves their outcome, especially for those suffering from traumatic brain injuries (TBIs).Reference Chesnut, Marshall and Klauber16 It has been suggested that the ideal range for PaCO2 during early ventilation of the traumatized patient is between 30mm Hg and 39 mm Hg.Reference Warner, Cuscheri, Copass, Jurkovich and Bulger17 This prevents significant hypercapnea as well as hypocapnea, both of which have detrimental effects on cerebral perfusion and secondary brain injury following TBI.Reference Davis, Idris and Sise18 Due to the limited capability for prehospital providers to perform serial PaCO2, many emergency medical system (EMS) protocols advocate for the titration of ventilation by keeping ETCO2 values between 30 mm Hg and 35 mm Hg.Reference Salomone, Pons and McSwain19 This is based upon the close correlation of ETCO2 to PaCO2Reference Fuke, Miyamoto, Ohira, Ohira, Odajima and Nishimura12-Reference Sanders, Kern, Costantino, Stiller and Strollo14 and the observation that PaCO2 is predictably 2 mm Hg to 5 mm Hg above ETCO2 values.Reference Shankar, Moseley, Vemula, Ramasamy and Kumar20
The physiology and injury pattern of severely traumatized and thermally injured patients represent a unique population to which the use of ETCO2 monitoring as a surrogate of PaCO2 to guide ventilation has not been validated. ETCO2 values are significantly affected in the setting of ventilation-perfusion mismatch, increased dead space, and poor perfusion as a result of hypovolemic shock,Reference Fletcher and Johnson21, Reference Hopper, Nystrom, Deming, Brown and Peabody22 all potential physiologic changes recognized in the trauma or burn patient. The hypothesis for this study was ETCO2 does not correlate with PaCO2 in the trauma and burn victim, and adherence to current guidelines to keep ETCO2 between 30 mm Hg and 35 mm Hg is associated with avoidable respiratory acidosis.
Methods
An institutional review board-approved, prospective observational study was performed over a 24-month period for trauma and burn patients intubated and transferred to a University Level I trauma and dedicated burn center. Patients were included in the study if they were intubated in the prehospital setting following a traumatic or burn-related injury and directly transported to the trauma and burn center. Absence of ETCO2 transport data and patients without an ABG within 15 minutes of arrival to the trauma center were excluded. Prehospital arrests and patients age <18 were also excluded.
On arrival to the trauma center, ETCO2 data was obtained immediately from the emergency medical providers involved in transporting the patient. The ETCO2 values maintained en route to the hospital were recorded. After arrival to the trauma center, minute ventilation was continued based on ETCO2 and not adjusted until obtaining an arterial blood gas (ABG). Patients underwent arterial puncture by the respiratory therapist after completion of the primary survey for obtaining an arterial blood gas (ABG). The place and time of the intubation as well as the service performing the intubation was recorded from the documentation provided from the transporting medics. Additional data collected included the demographics of the patients, prehospital Glasgow Coma Score (GCS), hospital and Intensive Care Unit (ICU) length of stay, and mortality. Injury severity patterns of the patients were classified based on the Injury Severity Score (ISS), Trauma Injury Severity Score (TRISS), and Revised Trauma Score (RTS), which were obtained from the trauma registry. The discharge disposition of the survivors was also obtained from the trauma registry.
The mean difference between prehospital ETCO2 and arrival PaCO2 was compared across the cohort to determine statistical significance, and linear regression analysis was used to determine the degree of correlation between the two values. A subgroup analysis was performed to examine the difference between survivors and decedents, those with a pH <7.2 and pH ≥7.2, arterial base deficits ≥6 and <6, patients with ISS ≥25, ≥15, and <15, and RTS ≤4 and >4. Survivors were defined as those patients discharged from the hospital alive, regardless of discharge disposition. Decedents were defined as those patients who died after arrival to the trauma center.
Statistical analysis was conducted using Microsoft Excel Version 14.0.476 (Microsoft Corporation, Redmond, Washington, USA). The differences between ETCO2 and PaCO2 were analyzed using a student t-test. Statistical significance was determined at a P value less than .05. Linear regression analysis was utilized to evaluate the correlation between ETCO2 and PaCO2 values.
Results
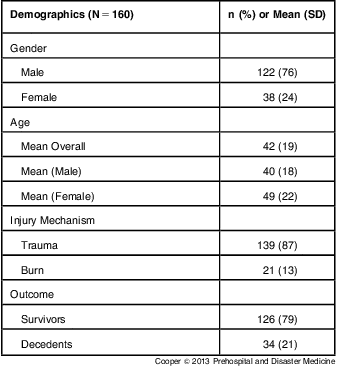
One hundred sixty patients met the inclusion criteria. The mean age was 42 (SD = 19) with a predominantly male population (76%) (Table 1). One hundred thirty-nine (87%) of the patients suffered a severe trauma, while 21 (13%) of patients had strictly burn-related injuries requiring intubation (Table 1). Thirty-four (21%) of the patients died after arrival to the trauma center (Table 1). The overwhelming majority of patients (75%) had a pre-intubation GCS <8, and over half had ISS ≥15 (52%) and RTS ≤4 (52%) (Table 2). Twenty-nine percent of the study population fell into the most severe injury classification with ISS ≥25 and over one-third of the entire study had TRISS scores <0.50 (Table 2). The decedents had a predictably shorter hospital and ICU stay when compared with survivors, who averaged an extensive 48 (SD = 16) day hospital stay and 10 (SD = 52) days in the ICU (Table 3). Of the survivors, 110 (88%) were able to be discharged home or to a rehabilitation facility, with a small percentage progressing to a long term acute care hospital (LTAC) (4%) or skilled nursing facility (SNF) (2%) (Table 3).
Demographics and Patient Characteristics
Injury Severity Patterns (N = 160)
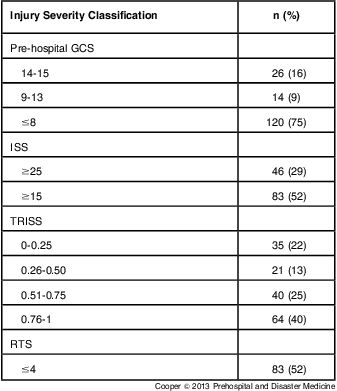
Abbreviations: GCS, Glasgow Coma Score; ISS, Injury Severity Score; TRISS, Trauma Injury Severity Score; RTS, Revised Trauma Score
Outcome Data
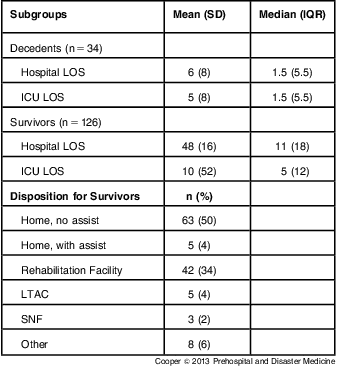
Abbreviations: SD, Standard Deviation; IQR, Interquartile Range; LOS, Length of Stay; ICU, Intensive Care Unit; LTAC, Long Term Acute Care Hospital; SNF, Skilled Nursing Facility
Those patients who ultimately died were correspondingly more acidotic with a mean arrival pH of 7.19 (SD = 0.14) versus survivors with a mean arrival pH of 7.32 (SD = 0.11) (P < .001). Overall mean prehospital ETCO2 (34 (SD = 4) mm Hg) was significantly lower than mean arrival PaCO2 (44 (SD = 11) mm Hg) (P < .005), and did not reveal a correlation after linear regression analysis (R2 = 0.08) (Table 4, Figure 1). The analysis between the survivor and decedent populations revealed an even greater difference between ETCO2 and PaCO2. Decedents did not demonstrate a difference between ETCO2 and PaCO2 (R2 = 0.0002) and mean measured PaCO2 was 17 mm Hg higher than ETCO2 (P < .003, Table 4, Figure 2). In comparison, survivors had an ETCO2 and PaCO2 correlation coefficient of 0.34 with a mean difference of 7 mm Hg (P >.05, Table 4, Figure 2).
Mean End Tidal to Arterial CO2 Difference

Abbreviations: ETCO2, mean end tidal CO2 in mm Hg; ETCO2: PaCO2, absolute mean difference between end tidal and arterial CO2; ISS, Injury Severity Score; PaCO2, mean partial pressure of arterial CO2 in mm Hg; R2, correlation coefficient using linear regression; RTS, Revised Trauma Score
aP < .05
Overall Prehospital ETCO2 Values Plotted Against Paired Arrival PaCO2 Values. Linear regression analysis demonstrates best fit line with R2 coefficient correlation. Abbreviations: ETCO2, end tidal CO2; PaCO2, partial pressure of arterial CO2

Mean Difference of Prehospital ETCO2 and Arrival PaCO2 Values for Survivors and Decedents. Abbreviations: ETCO2, end tidal CO2; PaCO2, partial pressure of arterial CO2 n = total number *P < .05

When examining the sub group analysis of those patients with a pH of less than 7.2, there was a poor correlation and larger difference between ETCO2 and PaCO2 when compared to those patients with a pH ≥7.2 (Table 4, Figures 3a and 3b). For patients with a pH <7.2, ETCO2 measurements were on average 20 mm Hg less then matched PaCO2 values (p < 0.001) with no evidence of correlation (Figure 3a, R2 = 0.0005). Patients with an arrival pH of ≥7.2 did not demonstrate a correlation between ETCO2 and PaCO2 (Figure 3b, R2 = 0.34), but there was not a statistically significant difference between the two values with a mean difference of 7 mm Hg (Table 4).
Patients Presenting with a pH Below 7.2 and Corresponding Prehospital ETCO2 Values Plotted Against Paired Arrival PaCO2 Values. Linear regression analysis demonstrates best fit line with R2 coefficient correlation. Abbreviations: ETCO2, end tidal CO2; PaCO2, partial pressure of arterial CO2

Patients Presenting with a pH ≥ 7.2 and Corresponding Prehospital ETCO2 Values Plotted against Paired Arrival PaCO2 Values. Linear regression analysis demonstrates best fit line with R2 coefficient correlation. Abbreviations: ETCO2, end tidal CO2; PaCO2, partial pressure of arterial CO2

Patients with higher arterial base deficits also demonstrated an increased mean difference between ETCO2 and PaCO2 with a correspondingly worse correlation when compared to patients with less significant base deficits. Those patients with a base deficit ≥6 had a significantly lower ETCO2 compared to PaCO2 with a mean difference of 11 mm Hg (P < .05) and correlation coefficient of 0.061 (Table 4, Figure 4). Although patients with a base deficit of <6 did not demonstrate a correlation between prehospital ETCO2 and arrival PaCO2 (R2 = 0.11), there was a non-significant difference between the means (P > .05) (Table 4, Figure 4).
Mean ETCO2: PaCO2 Difference for Patients Presenting with an Arterial Base Deficit ≥6 and <6. R2 represents coefficient correlation after linear regression analysis; n = total number of patients. Abbreviations: ETCO2, end tidal CO2; ETCO2: PaCO2, absolute mean difference between end tidal and arterial CO2; PaCO2, partial pressure of arterial CO2 *P < .05

Those patients suffering the most severe injuries, based on an ISS of ≥25 and RTS ≤4, revealed the greatest difference between ETCO2 and PaCO2 when compared to those with less severe injury patterns, based on an ISS of <15 and RTS >4 (Table 4). Patients with an ISS ≥25 and RTS ≤4 had a mean difference of 11 mm Hg (P < .05) and no evidence of correlation between prehospital ETCO2 and measured PaCO2 (R2 = 0.0003 and 0.0002 respectively, Table 4). In contrast, patients with ISS <15 and RTS >4 did not have a significant difference between mean ETCO2 and PaCO2 scores (7 and 6 mm Hg respectively) and had better correlation coefficient scores (R2 = 0.46 and 0.51 respectively, Table 4).
Discussion
ETCO2 monitoring is a simple, non-invasive modality that has numerous clinical applications. Well established as an accurate tool for monitoring a patient's ventilatory status during routine general anesthesia and confirming placement of an airway after endotracheal intubation, its role has expanded.Reference Caplan, Vistica, Posner and Cheney1-Reference Cheney, Posner, Lee, Caplan and Domino3, Reference Ward and Yealy6, Reference Silvestri, Ralls, Krauss, Thundiyil, Rothrock and Senn7 With several studies demonstrating a strong correlation between ETCO2 and PaCO2,Reference Fuke, Miyamoto, Ohira, Ohira, Odajima and Nishimura12-Reference Sanders, Kern, Costantino, Stiller and Strollo14 the use of continuous ETCO2 monitoring to guide ventilation in the prehospital setting is replacing guidelines that focus on fixed ventilator parameters.Reference Warner, Cuschieri, Garland, Carlbom, Baker and Copass15 Some EMS protocols and guidelines have established pre-determined ETCO2 ranges to be maintained while transporting the intubated patient to a trauma center.Reference Salomone, Pons and McSwain19 It is an attractive option in this setting where frequent ABG sampling is not feasible or practical. However, most of the data that correlates ETCO2 and PaCO2 is based on healthy patients,Reference Fuke, Miyamoto, Ohira, Ohira, Odajima and Nishimura12 which creates a potential discrepancy for the severely traumatized patient.Reference Warner, Cuschieri, Garland, Carlbom, Baker and Copass15, Reference Prause, Hetz, Lauda, Pojer, Smolle-Juettner and Smolle23, Reference Belpomme, Ricard-Hibon and Devoir24
Inappropriate prehospital ventilation can have devastating consequences on the long term morbidity and mortality of the trauma patient. This is particularly true for the patients sustaining a TBI and presenting with significant hypercapnea or hypocapnea as a result of poor ventilation.Reference Chesnut, Marshall and Klauber16, Reference Davis, Idris and Sise18 Maintaining PaCO2 levels between 30-39 mm Hg in the prehospital setting has been linked to a significant survival advantage and better outcomes in the trauma and burn patient.Reference Warner, Cuscheri, Copass, Jurkovich and Bulger17, Reference Salomone, Pons and McSwain19 In order to optimize prehospital care in this population, the correlation between prehospital ETCO2 and measured PaCO2 in the severely traumatized patient was evaluated to determine if accurate ventilation was being provided based on EMS guidelines.
The results indicate no correlation between ETCO2 and PaCO2 in the severely injured trauma and burn patient. When looking at the overall study population, mean prehospital ETCO2 was significantly lower than arrival PaCO2 and there was no evidence of correlation between the two means. The examination of the subgroup analysis between outcomes, patient characteristics, physiologic status, and injury severity patterns revealed some alarming trends in the difference between prehospital ETCO2 and measured PaCO2. Mortality, acidosis, higher base deficits, and more severe injury patterns were associated with a greater discrepancy between ETCO2 and PaCO2. This discrepancy and lack of correlation was most evident in the acidotic patient presenting with a pH <7.2 and in those patients who ultimately died. The injury severity classifications also demonstrated a trend in ETCO2 and PaCO2 differences. Those patients presenting with a base deficit ≥6, an ISS ≥25, and RTS ≤4 all had exaggerated differences between ETCO2 and PaCO2 and no evidence of correlation based on linear regression analysis (Table 4).
In comparison, patients with less severe injury patterns and better physiologic arrival parameters demonstrated a more favorable correlation between ETCO2 and PaCO2. The difference between prehospital ETCO2 and measured arrival PaCO2 for those patients with a pH ≥7.2, an ISS <15, and RTS >4 never reached statistical significance, but still remained outside the “accepted difference” of 2 to 5 mm Hg.Reference Shankar, Moseley, Vemula, Ramasamy and Kumar20 The subgroup with RTS >4 came closest to the accepted difference and had the strongest correlation among all of the subgroups. This may provide some support to the previously published results indicating a correlation between ETCO2 and PaCO2 in healthier adults.Reference Fuke, Miyamoto, Ohira, Ohira, Odajima and Nishimura12-Reference Sanders, Kern, Costantino, Stiller and Strollo14 However, given the study population and results, there is no conclusive evidence that ETCO2 can accurately predict PaCO2, regardless of a patient's physiologic status or injury pattern; this diverges with severity of injury. Determining this point where the difference between ETCO2 and PaCO2 sharply diverges, based on GCS, injury pattern, and other easily obtainable physiologic parameters in the field, should be the focus for future studies. This could lead to the development of a prehospital scoring system that would alert prehospital providers when the use of ETCO2 is ill advised and would lead to worse outcomes for the patient.
The results expose a problem in the management of prehospital ventilation for the trauma or burn patient if ETCO2 is used as a surrogate for serial PaCO2. ETCO2 does not accurately predict PaCO2 in the traumatized patient and its use as the sole modality for guiding ventilation may lead to hypoventilation. This is especially true in the more acidotic patient, which represents a subgroup where immediate and proper ventilation is even more critical to improving their outcomes. Blind adherence to current EMS guidelines to keep ETCO2 within a prescribed range for all patients, regardless of physiologic state, may contribute to acidosis and increased mortality.
Limitations
The current study does have several limitations. This single institution analysis was limited to two years and a sample size of 160 patients. Therefore, the reproducibility of the results based on an experience in a limited environment cannot be attested. There was also variable lag time between the acquisition of an ABG and the recorded prehospital ETCO2 value, which may obscure the ability to accurately assess the correlation between ETCO2 and PaCO2 using a linear regression analysis.
Conclusion
ETCO2 correlates poorly with PaCO2 in the traumatized patient and becomes increasingly inaccurate with severity of injury. The sole use of ETCO2 monitoring to guide prehospital ventilation should be abandoned. Alternate protocols and tools should be developed to guide ventilation in the prehospital setting.
Abbreviations
- ABG:
Arterial Blood Gas
- EMS:
Emergency Medical System
- ETCO2:
End tidal carbon dioxide
- GCS:
Glasgow Coma Score
- ICU:
Intensive Care Unit
- IQR:
Interquartile Range
- ISS:
Injury Severity Score
- LTAC:
Long Term Acute Care Hospital
- LOS:
Length of Stay
- PACO2:
Partial pressure of arterial carbon dioxide
- RTS:
Revised Trauma Score
- SD:
Standard Deviation
- SNF:
Skilled Nursing Facility
- TBI:
Traumatic Brain Injury
- TRISS:
Trauma Injury Severity Score
Acknowledgement
The authors thank Rindi Uhlich, BS (School of Medicine, University of Missouri, Columbia, Missouri) for help with the statistical analysis.



