Introduction
The retina is a complex organ consisting of highly structured arrays of photoreceptors, auxiliary cells and, in vertebrates, higher order neurons. Across the animal kingdom, different classes of photoreceptors have distinct electrophysiological properties and are arranged in morphological structures that facilitate optimal visual functioning. Examples include changing density of rods and cones with distance to the fovea of the mammalian retina (Curcio et al., Reference Curcio, Sloan, Packer, Hendrickson and Kalina1987), or specialized zones in the compound eyes of invertebrates, such as the dorsal rim area optimized for the detection of polarization plane of the impinging light (Frolov et al., Reference Frolov, Immonen and Weckstrom2014). While differences between classes of photoreceptors are genetically predetermined (Zhou et al., Reference Zhou, Flamier, Abdouh, Tétreault, Barabino, Wadhwa and Bernier2015), the causes of the common variability in morphological and/or electrophysiological properties between homotypic photoreceptors are less well understood. Such variability could be explained by either developmental processes or phenotypic plasticity. For instance, development might account for the systematic changes in cone outer segment size with distance to the foveola in some vertebrates (Hendrickson, Reference Hendrickson, Penfold and Provis2005), and for differences in the size of six peripheral photoreceptors in the ommatidia of Notonecta punctata and related invertebrate species (Immonen et al., Reference Immonen, Ignatova, Gislen, Warrant, Vahasoyrinki, Weckstrom and Frolov2014a). On the other hand, phenotypic plasticity can contribute to variability between individuals with different life histories, modulating the effects of dissimilar genetic backgrounds (Wolfram & Juusola, Reference Wolfram and Juusola2004).
The nature of high variability in the electrophysiological properties of photoreceptors in a compound eye was specifically explored for the first time in a study of the cockroach, Periplaneta americana (Heimonen et al., Reference Heimonen, Salmela, Kontiokari and Weckstrom2006). Variabilities in angular sensitivity, light response amplitudes, and dynamics were investigated by intracellular recording. Differences were distinctly local, as “[w]ithin a distance of few tens of micrometers in the retina, all extremes of functional variability could be encountered … independent of the diurnal cycle or sex” (Heimonen et al., Reference Heimonen, Salmela, Kontiokari and Weckstrom2006), and could not be associated with any identifiable morphological or physiological pattern in the retina. Consecutive patch-clamp studies of Periplaneta photoreceptors in dissociated ommatidia added the following to the list of highly variable properties: membrane capacitance (C m), absolute sensitivity to light, amplitude and kinetics of light-induced current (LIC) and voltage-activated K+ current (Kv), and information capacity estimates (Frolov, Reference Frolov2016; Salmela et al., Reference Salmela, Immonen, Frolov, Krause, Krause, Vahasoyrinki and Weckstrom2012). Similar variabilities in photoreceptor properties were discovered in other invertebrate species with incomplete metamorphosis, including the stick insect Carausius morosus (Frolov et al., Reference Frolov, Immonen, Vahasoyrinki and Weckstrom2012), backswimmer Notonecta glauca (Immonen et al., Reference Immonen, Ignatova, Gislen, Warrant, Vahasoyrinki, Weckstrom and Frolov2014a), lesser water boatman Corixa punctata (Frolov, Reference Frolov2015), water strider Gerris lacustris (Frolov & Weckstrom, Reference Frolov and Weckstrom2014), and green cockroach Panchlora nivea (Frolov et al., Reference Frolov, Matsushita and Arikawa2017).
Analyses of these variabilities revealed various statistically significant correlations among C m, light sensitivity, sustained Kv and LIC amplitudes, measures of information processing, and other parameters, indicating that the variabilities are functional and suggesting that different subsets of photoreceptors might be operating under disparate illumination conditions (Frolov, Reference Frolov2016). Mutual strong positive correlations found between C m, absolute sensitivity in dim light, and sustained LIC amplitudes in bright light indicate that (1) the light-sensitive rhabdomeric membrane is the main functional component of the photoreceptor membrane; (2) despite the highly convoluted microvillar organization and the associated space-clamping problem, the C m measured in patch-clamp experiments accounts for a substantial part of the rhabdomeric membrane; and (3) the variabilities are mainly due to variation in the size of the rhabdomere (Frolov, Reference Frolov2016).
However, the above analyses were all based on data pooled from many animals, and no attempts were made to determine the origins of variability, which could be caused by differences between animals, by regional differences between photoreceptors in the same retina, or by differences within the ommatidium. It should be noted that the ommatidial organization of photoreceptors in insect eyes adds another non-trivial level of variability. Insights obtained from the study of N. glauca indicated that the variability between peripheral green-sensitive photoreceptors in the ommatidium is non-stochastic and serves a functional purpose, i.e., it expands the operational range of background intensities (Immonen et al., Reference Immonen, Ignatova, Gislen, Warrant, Vahasoyrinki, Weckstrom and Frolov2014a). However, this and other phylogenetically related species have open-rhabdom ommatidia, similar to flies, whereas a large majority of insects possess fused rhabdoms. Furthermore, a fused rhabdom can be formed either by photoreceptors spanning the entire length of the ommatidium, as in honeybees (Snyder et al., Reference Snyder, Menzel and Laughlin1973), or by photoreceptors arranged in two tiers (Arikawa & Uchiyama, Reference Arikawa and Uchiyama1996). It is not yet known whether or how these structural differences are reflected in the electrophysiological properties of photoreceptor responses.
The present study aimed to determine the source(s) of electrophysiological variability between photoreceptors in the compound eye of P. americana. Using the patch-clamp method, I performed a series of recordings, with emphasis on recordings from photoreceptors in the same ommatidia, and then used coefficient of variation (CV) metrics to identify the main source of variability in several electrophysiological properties. I found that there are two main sources of variability, the inter-individual and the intra-ommatidial, with the former influenced by phenotypic plasticity.
Materials and methods
Patch-clamp recordings
Wild-type American cockroaches were reared locally and maintained in reversed 12–12 illumination conditions. Only adult male cockroaches were used in experiments.
The retinas from both compound eyes were dissociated and whole-cell recordings were performed as described previously (Immonen et al., Reference Immonen, French, Torkkeli, Liu, Vahasoyrinki and Frolov2017). In brief, data were acquired using an Axopatch1-D patch-clamp amplifier (headstage CV-4-1/100U), Digidata1550 digitizer, and pClamp10 software (Axon Instruments/Molecular Devices, CA). Patch electrodes were made from thin-walled borosilicate glass (World Precision Instruments, Sarasota, FL). Electrode resistances were between 4 and 10 MΩ. Bath solution contained (in mM) 120 NaCl, 5 KCl, 4 MgCl2, 1.5 CaCl2, 10 N-tris-(hydroxymethyl)-methyl-2-amino-ethanesulfoncic acid (TES), 25 proline and 5 alanine, pH 7.15. Patch pipette solution contained (in mM) 100 K-gluconate, 40 KCl, 10 TES, 2 MgCl2, 4 Mg-ATP, 0.4 Na-GTP, and 1 NAD, pH 7.15. The liquid junction potential (LJP) was −12 mV. All voltage values cited in the text were corrected for the LJP. The series resistance was compensated by 80% and typically did not exceed 10 MΩ during voltage-clamp recordings. A capacitance of 100 pF (the maximum allowed by the headstage) was compensated in all photoreceptors. The residual capacitance, which can be as high as 500 pF or even more, can strongly decelerate membrane charging during voltage clamp experiments, imposing a voltage-clamp time constant of  $\tau = C_{\rm{m}}^\prime \cdot {R_{\rm{s}}}$, where
 $C_{\rm{m}}^\prime$ is the residual whole-cell capacitance and R s series resistance after compensation. It can be seen that in the case of
 $C_{\rm{m}}^\prime = 500\;{\rm{pF}}$, and R s = 10 MΩ, the voltage-clamping constant is 5 ms, which can fully account for the disappearance of the fast transient K+ current IA at depolarized voltages. However, this does not significantly affect the slower (quantum bumps) or sustained current responses reported in this work.
Because the main delayed rectifier is an EAG conductance, which is suppressed by the elevation of intracellular Ca2+ (Immonen et al., Reference Immonen, French, Torkkeli, Liu, Vahasoyrinki and Frolov2017), care was taken to use only reasonably healthy photoreceptors that demonstrated light responses. Kv current was recorded from photoreceptors having a whole-cell membrane resistance of ≥250 MΩ at the holding potential of −82 mV, corresponding to a leak conductance of ≤4 nS. Average membrane conductance between −82 and −72 mV was 1.1 ± 1.0 nS. Before calculating conductance–voltage relationships for the sustained Kv current, the leak current between −82 and −72 mV was scaled up and subtracted from all Kv current values. Both leak and K+ conductances were estimated using a reversal potential of −80 mV.
Experiments were performed at room temperature (20–22°C) between 12.00 and 17.00 PM (during the subjective night for the cockroaches), i.e., on cockroaches that were dark-adapted for at least 3 h.
Light stimulation
Light stimulation was performed using a custom voltage-to-current converter for light-emitting diodes (LEDs). The current–light emission relationship for an LED is linear in the driving voltage range of ca. 0.01 to 10 V. Ten LEDs (Roithner Laser Technik, Austria) with narrow-band emission peaks ranging from 355 to 625 nm were used to determine the spectral class of the photoreceptor. Only green-sensitive photoreceptors were used in this study. The stimulation was performed using a 525 nm LED. Stimuli were conditioned using a series of neutral density (ND) filters (Kodak, New York, NY).
Light intensities are given as arbitrary units (a.u.) in the range of 5 × 10⁻⁶ to 10 a.u.; the numbers correspond to voltages driving the voltage-to-current converter, with attenuation by ND factored in. To determine the absolute sensitivity, I counted current quantum bumps elicited by constant light (CL) at the intensity 5 a.u. attenuated with ND filters as to elicit 1 to 10 bumps/s. Usually, such responses were recorded at ND6, i.e., at the intensity 5 × 10⁻⁶ a.u. If the rate was <1 s−1, the random appearance of seemingly spontaneous bumps led to its overestimation; if the rate was >10 s−1, bump fusion led to underestimation of absolute sensitivity. Therefore, due to variability between photoreceptors, the light attenuation level was changed using NDs. The resulting bump rates were then corrected by dividing or multiplying by factors of 10 depending on the respective ND values. A spectrometer (USB4000, Ocean Optics, Inc., Largo FL, USA) was used to estimate the photon flux. At the green (525 nm) LED intensity of 5 × 10⁻⁶ a.u., the photon flux was ∼0.2 photons µm−2·s−1.
Experiments involving prolonged light conditioning are described in detail elsewhere (Frolov et al., Reference Frolov, Immonen, Saari, Torkkeli, Liu and French2018).
Same ommatidium recordings
In patch-clamp experiments, ommatidia were situated horizontally on the bottom of the recording chamber in a bath solution. A photoreceptor was selected for patching by visual assessment of its membrane. The electrode was advanced toward the selected spot from the side, and the spot itself usually represented the lateral-most aspect of the ommatidium. After patching one photoreceptor, the bath was rotated by 180° and the procedure was repeated for the photoreceptor on the other side of the same ommatidium (SO). As each ommatidium contains eight photoreceptors, it is highly unlikely that recordings performed as described could represent the same cell. Furthermore, based on the experimental testing, repetitive patching of the same photoreceptor results in the same reading of C m but a much worse functional state of the cell.
Data analysis
The goal of this study was to analyze variances in the properties of photoreceptors grouped according to their origin. However, it was usually not possible to record from more than two photoreceptors in the SO. To quantify the variability under such conditions, coefficients of variation (CVs) were calculated for two data points from each ommatidium (henceforth “pairwise CV”) and then averaged to obtain a group mean CV. Coefficient of variation was determined as the ratio of the standard deviation σ to the mean μ:
 $${\rm{CV}} = {\sigma \over \mu },$$
However, standard deviations obtained with a small number of data points (n) are biased and significantly smaller than the standard deviations computed using a larger n from the same population. An unbiased estimate of a standard deviation can be obtained by multiplying the biased standard deviation with a correction factor c 4 calculated using the equation (Bolch, Reference Bolch1968):
 $${c_4} = \sqrt {{2 \over {n - 1}}} {{\Gamma \left( {{n \over 2}} \right)} \over {\Gamma \left( {{{n - 1} \over 2}} \right)}} = 1 - {1 \over {4n}} - {7 \over {32{n^2}}} - {{19} \over {128{n^3}}} + O\left( {{n^{ - 4}}} \right)$$
where Γ indicates the gamma function, and n is the sample size. However, such correction is applicable only to normally distributed data. Four out of six electrophysiological parameters examined in this study (C m, Kv G max, Kv slope factor, and latency) passed the Shapiro–Wilk normality test, whereas the other two (absolute sensitivity and sustained LIC amplitude) did not pass. All CV values describing the normally distributed data were corrected using the correction factors c 4.
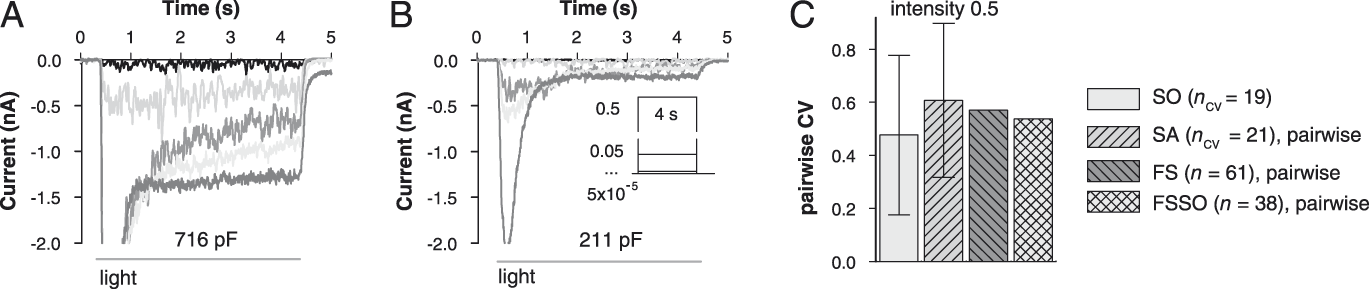
Distributions of absolute sensitivity and sustained LIC amplitude values were irregular and could not be categorized. Although approaches exist to reduce the variability estimate bias due to small n for data derived from arbitrary distributions, an alternative approach of pairwise CV comparison was used here. In the SO group, all individual CV measures of absolute sensitivity and LIC were pairwise, i.e., based on two data points. In the same animal (SA) group, the number of data points obtained from a single animal varied from two to six. To obtain a pairwise CV for an experiment with n exceeding 2, all possible pairs of values were constructed by recombination, pairwise CVs calculated, and then averaged to obtain the mean pairwise CV. For instance, if in one experiment the absolute sensitivities were obtained for three cells, equaling 1.4, 0.15, and 3.5 bumps/s, pairwise recombination of these values would give three pairs (1.4, 0.15; 0.15, 3.5; and 1.4, 3.5). The corresponding pairwise CV values are 1.14, 1.30, and 0.6, and a mean pairwise CV for this experiment is 1.01. Such mean pairwise CV estimates alongside the pairwise CVs obtained in experiments that yielded only two data points constituted a data sample, which can be described using mean and standard deviation. To obtain comparable measures for the two combined FS and FSSO groups (see below), similar random pairwise recombination of individual values with consecutive calculation of pairwise CVs was performed. Specifically, I randomly selected 5·n pairs of values from each of the FS and FSSO samples of absolute sensitivity and LIC data using a script in Microsoft Excel 2013, where n is the actual size of the sample. Because of the arbitrariness of such selection, no error bars are shown for FS and FSSO CVs in Figs. 4C and 5C.
The samples that passed the normality test were analyzed with parametric statistical methods as indicated. Such data are presented as mean ± s.d. (exceptions are specified in the text). Data in the samples that did not pass the normality test were presented using medians and interquartile ranges (25% quartile:75% quartile). To evaluate differences between such samples, the Mann–Whitney U test (MWUT) was used. In figures, the asterisk (*) indicates P < 0.05. Spearman’s rank order correlation coefficient (SROCC, ρ) was used in analyses of correlations. Throughout the text, n stands for experimental group size.
Results
Experimental groups
Six basic electrophysiological properties of photoreceptors were studied in this work: whole-cell membrane capacitance (C m), quantum bump latency in dark-adapted photoreceptors, maximal conductance (G max) and slope factor of the sustained Kv current, absolute sensitivity, and sustained LIC amplitude in bright light. Overall, recordings were performed from 110 photoreceptors in more than 50 animals. Variabilities in the electrophysiological properties between four experimental groups were studied using CVs.
The first “same ommatidium” (SO) group includes CVs for the six parameters obtained from recordings from two or more photoreceptors in the SO (see Materials and methods). The second “same animal” (SA) group includes CVs obtained from recordings in the SA, using both retinas. To qualify for inclusion into SA group, data had to originate either from (1) two or more photoreceptors in different ommatidia, or (2) photoreceptors in the SO plus at least one photoreceptor from a different ommatidium, or (3) two or more sets of SO recordings. The third “full sample” (FS) group is comprised of all photoreceptors. The fourth “full sample same ommatidium” (FSSO) group consists of all SO data pooled together and represents subsets of FS data. Statistical properties of FS and FSSO groups were nearly identical.
Variability in C m
Of the six parameters examined here, whole-cell membrane capacitance is the most robust because its value can be easily determined by measuring electric charge flowing across the membrane potential in voltage-clamp experiments, and it is independent of any other photoreceptor property, including its functional state. C m values were calculated by integrating the areas under the capacitive transients during voltage transitions from −112 mV to −92, −82 and −72 mV. On average, C m was 462 ± 185 pF (n = 110) in the FS group. In the more restricted FSSO group, C m was 478 ± 191 pF (n = 74). The C m values were distributed normally. The CV was 0.40 in both FS and FSSO groups.
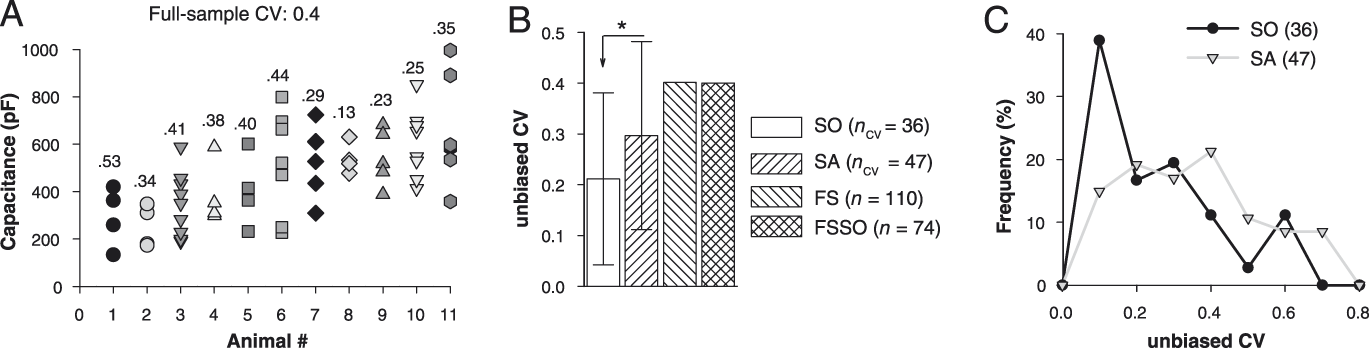
The SO group consisted of C m values obtained from 74 photoreceptors in 36 ommatidia. Of these, recordings from 2 photoreceptors were made in 34 ommatidia, and from 3 photoreceptors in 2 ommatidia. As indicated above, the statistical properties of the FSSO group, which includes all SO data values, were almost the same as those of the FS group. The SA group was based on data from 47 animals. Fig. 1A shows C m measurements and their respective CVs obtained in experiments that yielded four or more C m data points. The cells are sorted according to the increasing mean. It can be seen that CVs within animals were in most cases smaller than the CV for the entire FS group.
Variability in membrane capacitance. (A) C m values obtained in recordings from 11 cockroaches with at least 4 cells per animal. The cells are arranged according to the increasing mean C m. Numbers above are unbiased CV. (B) Mean CV values for the SO and SA groups are compared to CVs of the FS and FSSO groups; MWUT was used for comparison. (C) Distributions of CV values for SO and SA.

Recordings from photoreceptors in the SO were characterized by relatively low variability. Fig. 1B compares mean CVs of SO and SA groups with CVs of FS and FSSO groups. Although the distribution of SO CVs was not Gaussian (Fig. 1C), the data for convenience are presented using mean and standard deviation. The variability was significantly higher in the SA group than in the SO group (P = 0.031, MWUT, Fig. 1B).
Delayed rectifier
Photoreceptor-to-photoreceptor variation in the properties of Kv current has several manifestations, including the presence or absence of a transient current (IA), IA amplitude, maximal conductance of the delayed rectifier (IDR), half-activation potentials, and slope factors of conductance–voltage dependencies of both currents.
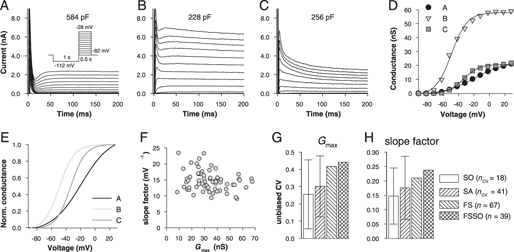
Examples of dissimilar Kv currents recorded from three photoreceptors are shown in Fig. 2A–2C. The conductance–voltage relations are shown in Fig. 2D and 2E; data points were fitted with a charge–voltage Boltzmann equation. Most photoreceptors gave current values between those in Fig. 2A and 2B, with a small or negligible IA. Previous studies indicated that appearance of IA depends on C m, with smaller photoreceptors displaying larger IA (Salmela et al., Reference Salmela, Immonen, Frolov, Krause, Krause, Vahasoyrinki and Weckstrom2012). While possibly reflecting a genuine photoreceptor phenotype, the absence of IA in the photoreceptors with high C m (Fig. 2A) could also be caused by insufficiently fast voltage-clamping due to the mostly uncompensated capacitance, i.e., represent an electrophysiological artifact. In addition, reliable extraction of small IA is difficult. Therefore, variability in IA properties was not addressed here.
Variability in the properties of delayed rectifier K+ current. (A–C) 200 ms fragments of 500 ms recordings of Kv currents evoked from a holding potential (HP) of −82 mV in 10 mV increments in the range of −92 to +28 mV. (D) Conductance–voltage relations for currents from panels A–C as indicated. Current values at the end of 500 ms current responses were used. A reversal potential of −80 mV was used to calculate conductance values. Data points were fitted with a Boltzmann equation. (E) Normalized conductance–voltage relations for data from panels A–C illustrate differences in the half-activation potentials and slope factors. (F) Correlation between G max and slope factor values in the FS group (ρ = −0.2, P = 0.12, n = 65). (G, H) Mean G max (G) and slope factor (H) CV values for the SO and SA groups are compared to CVs of the FS and FSSO groups.

Of three parameters describing IDR, only one, the slope factor, was well suited for variation analysis. Because elevation of intracellular calcium suppresses G max of IDR in a voltage-independent manner (Immonen et al., Reference Immonen, French, Torkkeli, Liu, Vahasoyrinki and Frolov2017), G max depends on the functional state of the photoreceptor. The half-activation potential is even worse because it is expressed in relative units, with proximity to zero distorting CV estimates. Variability in IDR was studied using recordings from high-quality photoreceptors characterized by the presence of discernible quantum bumps or fast LIC (kinetics of LIC slows with progressive deterioration of cell condition). Two parameters were measured, G max and slope factor. Mean G max values were 34.6 ± 14.4 (n = 67) and 34.9 ± 15.3 nS (n = 39) for FS and FSSO groups, respectively. Mean slope factors equaled 14.7 ± 3.0 mV−1 (n = 67) for FS and 15.0 ± 3.5 mV−1 (n = 39) for FSSO groups. No significant correlation was found between G max and slope factor values (ρ = −0.2, P = 0.12, n = 65, Fig. 2F).
Similarly to variability in C m, G max and slope factor values of IDR obtained from photoreceptors in the same ommatidia were closer to each other than values from three other groups (Fig. 2G and 2H). However, in contrast to C m, the differences between SO and SA groups were not statistically significant (P = 0.13 and 0.37 for G max and slope factor, respectively, MWUT). This is an important distinction because variability in C m appears to be mainly due to variability in the size of the rhabdomere, whereas all evidence points to IDR channels being expressed in the soma (see Discussion).
Quantum bump latency
During light response, the time delay between the onset of light and onset of membrane depolarization consists of two sequential components, the phototransduction delay (or latency) and delay caused by the finite speed of membrane charging. The latter is determined by the momentary membrane time constant, which is a product of C m and membrane resistance. Both components of the total time delay decrease with light intensity. The latency decreases as absorption of multiple photons by visual pigment molecules in the same microvillus speeds up the phototransduction cascade, while the membrane time constant decreases because of the progressive opening of IDR channels with light-induced depolarization. Therefore, proper assessment of variability in the speed of photoelectrical conversion needs to be performed in the voltage-clamp mode to eliminate delay due to membrane charging. Furthermore, to eliminate the dependence on light intensity, phototransduction latency must be studied at the low limit of absolute sensitivity, in dark-adapted photoreceptors, using a stimulus that activates only one microvillus per photoreceptor at a time. Under such conditions, the delay of phototransduction can be approximated by the mean quantum bump latency.
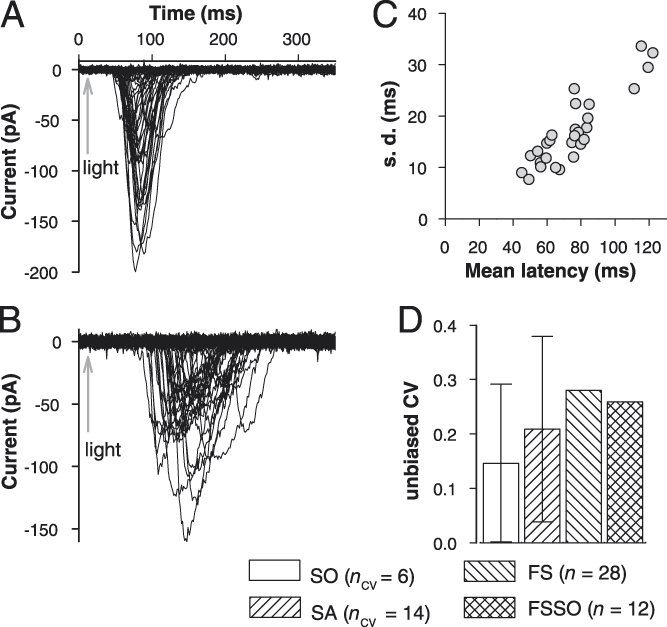
In the recordings shown in Fig. 3A and 3B, current quantum bumps were elicited with 1 ms flashes of green (525 nm) light of such an intensity to evoke single bumps with a probability of <0.8 (0.46 ± 0.19%, n = 28). Bump latency was measured as the interval between the stimulus and the bump current reaching 10% of its maximal amplitude. Mean latency was first determined for each photoreceptor and then all mean latencies were averaged again to yield group averages. There was a strong positive correlation between mean latency and its standard deviation in the FS group (ρ = 0.84, P < 10–6, n = 28, Fig. 3C). The group-average latency was 77.1 ± 21.5 ms (n = 28) in FS and 77.1 ± 19.6 ms (n = 12) in FSSO.
Variability in the latency of phototransduction. (A, B) Examples of photoreceptors with low and high mean quantum bump latency. Recordings were performed at a HP of −82 mV. A 1 ms flash of green light was given at the time indicated by the arrow. Stimulus intensity was adjusted to evoke quantum bumps with ca. 50% success rate. (C) Correlation between mean latency and standard deviation in the FS group. (D) Mean CV values for the SO and SA groups in comparison to CVs of the FS and FSSO groups.

The SO group consisted of 6 CV values (6 pairs of recordings), and SA consisted of 14 CV values, the lowest n’s in this study. This was due to difficulties in obtaining high quality elementary responses from a second photoreceptor in an ommatidium already exposed to prolonged stimulation by relatively bright light. The mean CV of the SO group was smaller than the mean CV of the SA group, which in turn was smaller than the CVs of FS and FSSO groups (Fig. 3D).
Absolute sensitivity
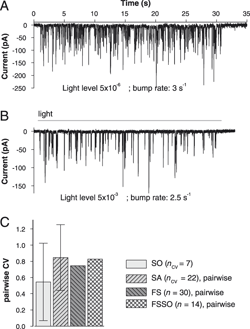
Quantum bumps evoked in dark-adapted photoreceptors by continuous low-intensity stimulation were used to quantify absolute sensitivity. Examples of such experiments are shown in Fig. 4A and 4B. The photoreceptor in panel A is approximately 1000 times more sensitive to light than the photoreceptor in panel B. Such a variability was previously and repeatedly linked to the variability in the size of the photoreceptor as approximated by membrane capacitance (Frolov, Reference Frolov2016).
Variability in absolute sensitivity. (A, B) Examples of current bump responses to a 30 s steady dim light stimulus (dark gray horizontal line) of photoreceptors with relatively high (A) and low (B) absolute sensitivities to light. Bump rates are similar despite a 1000-fold difference in stimulus intensity. (C) Mean pairwise CV values for all groups; here and in Fig. 5 the pairwise CV values were obtained by recombination as described in Materials and methods.

The light level eliciting quantum bumps at a rate of 1 to 10 s−1 varied from cell to cell. Therefore, bump rates were obtained at different light intensities and then recalculated for a common level. The distribution of absolute sensitivity values was not Gaussian. The absolute sensitivity was 1.6 (0.6:2.7) bumps/s (n = 30) in FS and 1.5 (0.45:3.0) bumps/s (n = 14) in FSSO. To compare variation in absolute sensitivity between the experimental groups, pairwise CVs were used as described in Materials and methods. Consistently with other findings, the smallest mean pairwise CV was found in the SO group. In the other three groups, mean pairwise CVs were similar (Fig. 4C).
Macroscopic LIC
The amplitude of sustained LIC in bright light depends on the number of light-activated channels and the light adaptation state of the photoreceptor. Mutually positive correlations were previously reported between C m, absolute sensitivity, and sustained LIC amplitude (Frolov, Reference Frolov2016; Saari et al., Reference Saari, French, Torkkeli, Liu, Immonen and Frolov2017). In these experiments, LIC was evoked by 4 s steady light pulses in the intensity range of 10−5 to 10−1 in tenfold increments (Fig. 5A and 5B), and sustained LIC was determined as mean current during the last 3 s of the pulse. LIC varied strongly from photoreceptor to photoreceptor (Fig. 5A and 5B). Similarly to absolute sensitivity, the distribution of sustained LIC values was not Gaussian. The amplitudes were −483 (−830:−300) pA (n = 61) in FS and −484 (−787:−285) pA (n = 38) in FSSO. Fig. 5C shows that mean pairwise CV was the smallest, albeit not statistically significantly, in the SO group.
Variability in macroscopic LIC. (A, B) Examples of LIC evoked by 4 s pulses of steady light in 10-fold intensity increments (dark gray horizontal lines) in two photoreceptors; photoreceptors usually exhibited irreversible run-down at higher light intensities. A large LIC was produced by a photoreceptor with high C m (A); a small LIC was evoked from a small photoreceptor (B); inset in panel B describes the stimulus. (C) Mean pairwise CV values for LIC at intensity 0.5 a.u. as in panel B inset.

Resting potential and elementary voltage responses
A question remains of how the above-described variabilities contribute to the variability in voltage responses. While the dependencies of macroscopic voltage responses in P. americana on the properties of LIC and C m were examined previously (Heimonen et al., Reference Heimonen, Immonen, Frolov, Salmela, Juusola, Vahasoyrinki and Weckstrom2012; Immonen et al., Reference Immonen, Krause, Krause, Frolov, Vahasoyrinki and Weckstrom2014b), variability in the properties of elementary voltage responses was not studied.
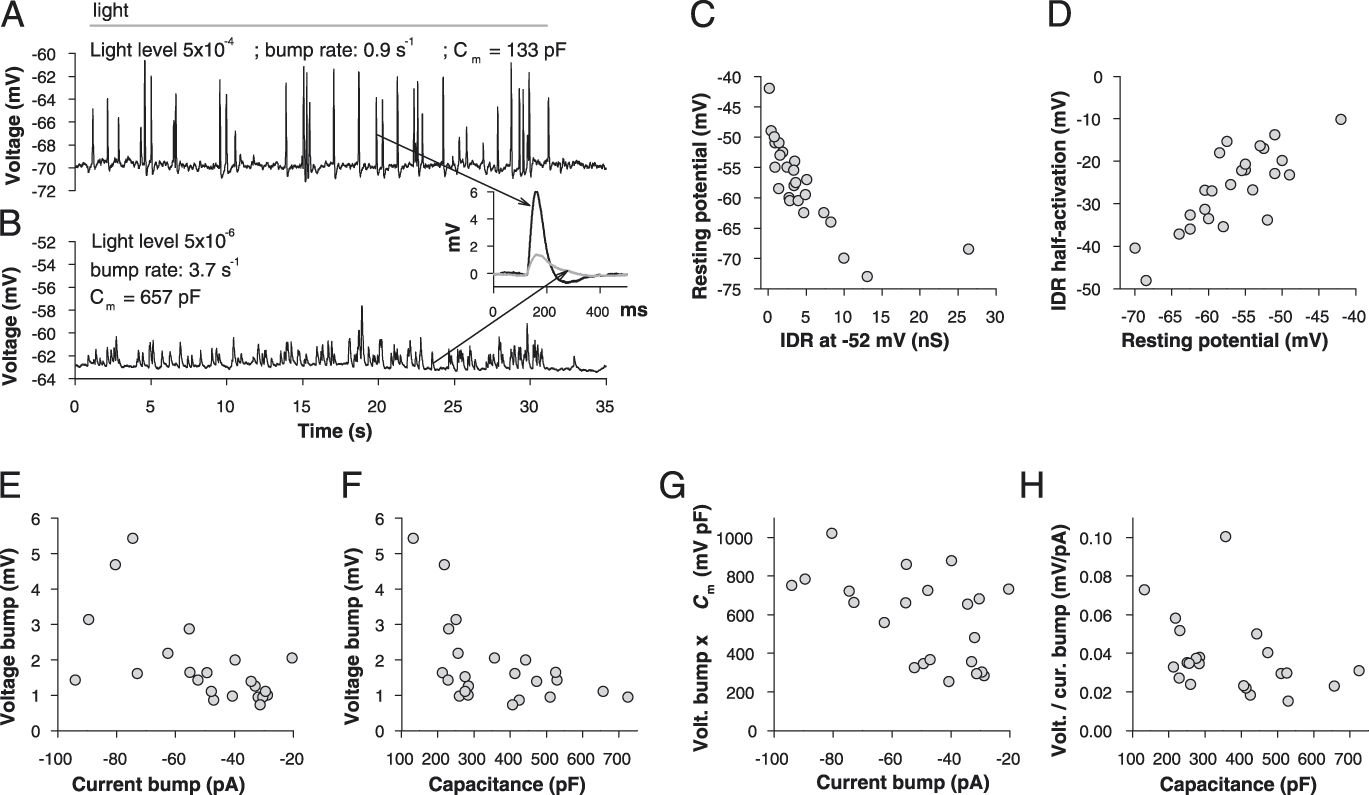
Fig. 7A and 7B show voltage bumps evoked in two dark-adapted photoreceptors by 30 s of steady low-intensity stimulation. These responses illustrate two extremes of voltage bump variability observed in patch-clamp experiments. The smaller photoreceptor (C m = 133 pF, Fig. 7A) was characterized by a relatively low absolute sensitivity (0.9 bumps/s at a light intensity of 5 × 10⁻⁴) and high-amplitude voltage bumps. The highest bumps showed hyperpolarization after the peak (Fig. 7B, inset). The larger photoreceptor (C m = 657 pF, Fig. 7B and inset) had a relatively high absolute sensitivity (3.7 bumps/s at a light intensity of 5 × 10⁻⁶) and small voltage bumps. The group-average voltage bump amplitude was determined by averaging mean bump values obtained for each photoreceptor, equaling 1.8 ± 1.2 mV (n = 22). The CV was 0.67, indicating high variability. In this analysis, data were not separated into experimental groups according to their origin.
In theory, voltage bump properties depend on several dynamically interacting factors, including the current bump amplitude, the driving force for LIC, input resistance, membrane time constant, and the amplitude and kinetics of the counteracting K+ current(s). To isolate the main factors contributing to voltage bump variability in P. americana, I performed a physiological correlation analysis (Table 1).
Spearman’s rank order correlation coefficients for correlations between electrophysiological parameters associated with elementary voltage responses

Numbers in parentheses denote P values; low values indicate statistically significant correlations (in bold). For all correlations, the number of data points was ≥21.
Resting membrane potential determines the driving force for LIC and thus influences the amplitude of voltage response. It can also affect input membrane resistance, which by definition is the membrane resistance at rest. We have previously shown, using a relatively small photoreceptor sample, that resting potential is relatively depolarized in photoreceptors with pharmacologically or genetically suppressed IDR conductance (Immonen et al., Reference Immonen, French, Torkkeli, Liu, Vahasoyrinki and Frolov2017). On average, the resting potential was −59 ± 6 mV (n = 23). A scatter plot in Fig. 7C illustrates the relationship between IDR conductance at −52 mV and resting potential (ρ = −0.87, P < 10−6). It should be noted that similarly strong correlations between IDR conductance and resting potential were also found when IDR conductance values at other voltages between −52 and −2 mV were used. Moreover, the correlation between resting potential and half-activation potential for IDR was also very strong, with a ρ value of 0.75 (n = 26, P < 10−6, Fig. 7D).
Input conductance was estimated from the voltage–current relationships for IDR as the total conductance at resting potential (without subtracting the voltage-independent leak current). The average input conductance was 2.1 ± 1.0 nS (n = 22), corresponding to a mean input resistance of ∼500 MΩ. No statistically significant correlation was found between resting potential and input conductance or between IDR conductance at −52 mV and input conductance (Table 1). As a consequence, no significant correlations were also found between voltage bump amplitude on the one hand and resting potential, input conductance, and IDR on the other hand (Table 1).
As expected, voltage bump amplitudes were correlated with the absolute mean current bump amplitudes recorded in the same photoreceptors (Fig. 7E). This correlation was even stronger than the dependence of voltage bump on C m (Fig. 7F and Table 1). Therefore, variability in voltage bump amplitudes can be explained by inter-photoreceptor variability in current bump amplitudes and C m. To further test the validity of this conclusion, two more correlations were evaluated. The first one was between mean voltage bump divided by mean current bump (absolute value) and C m. The second one was between mean voltage bump amplitude multiplied by C m and mean current bump amplitude (absolute value). Both correlations were statistically significant, with ρ values of −0.47 (P = 0.029) and 0.48 (P = 0.023), respectively (Fig. 7G and 7H).
Inter-individual variability and phenotypic plasticity
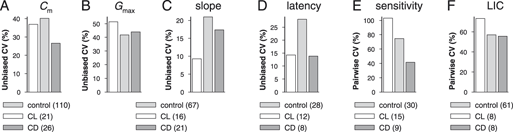
To learn whether the inter-individual (full-sample) variability might be partly caused by environmental factors, I investigated the same six electrophysiological parameters in two additional experimental groups exposed to either CL or constant dark (CD) for several months as described previously (Frolov et al., Reference Frolov, Immonen, Saari, Torkkeli, Liu and French2018). Fig. 8 shows that in the CD group, variability decreased for C m, Kv slope factor, quantum bump latency, and absolute sensitivity, while remaining nearly the same as in control for LIC and Kv G max. In the CL group, the results were more mixed as a strong decrease in CVs was observed for Kv slope and bump latency factors, whereas variability in Kv G max, absolute sensitivity, and LIC amplitudes increased.
Discussion
In this study, I investigated the variability between photoreceptors in P. americana using six key electrophysiological properties. Although there are other measurable properties and information processing related factors available, such as light response amplitude, membrane gain and corner frequency, information rate etc., these all are complex and dynamic derivatives of the relatively basic properties examined here. The high variability in light responses of P. americana photoreceptors was first reported in the intracellular recording study by Heimonen (Heimonen et al., Reference Heimonen, Salmela, Kontiokari and Weckstrom2006) and later further investigated in several patch-clamp studies using a broader range of physiological properties (Immonen et al., Reference Immonen, Krause, Krause, Frolov, Vahasoyrinki and Weckstrom2014b; Salmela et al., Reference Salmela, Immonen, Frolov, Krause, Krause, Vahasoyrinki and Weckstrom2012). Importantly, the variability in voltage response properties was local (Heimonen et al., Reference Heimonen, Salmela, Kontiokari and Weckstrom2006), suggesting that it cannot be explained by differences between the regions of the eye.
This study addressed two broad questions. The first concerned the source of variability in the morphological sense, whether the photoreceptors in the SO are more similar in their properties to each other than to photoreceptors from different ommatidia and whether the intra-individual variability is smaller than the inter-individual variability. The second question was about the mechanistic cause(s) of variability. The results point to two main sources of variation: intra-ommatidial and inter-individual.
Electrophysiological properties
The slope factor of IDR and the latency of phototransduction can be defined as intensive properties, and the other four properties as extensive properties. Intensive properties do not depend on the size of the system, rather reflecting its intrinsic qualitative characteristics. Thus neither the speed of phototransduction nor sensitivity of IDR channels to voltage directly depend on the number of microvilli or IDR channels, respectively. In contrast, C m, G max of IDR, absolute sensitivity, and sustained LIC are inherently dependent on the size of the photoreceptor in specific ways (Frolov, Reference Frolov2016), with C m assumed to be a reliable approximation of the membrane area of the rhabdomere and soma. Although it is not currently possible to obtain precise morphological and electrophysiological measurements from the same photoreceptor to establish the validity of this approximation, a comparison of morphological and electrophysiological estimates of photoreceptor sizes performed for two cockroach species indicated their close covariance (Frolov et al., Reference Frolov, Matsushita and Arikawa2017). Also, our estimations of space constants in the highly convoluted rhabdomere and the thin elongated soma suggested that photoreceptors in P. americana can be considered isopotential (Frolov et al., Reference Frolov, Immonen, Saari, Torkkeli, Liu and French2018).
This distinction between intensive and extensive factors is important since variability was small for the intensive factors and large for the extensive factors. CVs in FS groups were 0.28 for latency, 0.21 for the slope factor, 0.40 for C m, 0.42 for G max, 0.75 for absolute sensitivity (pairwise), and 0.57 for LIC (pairwise).
Photoreceptor latency was measured in dark-adapted photoreceptors using stimuli-evoking photon absorption events with a probability of about 50%. Under such conditions, the influences that accelerate the phototransduction cascade are either negligible (e.g., multiple photon absorptions in the same microvillus) or are in their default state (e.g., intracellular calcium level). If the putative phosphoinositide phototransduction cascade in P. americana is regulated by a G-protein-coupled adenylyl cyclase pathway, as in D. melanogaster (Chyb et al., Reference Chyb, Hevers, Forte, Wolfgang, Selinger and Hardie1999), then the intrinsic variability in the total activity of adenylyl cyclases could contribute to the observed variability. Another possibility could involve variations in the expression of phototransduction proteins, such as phospholipase C (Scott & Zuker, Reference Scott and Zuker1998).
The second intensive parameter is the slope factor of IDR. It essentially measures the strength of interaction between the ion channel and the transmembrane electric field, which depends on the effective charge of the voltage sensor (Islas & Sigworth, Reference Islas and Sigworth1999). As with the latency, the causes variability in the slope factor are not known. However, as IDR is mainly based on EAG channels, with on average a third of conductance mediated by some other delayed rectifier channels (Immonen et al., Reference Immonen, French, Torkkeli, Liu, Vahasoyrinki and Frolov2017), some of the variation may be due to variability in the channel expression patterns. Also, some variation could arise from the synthesis of alternative variants of EAG with different sensitivities to voltage (Ryan et al., Reference Ryan, Maloney, Fineberg, Reenan and Horn2012). Posttranscriptional modification of IDR channels by protein kinases might also contribute to variability.
The same factors that could contribute to variability in the slope factor of IDR could also increase the spread in maximal conductance values. However, because G max depends on the number of channels and their functional state, larger variation would be expected. Indeed, the CV for G max in FS was nearly twice as high as that for the slope factor (Fig. 2G and 2H). Some of the additional variability might be due to suppression of EAG channels by elevated cytosolic calcium (Immonen et al., Reference Immonen, French, Torkkeli, Liu, Vahasoyrinki and Frolov2017), which depends on the variable state of the photoreceptor. However, differences in the size of the somatic membrane where these channels are expressed might be more important. Previously, we demonstrated differences in the strength of correlations between C m and LIC and between C m and G max for IDR, with the former much stronger than the latter, indicating that the two conductances are expressed in different compartments (Salmela et al., Reference Salmela, Immonen, Frolov, Krause, Krause, Vahasoyrinki and Weckstrom2012; Frolov, Reference Frolov2016; Saari et al., Reference Saari, French, Torkkeli, Liu, Immonen and Frolov2017). Although it is unlikely that the relative sizes of the light-insensitive somatic and light-sensitive rhabdomeric membranes are strictly proportional, they must co-vary to some extent, with consequences for G max.
Absolute sensitivity and LIC amplitude were characterized by the highest variance. While most of it probably resulted from differences in rhabdomeric size, high sensitivity of these parameters to the functional state of the photoreceptor could contribute to variability. For instance, absolute sensitivity estimates are based on bump rates, with bumps detected by software. Although in these experiments only photoreceptors exhibiting large bumps were used, since current bump amplitude decreases drastically with increasing illumination, the measurement errors could arise from incomplete recovery after previous stimulation.
Sources of variability
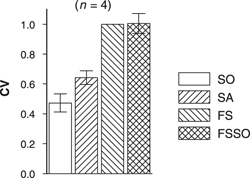
For all studied photoreceptor properties, variation was the smallest in the SO group and the largest in FS/FSSO groups. In the four normally distributed data groups, mean CVs of the SA group were higher than mean CVs of the SO group and smaller than CVs of the FS and FSSO groups, although statistically significant differences were found only for C m data (Fig. 1B). When mean values from plots depicting relationships between correlation coefficients for C m (Fig. 1B), G max (Fig. 2G), slope factor (Fig. 2H), and latency (Fig. 3D) were divided by the respective FS values and averaged, it emerged that on average the variance in SO accounts for less than half the variance in the FS group, with the mean CV of SA group closer to the mean CV of SO than FS group (Fig. 6). It follows that (1) most of the variability between photoreceptors within an animal is caused by intra-ommatidial differences and that (2) there are substantial differences between animals (also see Fig. 1A).
Average variability in C m, G max, slope factor and latency. Mean values from the corresponding plots were divided by the respective FS values and averaged; the error bars represent standard deviations calculated for 4 data points.

It can be seen from Fig. 1C that in the majority of recording pairs from the same ommatidia (20 out of 36), the differences in C m were less than 20% and that there are also two peaks, a smaller one at 0.3 and a sharper peak at 0.6. In contrast, the distribution of CVs in the SA group was normal. This indicates that while the majority of photoreceptors recorded from the same ommatidia were similar to each other, a minority of cases had large differences, i.e., that one or more photoreceptors in the ommatidium was much smaller or bigger than the others. There are two main arrangements of photoreceptors in fused-rhabdom ommatidia, with photoreceptors spanning the entire length of the ommatidium or organized in two tiers (Arikawa & Uchiyama, Reference Arikawa and Uchiyama1996; Snyder et al., Reference Snyder, Menzel and Laughlin1973). In P. americana, morphological studies suggested the first type of organization, although in other cockroaches, the rhabdom clearly has two tiers (Frolov et al., Reference Frolov, Matsushita and Arikawa2017). It is currently not known whether there are systematic differences in the size of photoreceptors in P. americana such as those found in the open-rhabdom ommatidium of Notonecta glauca (Immonen et al., Reference Immonen, Ignatova, Gislen, Warrant, Vahasoyrinki, Weckstrom and Frolov2014a).
Variability in resting potential and voltage bumps
I also investigated the variability of resting potential and mean amplitudes of voltage bumps. The results of physiological correlation analysis indicated that resting potential is a function of IDR conductance: photoreceptors characterized by relatively high IDR had relatively low resting potentials and vice versa (Fig. 7C). Because IDR conductance depends on both the channel density and voltage dependence of channel activation, there was also a strong correlation between resting potential and half-activation potential for IDR (Fig. 7D). The mechanism of the dependence appears to be simple, involving a single negative feedback loop: as efflux of K+ hyperpolarizes the membrane, this hyperpolarization deactivates IDR channels, increasing membrane resistance. The resting potential is thus set at a point where the effect of the progressively diminishing outflow of K+ through IDR channels is negated by depolarizing factors. It follows from this finding that input resistance (or input conductance, its reciprocal) should not depend on resting potential strongly, and this was confirmed (Table 1).
Resting potential and voltage bumps. (A, B) Examples of voltage bump responses to a 30 s steady dim light stimulus (dark gray horizontal line) of photoreceptors with relatively low (A) and high (B) sensitivities to light. Inset: superposition of two typical voltage bumps (arrows). (C) Correlation between the amplitude of sustained IDR at −52 mV and resting potential (ρ = −0.87, P < 10−6, n = 25). (D) Correlation between resting potential and half-activation potential for IDR (ρ = 0.75, n = 26, P < 10−6). (E) Correlation between the mean amplitudes of current and voltage bumps (ρ = 0.63, P = 0.002, n = 22). (F) Correlation between C m and mean voltage bump amplitude (ρ = −0.55, P = 0.007, n = 23). (G) Correlation between current bump amplitude and voltage bump amplitude multiplied by C m (ρ = −0.48, P = 0.023, n = 22). (H) Correlation between C m and voltage bump amplitude divided by the absolute value of current bump amplitude (ρ = −0.47, P = 0.029, n = 22).

Correlation analysis suggested that voltage bump variability is mainly caused by variabilities in two basic electrophysiological parameters, the mean current bump and C m (Fig. 7 and Table 1). Whereas the latter was analyzed comprehensively in this work, the variability in current bump amplitudes (−50 ± 21 pA at −82 mV, n = 22) was not studied due to its high sensitivity to the functional state of the photoreceptor. Overall, these results indicate that the large variability in the amplitude of voltage bumps (CV = 0.67) is a complex combination of variabilities in C m (CV = 0.4), current bumps (CV = 0.42), and input resistance (CV = 0.5).
Phenotypic plasticity and variability
We have recently shown that prolonged exposure of adult cockroaches to either CL or CL can dramatically alter the electrophysiological properties of photoreceptors (Frolov et al., Reference Frolov, Immonen, Saari, Torkkeli, Liu and French2018). In comparison to cockroaches living under the normal 12 h light/12 h dark illumination regimen, photoreceptors in CL-exposed cockroaches demonstrated greatly reduced values of C m, absolute sensitivity, sustained LIC, and relatively short quantum bump latencies, whereas cockroaches maintained for several months in the dark exhibited the opposite changes. While the relative contributions of genetic and environmental factors to the inter-individual variability in the inbred cockroach colony are not known, the observed changes suggested a predominance of environmental factors.
Here I compared CVs for the same six parameters in full-sample control, CL, and CD groups (Fig. 8). It can be seen that variability decreased for the intensive parameters of bump latency and Kv slope factor in both CL and CD groups. However, the results were less straightforward for changes in the extensive, membrane area-related parameters, although CVs for C m were reduced in both groups relative to control. One reason for the increased variability in absolute sensitivity and LIC in the CL group could be that some photoreceptors were almost completely insensitive to light, so that only scarce bumps could be evoked by the brightest stimuli. Although this indicated rhabdomere degeneration, the presence of light-evoked quantum bumps did not allow me to discard such cells from analysis. Consistently, such CL photoreceptors were characterized by very low C m values, at or below 100 pF. Therefore, the results obtained from the CD group appear to be more relevant for this study than the CL data.
Changes in full-sample variability under constant illumination conditions. Data used in the calculation of CVs were published elsewhere (Frolov et al., Reference Frolov, Immonen, Saari, Torkkeli, Liu and French2018).

What could be the functional implications of these variabilities? The inter-individual variability in absolute sensitivity and the related LIC response strength can probably modify exploratory behavior, by reducing light avoidance in cockroaches with lower sensitivity and increasing it in more sensitive animals (Kelly & Mote, Reference Kelly and Mote1990). This would affect the spread of a population but also change the risks of predation. The intra-individual variability might reflect the presence of specialized zones in the retina, although no such zones were found in morphological studies. However, the causes of intra-ommatidial variabilities need to be determined in future studies.
Acknowledgments
The author thanks Prof. Andrew S. French for help with the manuscript.
Abbreviations
Arbitrary unit
- CL
Constant light
- CD
Constant dark
- C m
Whole-cell membrane capacitance
- Kv
Voltage-gated K+ current or conductance
- LIC
Light-induced current