INTRODUCTION
The Laurentide Ice Sheet, which covered much of northern North America during the latest Pleistocene glaciation, is thought to have contained about 80 m of global sea-level equivalent at its maximum volume (Clark and Mix, Reference Clark and Mix2002). Understanding the history of the Laurentide Ice Sheet, particularly the timing of the last glacial maximum extent (Clark et al., Reference Clark, Dyke, Shakun, Carlson, Clark, Wohlfarth, Mitrovica, Hostetler and McCabe2009) and subsequent retreat, is an important step toward clarifying the relationship between global ice volume and sea level. Gaining a better understanding of the relationship between melting ice and rising seas is particularly relevant as we face the prospect of future sea-level rise in response to ice loss in polar regions (Long, Reference Long2009; Lambeck et al., Reference Lambeck, Rouby, Purcell, Sun and Sambridge2014).
The time at which the Laurentide Ice Sheet reached its maximum extent and subsequently retreated remains uncertain. Most ages related to last glacial maximum ice extent come from nonglacial sediments either below or above late Wisconsinan till and therefore provide at best a bracketing chronology (Fullerton, Reference Fullerton1986; Stone and Borns, Reference Stone and Borns1986; Stone et al., Reference Stone, Schafer, London, DiGiacomo-Cohen and Thompson2005). The North American varve chronology (Ridge et al., Reference Ridge, Balco, Bayless, Beck, Carter, Cean, Voytek and Wei2012) further constrains Laurentide Ice Sheet history; ice margin positions are inferred indirectly using sedimentation patterns in glacial lakes. Several studies use cosmogenic nuclides to date directly the last glacial maximum and initial ice recession in northeastern North America (Balco et al., Reference Balco, Stone, Porter and Caffee2002; Balco and Schaefer, Reference Balco and Schaefer2006), but reconciling cosmogenic nuclide exposure age chronologies with radiocarbon chronologies is challenging (Peteet et al., Reference Peteet, Beh, Orr, Kurdyla, Nichols and Guilderson2012). Thus, a conclusive age of the last glacial maximum extent of the Laurentide Ice Sheet in much of northeastern North America remains elusive.
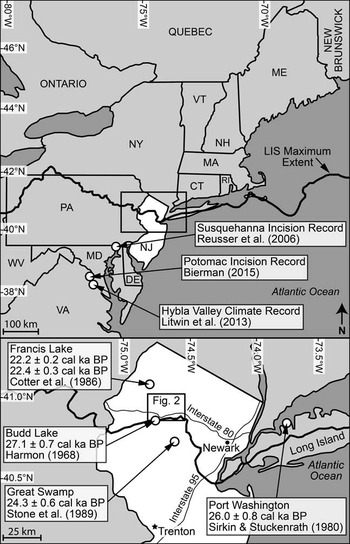
Here, we constrain the age of the Laurentide Ice Sheet maximum extent in north-central New Jersey (Fig. 1), which was glaciated by the western margin of the Hudson-Champlain lobe (Connally and Sirkin, Reference Connally and Sirkin1973). We use analysis of cosmogenic nuclides in glacially abraded bedrock surfaces and boulders directly north of (in most cases only a few kilometers from) the terminal moraine; these ages represent a minimum age limit for the timing of ice recession from the moraine. The goal of this work is to constrain the time when the Laurentide Ice Sheet receded from its maximum extent, adding to the existing chronological data from the region, including cosmogenic nuclide exposure ages on the terminal moraine in Martha’s Vineyard (~300 km to the northeast) from Balco et al. (Reference Balco, Stone, Porter and Caffee2002). We compare cosmogenic nuclide exposure age chronologies and radiocarbon chronologies and explore the regional context of Laurentide Ice Sheet history.
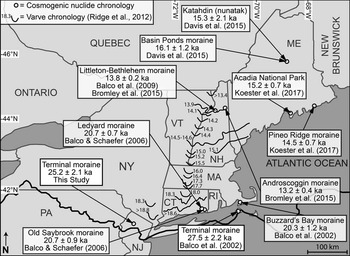
Generalized regional map of the study area, with heavy black line showing the approximate maximum extent of the Laurentide Ice Sheet during the last glacial maximum. Top panel shows the northeastern United States and neighboring Canadian provinces, with climatic and geomorphic records mentioned in the text. Bottom panel shows the northern half of New Jersey with radiocarbon chronology shown in Table 1; black box denotes the extent of Figure 2. Cosmogenic nuclide exposure ages from other studies in northeastern North America are shown in Figure 5.

BACKGROUND: CONSTRAINING GLACIAL HISTORY WITH COSMOGENIC NUCLIDES
Cosmogenic nuclides produced in situ, including 10Be and 26Al, have been used extensively to determine the timing of deglaciation (Nishiizumi et al., Reference Nishiizumi, Winterer, Kohl, Klein, Middleton, Lal and Arnold1989; Phillips et al., Reference Phillips, Zreda, Smith, Elmore, Kubik and Sharma1990; Bierman, Reference Bierman1994; Gosse et al., Reference Gosse, Evenson, Klein, Lawn and Middleton1995a; Fabel and Harbor, Reference Fabel and Harbor1999; Balco, Reference Balco2011; Heyman et al., 2011, Reference Heyman, Applegate, Blomdin, Gribenski, Harbor and Stroeven2016). These nuclides accumulate at well-constrained rates in rock surfaces exposed to cosmic rays (Lal, Reference Lal1988); determining the concentration of the nuclide of interest (in this case 10Be and 26Al) in quartz isolated from samples of glacially abraded bedrock or boulder surfaces quantifies the duration of time that has elapsed since deglaciation (Nishiizumi et al., Reference Nishiizumi, Kohl, Arnold, Dorn, Klein, Fink, Middleton and Lal1993; Gosse and Phillips, Reference Gosse and Phillips2001). Interpreting a cosmogenic nuclide measurement as an exposure age relies on the assumption that most preexisting nuclides from previous periods of exposure were removed by deep erosion (at least several meters) during the last glaciation and that no postglacial erosion or shielding of the surface has occurred. Violations of these assumptions cause overestimates or underestimates of actual exposure ages and thus increase the variance of calculated nuclide concentrations and exposure ages, limiting the precision and accuracy of moraine age estimates.
Cosmogenic nuclides have proved useful in constraining the chronology of Laurentide Ice Sheet glaciation and deglaciation in North America, as reviewed by Briner et al. (Reference Briner, Gosse and Bierman2006a). The use of 10Be (and sometimes 26Al) has helped to determine the age of moraines and other glacial/postglacial features in Maine (Bierman et al., Reference Bierman, Davis, Corbett and Lifton2015; Bromley et al., Reference Bromley, Hall, Thompson, Kaplan, Hgarcia and Schaefer2015; Davis et al., Reference Davis, Bierman, Corbett and Finkel2015; Koester et al., Reference Koester, Shakun, Bierman, Davis, Corbett, Braun and Zimmerman2017), New Hampshire (Bierman et al., Reference Bierman, Davis, Corbett and Lifton2015; Bromley et al., Reference Bromley, Hall, Thompson, Kaplan, Hgarcia and Schaefer2015), Massachusetts (Balco et al., Reference Balco, Stone, Porter and Caffee2002), Connecticut (Balco and Schaefer, Reference Balco and Schaefer2006), Wisconsin (Ullman et al., Reference Ullman, Carlson, LeGrande, Anslow, Moore, Caffee, Syverson and Licciardi2015), Baffin Island (Steig et al., Reference Steig, Wolfe and Miller1998; Davis et al., Reference Davis, Bierman, Marsella, Caffee and Southon1999; Marsella et al., Reference Marsella, Bierman, Davis and Caffee2000; Kaplan et al., Reference Kaplan, Miller and Steig2001; Kaplan and Miller, Reference Kaplan and Miller2003), and northeastern mainland Canada (Clark et al., Reference Clark, Brook, Raisbeck, Yiou and Clark2003). 10Be has been used to study Laurentide Ice Sheet ice margin retreat rates, including episodes of rapid ice loss in Baffin Island (Briner et al., Reference Briner, Bini and Anderson2009) and Labrador (Carlson et al., Reference Carlson, Clark, Raisbeck and Brook2007; Ullman et al., Reference Ullman, Carlson, Hostetler, Clark, Cuzzone, Milne, Winsor and Caffee2016). Paired 26Al/10Be analysis of stacked buried tills in the midwestern United States has clarified glaciation timing and extent over several million years (Balco et al., 2005a, Reference Balco, Stone and Mason2005b; Balco and Rovey, 2008, Reference Balco and Rovey2010).
In regions where the Laurentide Ice Sheet was cold based and nonerosive, the use of multiple cosmogenic nuclides (10Be, 26Al, and/or 14C) provides insight about subglacial erosion efficacy and the long-term preservation of glacially buried surfaces. Multinuclide approaches have been especially useful in Baffin Island, where much of the Laurentide Ice Sheet seems to have been cold based (Bierman et al., Reference Bierman, Marsella, Patterson, Davis and Caffee1999; Briner et al., 2003, 2005, 2006b, Reference Briner, Lifton, Miller, Refsnider, Anderson and Finkel2014; Miller et al., Reference Miller, Briner, Lifton and Finkel2006; Corbett et al., Reference Corbett, Bierman and Davis2016a; Margreth et al., Reference Margreth, Gosse and Dyke2016). In addition to Baffin Island, the existence of a cold-based Laurentide Ice Sheet has been documented using a multiple nuclide approach in mainland Canada (Gosse et al., 1993, Reference Gosse, Grant, Klein and Lawn1995b; Marquette et al., Reference Marquette, Gray, Gosse, Courchesne, Stockli, Macpherson and Finkel2004; Staiger et al., Reference Staiger, Gosse, Johnson, Fastook, Gray, Stockli, Stockli and Finkel2005) and near the margin in the midwestern United States (Bierman et al., Reference Bierman, Marsella, Patterson, Davis and Caffee1999; Colgan et al., Reference Colgan, Bierman, Mickelson and Caffee2002). In the northeastern United States, cold-based ice exited only on the highest summits (Bierman et al., Reference Bierman, Davis, Corbett and Lifton2015), where ice was likely thin and flow was not channelized.
STUDY AREA
Our work focuses on three sample sites (Fig. 2) in the Highlands of north-central New Jersey: Picatinny Arsenal, Allamuchy State Forest, and Weldon Road. Two erosion-resistant rock types, Precambrian gneiss and Paleozoic quartzite, dominate the area (Drake et al., Reference Drake, Volkert, Monteverde, Herman, Houghton, Parker and Dalton1996). At Picatinny Arsenal, the Silurian Green Pond Conglomerate (characterized by quartz pebbles and cobbles in a quartz sand matrix) forms sharp-crested, northeast-trending ridges. The Precambrian Losee Metamorphic Suite, which underlies the Allamuchy State Forest and Weldon Road sites, is characterized by light color and granitic composition. Surficial materials in upland areas include thin, sandy till and scattered slope deposits (Stanford and Witte, Reference Stanford and Witte2006).
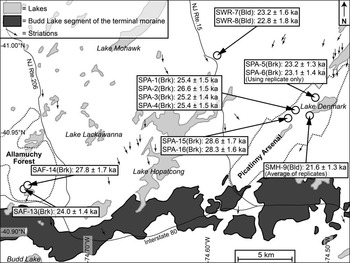
Map of the study area, including the Budd Lake segment of the terminal moraine and striation directions from Stone et al. (Reference Stone, Stanford and Witte2002). Sample sites show 10Be ages and 1σ external uncertainties; “Brk” and “Bld” denote bedrock and boulder samples, respectively. A detailed map of the study area is shown in Supplementary Figure 1.

Glacial erosion in the New Jersey Highlands has produced an upland landscape characterized by numerous large, fresh, polished bedrock outcrops discontinuously covered by thin, patchy till. Upland striations in the study area range in azimuth from 178° to 194° (Fig. 2); these striations record glacial flow normal to the local trend of the terminal moraine a few kilometers to the south. Results of detailed geologic mapping (Stanford, Reference Stanford1993; Stone et al., Reference Stone, Stanford and Witte1995) confirm the extent, thickness, and distinct surface morphological features of the terminal moraine originally described by Salisbury (Reference Salisbury1902) in the area of our sample sites.
Deposits of the Budd Lake segment of the terminal moraine (Stone et al., Reference Stone, Stanford and Witte2002) extend in a belt 0.8–3.5 km wide across the area (Fig. 2; see also Supplementary Figure 1). The moraine segment rises from 195 meters above sea level (m asl) in the valley on the east side of the study area to a maximum of 367 m asl and reaches to 360 m asl on the west side of the area. The moraine averages ~24 m in height above adjacent ground but has a maximum height of ~68 m in valleys. It is composed mostly of till but also contains stratified sediments, flow till, and colluvial deposits; transverse ridges and ridge-and-kettle features may be related to ice margin sediment transport, deposition, and deformation processes during moraine construction (Stone et al., Reference Stone, Stanford and Witte2002).
PREVIOUS WORK: GLACIAL CHRONOLOGY IN THE NORTHEASTERN UNITED STATES
Radiocarbon chronology
The timing of glacial advance has been constrained throughout the northeastern United States with radiocarbon dating. The advancing margin of the Laurentide Ice Sheet likely first entered the northeastern United States through the Champlain Valley ~30–29 14C ka BP (~35–34 cal ka BP) (Parent et al., Reference Parent, Lefebvre, Rivard, Lavoie and Guilbault2015; Rayburn et al., Reference Rayburn, DeSimone, Staley, Mahan and Stone2015) and entered Maine ~29–24 14C ka BP (~33–28 cal ka BP) (Anderson et al., 1986, Reference Anderson, Jacobson, Davis and Stuckenrath1992; Dorion, Reference Dorion1997), as reviewed and recalibrated in Bierman et al. (Reference Bierman, Davis, Corbett and Lifton2015). The Hudson-Champlain lobe of the Laurentide Ice Sheet advanced into the northern New Jersey region ~23–22 14C ka BP (~28–26 cal ka BP) (Fullerton, Reference Fullerton1986; Stone and Borns, Reference Stone and Borns1986; Stone et al., Reference Stone, Stanford and Witte2002; Rayburn et al., Reference Rayburn, DeSimone, Staley, Mahan and Stone2015). The glacial margin then spread westward into the New Jersey Highlands from its axis in the Hudson River lowland. Striations on upland surfaces in the New Jersey Highlands (Stanford, Reference Stanford1993) and across the study area (Stone et al., Reference Stone, Stanford and Witte2002) show that the ice flowed southward across northern New Jersey, reaching its terminal position ~22–21 14C ka BP (26–25 cal ka BP) (Connally and Sirkin, Reference Connally and Sirkin1973; Stone et al., 1989, 1995, Reference Stone, Stanford and Witte2002; Stanford, Reference Stanford1993).
In addition to constraining the timing of Laurentide Ice Sheet advance, regional radiocarbon chronologies have also illustrated the timing and pattern of ice margin retreat. The radiocarbon-dated North American varve chronology, developed throughout western New England (Ridge et al., Reference Ridge, Balco, Bayless, Beck, Carter, Cean, Voytek and Wei2012), has been particularly useful for dating the recession of the Laurentide Ice Sheet margin. In southern New York, the oldest correlated varve provides a minimum limit of ~18.8 ka for the timing of ice retreat for our study site to the southwest. The remaining chronology, biased toward the Connecticut River Valley (and hence not along the same flow line as our study site) shows the ice margin entering southern Massachusetts ~17.7 ka, crossing into Vermont and New Hampshire ~15.5 ka, and ultimately reaching the Canadian border ~13.4 ka (see fig. 12 in Ridge et al. Reference Ridge, Balco, Bayless, Beck, Carter, Cean, Voytek and Wei2012).
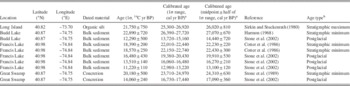
In or near the study area, radiocarbon ages of organic material in preglacial and postglacial sediments constrain the age of the terminal moraine in the New Jersey Highlands, as summarized and recalibrated in Table 1 and Figure 1. Pollen-bearing bulk preglacial sediments from northern Long Island (Sirkin and Stuckenrath, Reference Sirkin and Stuckenrath1980) provide a maximum limiting radiocarbon age of 21.75±0.75 14C ka BP (26.02±0.81 cal ka BP).
Compilation of recalibrated radiocarbon ages constraining the timing of Laurentide Ice Sheet maximum extent and subsequent recession in the study area.

a Ages have been calibrated using the online Calib program version 7.1 and the IntCal13 calibration curve (Reimer et al., 2013).
b Refers to whether the radiocarbon age represents a maximum or minimum limit for the age of the Laurentide Ice Sheet terminal moraine in the study area. See text for details.
Minimum limiting age constraints come from south of, within, and north of the terminal moraine. Outside the glacial limit, a concretion in varved sediments of glacially dammed Lake Passaic (Great Swamp) yielded a radiocarbon age of 20.18±0.50 14C ka BP (24.31±0.63 cal ka BP) (Stone et al., Reference Stone, Reimer and Pardi1989). Concretions can contain old, reworked carbon with the potential to bias ages; although the dates in this core are in stratigraphic order, with a stratigraphically higher concretion yielding a radiocarbon age of 14.06±0.24 14C ka BP (17.09±0.36 cal ka BP) (Stone et al., Reference Stone, Stanford and Witte2002), it is possible that they do not reflect accurately the age of the lake.
Basal lake clay with gyttja from Budd Lake, also impounded along the terminal moraine, yielded a radiocarbon age of 22.89±0.72 14C ka BP (27.07±0.67 cal ka BP) (Harmon, Reference Harmon1968). Again, although this bulk sediment date may contain older carbon not directly related to the age of the lake, ages here are also in stratigraphic order; a younger organic layer in pollen-bearing beds returned an age of 12.29±0.50 14C ka BP (14.44±0.72 cal ka BP) (Stone et al., Reference Stone, Stanford and Witte2002).
Inside the glacial limit, basal bulk sediments from Francis Lake yielded radiocarbon ages of 18.39±0.20 and 18.57±0.25 14C ka BP (22.23±0.22 and 22.43±0.30 cal ka BP) (Evenson et al., Reference Evenson, Cotter, Ridge, Sevon, Sirkin and Stuckenrath1983; Cotter et al., Reference Cotter, Ridge, Evenson, Sevon, Sirkin and Stuckenrath1986). Overlying clay beds yielded upward-younging ages of 16.48±0.43 14C ka BP (19.91±0.53 cal ka BP) and 13.51±0.14 14C ka BP (16.27±0.21 cal ka BP) and were capped by peaty gyttja dating to 11.22±0.11 14C ka BP (13.10±0.12 cal ka BP).
Using radiocarbon ages to infer Laurentide Ice Sheet advance and retreat has limitations (Peteet et al., Reference Peteet, Beh, Orr, Kurdyla, Nichols and Guilderson2012). First, the unknown lag time between ice margin retreat and the onset of organic matter deposition may make minimum age limits too young (Davis and Davis, Reference Davis and Davis1980). The scarcity of organic material in postglacial sediments because of cold conditions also limits the utility of basal radiocarbon ages for developing accurate deglaciation chronologies (Cotter et al., Reference Cotter, Ridge, Evenson, Sevon, Sirkin and Stuckenrath1986; Stone and Borns, Reference Stone and Borns1986; Balco and Schaefer, Reference Balco and Schaefer2006). Additionally, carbon unrelated to the material being dated can contaminate the sample, especially in the case of bulk sediments or concretions (Grimm et al., Reference Grimm, Maher and Nelson2009). If the existing radiocarbon age control is correct, one would expect cosmogenic nuclide exposure ages between ~26.0 ka (Sirkin and Stuckenrath, Reference Sirkin and Stuckenrath1980) and ~22.2 ka (Cotter et al., Reference Cotter, Ridge, Evenson, Sevon, Sirkin and Stuckenrath1986). However, it is important to note that our exposure ages also represent a minimum limit because the sampled surfaces are slightly north of the terminal moraine (Fig. 2).
Regional cosmogenic nuclide exposure age chronology
In addition to radiocarbon dating of organic material, cosmogenic nuclides produced in situ have been employed to determine the timing of maximum ice extent and subsequent ice margin retreat in northeastern North America. In coastal Massachusetts, Balco et al. (Reference Balco, Stone, Porter and Caffee2002) used the exposure ages of boulders along the Martha’s Vineyard terminal moraine to estimate an age of 27.5±2.2 ka (10Be, n=8, average, 1 standard deviation [SD]; ages have been recalculated using the northeastern North American production rates of Balco et al. [Reference Balco, Briner, Finkel, Rayburn, Ridge and Schaefer2009]). Southern New England recessional moraines have been dated with cosmogenic 10Be, including the Buzzard’s Bay moraine in Massachusetts (20.3±1.2 ka, n=10; Balco et al., Reference Balco, Stone, Porter and Caffee2002) and the Ledyard (20.7±0.7 ka, n=7; Balco and Schaefer, Reference Balco and Schaefer2006) and Old Saybrook (20.7±0.9 ka, n=7; Balco and Schaefer, Reference Balco and Schaefer2006) moraines in Connecticut (all ages are average±1 SD and have been recalculated using the northeastern North American production rates). Dates in Maine show that the Basin Ponds moraine near Katahdin was abandoned 16.1±1.2 ka (10Be, n=5, average, 1 SD), and the summit of Katahdin became exposed 15.3±2.1 ka (10Be, n=6, average, 1 SD), suggesting that ice thinning exposed these high areas relatively early (Davis et al., Reference Davis, Bierman, Corbett and Finkel2015). The Laurentide Ice Sheet margin reached coastal Maine around the same time, exposing Acadia National Park 15.2±0.7 ka (10Be, n=16, average, 1 SD) and forming the Pineo Ridge moraine 14.5±0.7 ka (10Be, n=7, average, 1 SD; Koester et al. Reference Koester, Shakun, Bierman, Davis, Corbett, Braun and Zimmerman2017). The retreating ice sheet then exposed the Littleton-Bethlehem moraine in central-northern New Hampshire at 13.8±0.2 ka (10Be, n=4, average, 1 SD) and the Androscoggin moraine in northeastern New Hampshire and western Maine at 13.2±0.4 ka (10Be, n=7, average, 1 SD), as described in Bromley et al. (Reference Bromley, Hall, Thompson, Kaplan, Hgarcia and Schaefer2015).
Like radiocarbon ages, cosmogenic nuclide exposure ages have limitations. Geologic variance because of processes such as moraine crest degradation and boulder surface erosion can lead to a spread of ages rather than a clearly defined central tendency (Applegate et al., 2010, Reference Applegate, Urban, Keller, Lowell, Laabs, Kelly and Alley2012; Heyman et al., Reference Heyman, Stroeven, Harbor and Caffee2011). Inherited nuclides from previous periods of exposure, especially but not exclusively in rock surfaces that glacial ice failed to deeply erode, lead to age overestimates (Heyman et al., Reference Heyman, Stroeven, Harbor and Caffee2011; Briner et al., Reference Briner, Goehring, Mangerud and Svendsen2016). Cover by snow and/or sediment can shield sample surfaces from postglacial nuclide production, causing age underestimates (Schildgen et al., Reference Schildgen, Phillips and Purves2005; Heyman et al., Reference Heyman, Applegate, Blomdin, Gribenski, Harbor and Stroeven2016). Because of limitations with both radiocarbon and cosmogenic nuclide exposure age chronologies, reconciling findings between the two has been a challenge (Peteet et al., Reference Peteet, Beh, Orr, Kurdyla, Nichols and Guilderson2012).
METHODS
Study design and field sampling
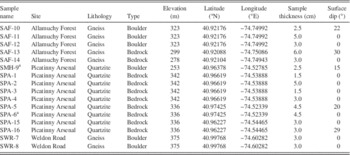
Samples were collected using a hammer and chisel from three separate areas immediately north of the Budd Lake moraine segment (Stone et al., Reference Stone, Stanford and Witte2002) in north-central New Jersey during the summer of 1994 (Fig. 2). Nine samples were taken from Picatinny Arsenal, approximately 4 km north of the moraine; eight of these (SPA-1, -2, -3, -4, -5, -6, -15, and -16) were of bedrock from prominent ridges, and one (SMH-9) was from a boulder at lower elevation, near Lake Denmark. Five samples were taken from Allamuchy State Forest <1 km north of the moraine: two of these (SAF-10 and -11) were from the same ridgetop boulder, SAF-12 came from an adjacent boulder, and two additional samples (SAF-13 and -14) were from a nearby bedrock ridge. Two additional samples (SWR-7 and -8) were taken from a large erratic near Weldon Road ~9 km north of the moraine.
To minimize the likelihood of past till cover over bedrock samples, we selected bedrock surfaces that were either dipping or located on a prominent ridgetop or near a cliff edge. To minimize the likelihood of postdepositional movement or till cover of boulder samples, we selected only the largest boulders (~1.5–2 m in height; see Larsen, Reference Larsen1996 for sample photographs, diagrams, and descriptions) that were near or atop ridges. Sample locations and elevations were estimated using 1:24,000-scale topographic maps (Table 2). Field observations included sample thickness and slope of the sampled surface (Table 2).
Sample collection information for the 16 samples (plus two replicates) investigated in this study.
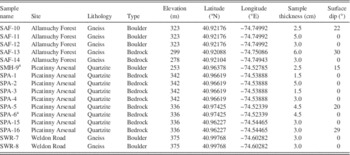
a Denotes a sample that has a laboratory duplicate.
Sample preparation
Sixteen samples were prepared at the University of Vermont in 1995 (as reported in Larsen, Reference Larsen1996; Clark et al., Reference Clark, Bierman and Larsen1995) and prepared again in 2000. The data from 1995 are presented in Supplementary Table 1. In this manuscript, we focus on the higher-precision analyses from 2000 (Tables 3 and 4). We prepared laboratory duplicates for samples SPA-6 and SMH-9, resulting in 18 total paired 26Al/10Be analyses.
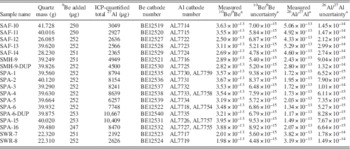
Sample preparation and accelerator mass spectrometry information (second set of analyses, year 2000) for the 16 samples plus two replicates investigated in this study. See Supplementary Table 2 and Supplementary Figure 2 for more detail about blanks. The original analyses (from the year 1995) are provided in Supplementary Table 1.

Note: ICP, inductively coupled plasma.
a Ratios were normalized to standard LLNL1000 for Be and KNSTD9919 for Al and have not been corrected for backgrounds.
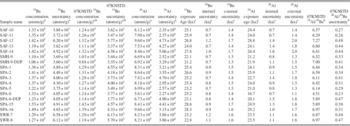
Isotopic concentrations and age information (second set of analyses, year 2000) for the 16 samples plus two replicates investigated in this study. Note that for the purposes of discussion and figures, ages from sample SMH-9 and its replicate SMH-9-DUP have been averaged, whereas the data from sample SPA-6 have been discarded in favor of the data from its replicate SPA-6-DUP.

a All presented isotopic concentrations have been corrected for backgrounds as described in the text.
b Refers to isotopic concentrations that have been scaled to match the currently accepted standard value (07KNSTD; Nishiizumi et al., Reference Nishiizumi, Imamura, Caffee, Southon, Finkel and McAninch2007).
c Simple exposure ages and uncertainties were calculated in the CRONUS Earth calculator (Balco et al., Reference Balco, Stone, Lifton and Dunai2008) using northeastern North American production rates (Balco et al., Reference Balco, Briner, Finkel, Rayburn, Ridge and Schaefer2009).
In 2000, we isolated quartz following standard procedures (Kohl and Nishiizumi, Reference Kohl and Nishiizumi1992), quantified quartz purity using inductively coupled plasma optical emission spectrometry (ICP-OES), and extracted Be and Al as described in Bierman and Caffee (Reference Bierman and Caffee2002) in three separate batches, with each batch including two fully processed blanks. We dissolved ~20–40 g of quartz after adding ~250 μg 9Be (1000 ppm SPEX Be standard) and 27Al as necessary (1000 ppm SPEX Al standard, added to the two samples with low native Al and to all blanks). Total 27Al was quantified in all samples (Table 3) using ICP-OES analysis of small replicate aliquots removed following dissolution as described in Bierman and Caffee (Reference Bierman and Caffee2002).
Isotopic analysis
Isotopic ratios (10Be/9Be and 26Al/27Al) were measured by accelerator mass spectrometry (AMS) at Lawrence Livermore National Laboratory in 1995 (Supplementary Table 1; as reported in Larsen Reference Larsen1996) and in 2000 (Tables 3 and 4; as described here). In the latter set of data (from the year 2000), Be analyses were normalized to standard LLNL1000, and Al analyses were normalized to standard KNSTD9919. The latter set of 10Be/9Be sample ratios (measured in 2000; Table 3) ranged from 2.0×10⁻¹³ to 4.0×10⁻¹³, and 1σ AMS measurement precisions were 2.1±0.4% (n=18, average, 1 SD). Measured sample 26Al/27Al ratios (Table 3) ranged from 1.2×10⁻¹³ to 5.3×10⁻¹³ with 1σ AMS measurement precisions of 4.5±1.2% (n=18, average, 1 SD).
To correct for laboratory and machine backgrounds, we used the mean ratio (± 1 SD) of blanks processed in the three batches (see Supplementary Table 2 and Supplementary Fig. 2 for detailed information about blanks). The background values utilized for all samples measured in 2000 were 2.81±0.69×10⁻¹⁴ for 10Be (n=6) and 2.60±0.54×10⁻¹⁵ for 26Al (n=3). Using a batch-by-batch blank correction instead of the mean blank has little impact on the resulting isotopic concentrations. Sensitivity analysis demonstrates that using a batch-by-batch blank correction instead of the average blank value changes inferred 10Be concentrations by 1.7±1.3% and 26Al concentrations by 0.2±0.1% (n=18, average, 1 SD; see Supplementary Table 3). For the two sets of laboratory duplicates (SPA-6 and SPA-6-DUP; SMH-9 and SMH-9-DUP), calculated 10Be concentrations are more similar between duplicates using the mean blank correction rather than the batch-by-batch blank correction (Supplementary Table 3), supporting our decision to use the mean blank ratio for background correction.
The mass of purified Al from five of the samples (SPA-1, SPA-4, SPA-6, SPA-15, and SPA-16) was large enough to allow preparation of two separate cathodes (Table 3). These duplicate cathodes were run and normalized as described previously, and the resulting analytical runs were combined as if all data had been collected from a single cathode. The increased number of 26Al counts, over what could have been obtained from a single cathode, reduced the uncertainty in the final measured 26Al/27Al ratio.
Because of changes in the nominal 10Be/9Be ratio of standards used to normalize isotopic measurements through the years (Nishiizumi et al., Reference Nishiizumi, Imamura, Caffee, Southon, Finkel and McAninch2007), these samples (analyzed in 2000) were normalized to different standard values than are accepted today. To make these data comparable to modern data sets, we scaled all 10Be data to the newer standard value (07KNSTD; Nishiizumi et al., Reference Nishiizumi, Imamura, Caffee, Southon, Finkel and McAninch2007). In the text, we focus on 10Be concentrations and 26Al/10Be ratios scaled to the currently accepted values for standards; however, both the measured and rescaled data are presented in Table 4.
Exposure age calculations
We calculated 10Be and 26Al exposure ages (Table 4) using the CRONUS Earth online exposure age calculator (Balco et al., Reference Balco, Stone, Lifton and Dunai2008), version 2.2 and constants version 2.2.1, based on analyses from 2000 only. We used the regionally calibrated northeastern North American sea-level production rates of 3.93±0.19 atoms/g/yr for 10Be and 26.5±1.3 atoms/g/yr for 26Al (Balco et al., Reference Balco, Briner, Finkel, Rayburn, Ridge and Schaefer2009) and the Lal/Stone constant production rate model and scaling scheme (Lal, Reference Lal1991; Stone, Reference Stone2000). We made corrections for latitude, elevation, sample density (assumed to be 2.7 g/cm3, representative of the quartzite and gneiss we sampled), sample thickness (ranged from 1.5 to 6.0 cm; Table 2), and topographic shielding caused by the dip of the sample surface (up to 30°; Table 2; with correction factors calculated in the CRONUS Earth online calculator). We made no corrections for snow or till cover because the ridges we sampled were likely windswept and bare. We also made no correction for shielding by surrounding topography, which was negligible.
When comparing exposure ages within the data set, we cite the internal age uncertainties because the samples come from the same area and therefore any errors in production rate scaling will affect all samples similarly. When comparing our age data to other data sets, we cite the external uncertainties (calculated by the CRONUS Earth online exposure age calculator; Balco et al. Reference Balco, Stone, Lifton and Dunai2008) that take into account AMS precision as well as additional uncertainty introduced through the chosen production rate and altitude/latitude scaling scheme.
RESULTS
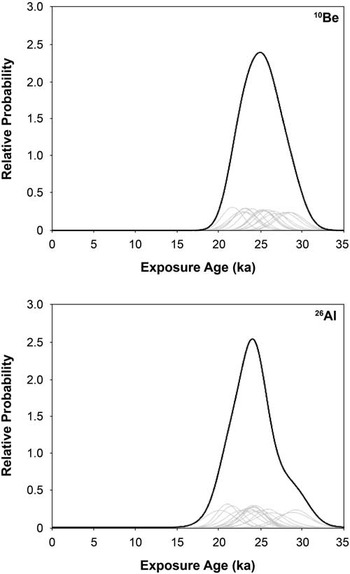
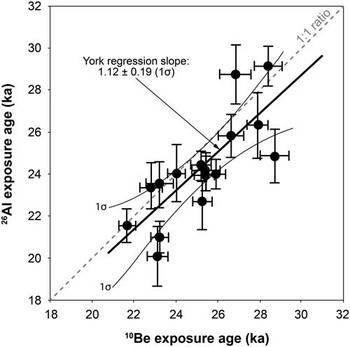
For the samples assessed here (Fig. 2; only those analyzed in 2000, including two replicates), background-corrected 07KNSTD-scaled 10Be concentrations range from 1.06×10⁵ to 1.53×10⁵ atoms/g, yielding exposure ages of 21.2 to 28.6 ka (n=18; Table 4, Fig. 3). Background-corrected 26Al concentrations in samples range from 5.61×10⁵ to 9.66×10⁵ atoms/g, with exposure ages of 16.7 to 29.2 ka (n=18; Table 4, Fig. 3). The 26Al age range narrows to 20.1 to 29.2 ka if one outlier is omitted, as described in the following paragraph. Exposure ages from the two isotopes are related (Fig. 4); a 1σ York regression yields a slope indistinguishable from 1 (1.12±0.19) and a y-intercept indistinguishable from 0 (−3.9±4.6 ka).
Probability density functions for 10Be (top panel) and 26Al (bottom panel) exposure ages and their external uncertainties. Gray lines denote the 16 samples individually; black line shows the summed probability for the data set as a whole.

Comparison of 10Be and 26Al exposure ages (n=16). Gray line shows a 1:1 relationship. Error bars show 1σ internal uncertainties for each isotope. Heavy black line shows a York linear regression, and thin black lines show the 1σ uncertainty envelope around the regression.

There are two laboratory replicates in the data set. For SMH-9 and SMH-9-DUP, both their 10Be (22.1±0.7 ka and 21.2±0.7 ka) and 26Al (21.2±0.8 ka and 21.9±1.1 ka) exposure ages are indistinguishable within 1σ analytic uncertainties. Because of this close agreement, we use the average exposure age and uncertainty for SMH-9 in our data interpretation (21.6±0.7 ka for 10Be and 21.6±0.9 ka for 26Al). However, for SPA-6 and SPA-6-DUP, a sample with high native 27Al concentration in the quartz, the 10Be (25.2±0.8 ka and 23.1±0.8 ka) and 26Al (16.7±0.7 ka and 20.1±1.5 ka) exposure ages differ at 1σ. The poor agreement in this case, as well as the anomalously young 26Al age of SPA-6 in relation to the rest of the data set (Table 4), suggests that the inferred 26Al concentration of SPA-6 is inaccurate. One possible explanation may be loss of Al in sample SPA-6 (but possibly not the duplicate) during laboratory processing, perhaps caused by precipitation of fluoride compounds following digestion. Loss of Al in this case is evidenced by the fact that both SPA-6 and SPA-6-DUP had the same mass of quartz, yet the ICP-quantified total Al in SPA-6-DUP is ~40% higher than in SPA-6 (Table 3). We accordingly reject the data for SPA-6 and use only the data for SPA-6-DUP.
In addition to laboratory replicates, we compare the ages of field replicates. Samples SAF-10 and SAF-11 were collected 1 m apart from the top of the same boulder, and their 10Be (25.2±0.7 ka and 25.9±0.7 ka) and 26Al (24.4±0.7 ka and 24.0±0.7 ka) exposure ages are indistinguishable within 1σ analytic uncertainties. Similarly, samples SWR-7 and SWR-8 were collected <1 m apart from the same boulder, and their 10Be (23.2±1.2 ka and 22.8±1.1 ka) and 26Al (23.5±1.1 ka for both) exposure ages are indistinguishable within 1σ analytic uncertainties. The similarity of both the laboratory and the field replicates suggests that age variability within the data set is geologic, not analytic.
Both isotopes yield unimodal age distributions with well-defined peaks (Fig. 3). Considering all 16 samples together, the central tendency of exposure ages is 25.2±2.1 ka (average, 1 SD) for 10Be (8.3% coefficient of variation) and 24.3±2.5 ka for 26Al (10.3% coefficient of variation). These two age populations, determined with the two different isotopes but on the same samples, are indistinguishable from one another when assessed in a two-tailed, independent samples Student’s t-test (n=16, p=0.26).
It is important to note that the coefficient of variation for both 10Be and 26Al ages is several times greater than the average analytic precision for both nuclides (for 10Be, 8.3% vs. 2.1%; for 26Al, 10.3% vs. 4.5%). This difference indicates that most of the observed scatter is not analytical but rather must be introduced by geologic processes such as low concentrations of inherited nuclides, differing times of boulder deposition, postglacial erosion of sampled surfaces, or partial shielding by snow and/or till cover (Heyman et al., Reference Heyman, Stroeven, Harbor and Caffee2011; Applegate et al., Reference Applegate, Urban, Keller, Lowell, Laabs, Kelly and Alley2012; Briner et al., Reference Briner, Goehring, Mangerud and Svendsen2016). Considering only 10Be measurements, the coefficient of variation for the New Jersey terminal moraine dated here (8.3%) is similar to that of the terminal moraine on Martha’s Vineyard (8.0%; Balco et al., Reference Balco, Stone, Porter and Caffee2002). Recessional moraines dated cosmogenically (Basin Ponds, Pineo Ridge, Androscoggin, Littleton-Bethlehem, Buzzards Bay, Ledyard, Old Saybrook; n= 7; Fig. 5) have lower coefficients of variation (4.1±2.0, 1 SD).
Compilation of cosmogenic 10Be age control for features associated with the maximum extent and subsequent retreat of the Laurentide Ice Sheet in the northeastern United States. Ages show average±1 standard deviation, all calculated with the northeastern North American nuclide production rates of Balco et al. (Reference Balco, Briner, Finkel, Rayburn, Ridge and Schaefer2009); see text for more detail. Also included are ice margin positions based on the North American varve chronology of Ridge et al. (Reference Ridge, Balco, Bayless, Beck, Carter, Cean, Voytek and Wei2012). Heavy dark line shows the Laurentide Ice Sheet maximum extent.

When both isotopes are considered together, 07KNSTD-scaled 26Al/10Be ratios are 5.9 to 7.3 (when SPA-06 is omitted and only its laboratory replicate is used; Table 4). Based on 1σ analytic uncertainties, 9 of the 16 samples have 26Al/10Be ratios that are indistinguishable from an assumed 26Al/10Be production ratio of 6.75; 1 additional sample (SAF-12) has a 26Al/10Be ratio that exceeds 6.75 beyond 1σ uncertainties. The remaining 6 samples (SPA-3, -4, -5, -6-DUP, and -15, plus SAF-11) have 26Al/10Be ratios that fall below an assumed production ratio of 6.75 beyond 1σ uncertainties.
The 10Be concentrations we present here (samples prepared and analyzed in 2000, scaled to 07KNSTD) are similar to 10Be concentrations from the samples prepared and analyzed in 1995 (scaled to 07KNSTD; detailed in Supplementary Table 1). The two data sets form a linear regression (R 2=0.48) that is statistically significant (p=0.01, n=13; Supplementary Fig. 3), although three samples (SPA-15, SPA-16, and SWR-7) are not included in this comparison because the 1995 analyses did not yield usable 10Be/9Be data. The average 10Be concentration of the 1995 analyses is 1.24±0.13×10⁵ atoms/g (n=13, 1 SD), and the average of the 2000 analyses is 1.22±0.10×10⁵ atoms/g (n=13, 1 SD), yielding good agreement despite the intervening five years and numerous methodological developments over that time. The agreement between the 26Al data sets is poorer, yielding no significant linear regression (R 2=0.05, P=0.40, n=15 excluding sample SWR-7; Supplementary Fig. 3). The average 26Al concentration of the 1995 analyses is 7.97±1.31×10⁵ atoms/g (n=15, 1 SD), and the average of the 2000 analyses is 8.09±0.87×10⁵ atoms/g (n=15, 1 SD), yielding two populations that have similar central tendencies but large variance.
DISCUSSION
Assessing cosmogenic nuclide exposure age robustness and limitations
Although numerous geologic factors can affect cosmogenic surface exposure ages (Heyman et al., 2011, Reference Heyman, Applegate, Blomdin, Gribenski, Harbor and Stroeven2016; Applegate et al., Reference Applegate, Urban, Keller, Lowell, Laabs, Kelly and Alley2012), we sought to minimize complications with our sampling strategy. Preserved glacial polish and striations on the quartzite bedrock surfaces indicate that postdepositional erosion has not significantly affected these surfaces. Postdepositional movement of boulders also is unlikely because we targeted boulders on topographically high, flat, bedrock ridgetops. We recognized no evidence for extensive erosion of till cover from our sample sites; till is present only in scattered thin patches on the outcrops, and we found no colluvium attributable to the removal of till, nor did we find extensive boulder or gravel lag deposits on outcrops as might be expected if a till matrix had been eroded. All boulders sampled were 1.5–2 m high, making the possibility of postglacial burial by sediment and/or snow, as well as the likelihood of postdepositional movement, small. However, the presence of thick, persistent snow cover in postglacial times cannot be discounted; such snow cover would make our ages too young (Schildgen et al., Reference Schildgen, Phillips and Purves2005).
In general, the boulder and bedrock surfaces we sampled were likely free of significant inherited nuclides produced by neutron spallation during previous periods of exposure. The widespread occurence of striations in the study area (Fig. 2; Stone et al., Reference Stone, Stanford and Witte2002) indicates that the Laurentide Ice Sheet was warm based and erosive, removing weathered and fresh material from most rock surfaces; the range in striation directions (Fig. 2) suggests warm-based ice dominated during advance, stasis, and retreat. Further, the data set does not display patterns typically seen in areas of cold-based, nonerosive ice as reviewed in Corbett et al. (Reference Corbett, Bierman and Davis2016a). The population (n=10) of bedrock 10Be ages is indistinguishable from the population (n=6) of boulder 10Be ages (p=0.17 using a two-tailed, independent samples Student’s t-test), suggesting that boulders and bedrock share a common exposure history. Both the 10Be and 26Al data form unimodal age distributions (Fig. 3) rather than multimodal age distributions indicative of boulder recycling (Marsella et al., Reference Marsella, Bierman, Davis and Caffee2000; Briner et al., Reference Briner, Miller, Davis and Finkel2005; Corbett et al., 2016a, Reference Corbett, Bierman and Rood2016c). However, the presence of low concentrations of nuclides inherited from deep, muon-induced production during previous interglacials cannot be discounted (Briner et al., Reference Briner, Goehring, Mangerud and Svendsen2016), as explored below in more detail.
26Al/10Be ratios are indistinguishable from or slightly exceed an assumed production ratio of 6.75 for 10 of the 16 samples but fall below the production ratio beyond 1σ uncertainties for 6 samples. It is possible the samples with ratios <6.75 experienced burial following initial exposure, thus yielding low ratios because 26Al decays more quickly than 10Be. However, because long burial durations (several hundred thousand years; see fig. 9 in Bierman et al., Reference Bierman, Marsella, Patterson, Davis and Caffee1999) are required for burial to be detectable with the 26Al/10Be system, we believe that it is unlikely these samples record extended burial. Such long burial durations seem implausible so close to the Laurentide Ice Sheet margin, where the duration of ice cover is limited to the time of maximum glacial conditions.
Rather, we hypothesize that the slightly lower than expected 26Al/10Be ratios in our data set may be driven by limitations in the preparation and analysis of the Al samples in the early days of 26Al studies, particularly loss of 27Al through precipitation of fluorides (Bierman and Caffee, Reference Bierman and Caffee2002). Possible loss of 27Al, especially in samples where the purified quartz contained high native 27Al concentrations, is evidenced by the disagreement between ICP-quantified total 27Al in sample SPA-06 and its duplicate as previously discussed (Table 3), as well as the significant inverse relationship between total 27Al and 26Al/10Be (n=18, R 2=0.25, p=0.04). Poor quantification of total 27Al may be further evidenced by the weak agreement between the inferred 26Al exposure ages from the 1995 and 2000 AMS analyses (Supplementary Fig. 3), although it is impossible to separate laboratory and measurement error. Because of the potential underestimate of total 27Al, we rely on the 10Be data for estimating the age of the terminal moraine; however, the difference between the 26Al and 10Be age estimates is slight (<1 ka, and, as populations of ages, the central tendencies are indistinguishable [p=0.26]).
Cosmogenic nuclide exposure ages and regional relationships
Using an average age for all samples (because the ages form a unimodal population; Fig. 3), we estimate that abandonment of the Budd Lake segment of the terminal moraine occurred before 25.2±2.1 ka (10Be, n=16, average, 1 SD). This age represents a minimum limiting age for ice recession from the maximum ice extent because our sampled surfaces are slightly north of the terminal moraine (Fig. 2). Although detailed field mapping (Stone et al., Reference Stone, Stanford and Witte2002; as summarized in Supplementary Fig. 1) indicates the presence of numerous recessional sedimentary units within the study area, these stratigraphic units are not separable by age based on the cosmogenic data we present here because ice retreat occurred more rapidly than the effective resolution of the cosmogenic chronometer.
The age constraints we propose for the terminal moraine in New Jersey are broadly consistent with other 10Be chronologies of Laurentide Ice Sheet maximum extent and retreat in northeastern North America (Fig. 5). Exposure dating with 10Be on the Martha’s Vineyard terminal moraine (ages originally from Balco et al. [Reference Balco, Stone, Porter and Caffee2002]; recalculated here using the locally calibrated northeastern North American production rates of Balco et al. [Reference Balco, Briner, Finkel, Rayburn, Ridge and Schaefer2009]) yields an age estimate of 27.5±2.2 ka (eight boulders in the central population, average, 1 SD). This age is indistinguishable from the minimum limit we propose for ice recession from the terminal moraine in north-central New Jersey.
Although other cosmogenic nuclide exposure age studies are not along the same flow line as our study site, 10Be ages (recalculated here as described previously) provide a general picture of ice margin retreat following abandonment of the terminal moraine (Fig. 5). Recessional moraines on Cape Cod, to the east of our study site, yield ages of ~20 ka (Balco et al., Reference Balco, Stone, Porter and Caffee2002). Recessional moraines in southern Connecticut are also ~20 ka (Balco and Schaefer, Reference Balco and Schaefer2006). The ice margin to the east had reached coastal Maine by ~15–14 ka, exposing the area of Acadia National Park and forming the Pineo Ridge moraine (Koester et al., Reference Koester, Shakun, Bierman, Davis, Corbett, Braun and Zimmerman2017); ice sheet thinning likely exposed the summit of Katahdin at about the same time (Davis et al., Reference Davis, Bierman, Corbett and Finkel2015). The Laurentide Ice Sheet margin then reached northern New Hampshire ~13 ka (Balco et al., Reference Balco, Briner, Finkel, Rayburn, Ridge and Schaefer2009; Bromley et al., Reference Bromley, Hall, Thompson, Kaplan, Hgarcia and Schaefer2015), implying that it took ~12 ka for the Laurentide Ice Sheet margin to retreat across the northeastern United States (Fig. 5).
Reconciling 10Be and 14C chronologies
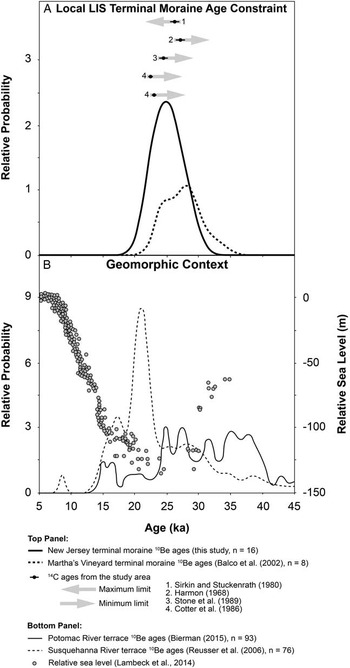
Reconciling chronological records of glacial history developed with different methods, such as cosmogenic exposure and radiocarbon dating, is challenging because each method has its own assumptions and limitations (Balco and Schaefer, Reference Balco and Schaefer2006; Peteet et al., Reference Peteet, Beh, Orr, Kurdyla, Nichols and Guilderson2012). However, in our study area, the agreement between the two approaches is good; the average 10Be age of our sample population, which represents a minimum limit for the age of the terminal moraine (Fig. 2), is compatible with the existing radiocarbon chronology (Table 1, Figs. 1 and 6). The 10Be age of 25.2±2.1 ka (average, n=16, 1 SD) that we infer is indistinguishable from the maximum limit of 26.02±0.81 cal ka BP from Sirkin and Stuckenrath (Reference Sirkin and Stuckenrath1980), the age of 27.07±0.67 cal ka BP from Harmon (Reference Harmon1968), and the minimum limit of 24.31±0.63 cal ka BP from Stone et al. (Reference Stone, Reimer and Pardi1989). The 10Be age is older than the minimum limits of 22.23±0.22 and 22.43±0.30 cal ka BP from Cotter et al. (Reference Cotter, Ridge, Evenson, Sevon, Sirkin and Stuckenrath1986). However, despite the appearance of good agreement, none of the radiocarbon ages near the study area are from macrofossils; rather, they are amalgamated basal sediment that may have contained 14C-dead material from calcite or recycled organic carbon, making it possible that they are too old. Despite these methodological uncertainties, or perhaps because of them, the 10Be exposure age for the New Jersey terminal moraine supports earlier interpretations of deglaciation timing based on radiocarbon (Sirkin and Stuckenrath, Reference Sirkin and Stuckenrath1980; Cotter et al., Reference Cotter, Ridge, Evenson, Sevon, Sirkin and Stuckenrath1986; Stone and Borns, Reference Stone and Borns1986; Stone et al., Reference Stone, Reimer and Pardi1989).
Synthesis of Laurentide Ice Sheet maximum (LIS) extent and geomorphic context. (A) Comparison of constraints on the timing of maximum extent proximal to the study area from different approaches. Cosmogenic nuclide 10Be exposure ages (Table 4) are expressed as summed probability density functions that incorporate each sample’s 1σ external uncertainty. Radiocarbon ages (only those local to the study area, Table 1) are shown in calibrated ka BP with error bars that show the 1σ calibrated age range. (B) Regional geomorphic context. Cosmogenic nuclide exposure ages of Potomac and Susquehanna River bedrock strath terraces are expressed as summed probability density functions, rescaled to 07KNSTD as described in the text. Both terrace age distributions have been trimmed to a maximum age of 45 ka.

Regionally, reconciling cosmogenic nuclide exposure ages and radiocarbon ages is more challenging. Cosmogenic ages of moraines are in coarse agreement with the varve chronology (Fig. 5), although to some extent this is a circular argument because the northeastern North American nuclide production rates of Balco et al. (Reference Balco, Briner, Finkel, Rayburn, Ridge and Schaefer2009) are partially calibrated against the North American varve chronology (Ridge et al., Reference Ridge, Balco, Bayless, Beck, Carter, Cean, Voytek and Wei2012). The southern Connecticut moraine ages of Balco and Schaefer (Reference Balco and Schaefer2006), 20.7±0.9 and 20.7±0.7 ka (Fig. 5), are consistent with the minimum limit of 18.6 ka from the Connecticut River Valley varves to the north (fig. 12 in Ridge et al., Reference Ridge, Balco, Bayless, Beck, Carter, Cean, Voytek and Wei2012). In northern New Hampshire, the moraine ages of Balco et al. (Reference Balco, Briner, Finkel, Rayburn, Ridge and Schaefer2009) and Bromley et al. (Reference Bromley, Hall, Thompson, Kaplan, Hgarcia and Schaefer2015), dating to 13.8±0.2 and 13.2±0.4 ka (Fig. 5), are in agreement with hypothesized ice margin positions in the same region dated to 13.9 and >13.4 ka with varve chronology (fig. 12 in Ridge et al., Reference Ridge, Balco, Bayless, Beck, Carter, Cean, Voytek and Wei2012). Conversely, although less well constrained in the older parts of the record, the reconstructed ice margin positions of Dyke (Reference Dyke2004) generally indicate later ice margin retreat than do the cosmogenic ages. Based on a regional compilation of radiocarbon ages (his fig. 4), Dyke (Reference Dyke2004) places the ice sheet margin at its maximum extent at 21.4 cal ka BP, which is considerably younger than the age that we infer in New Jersey (>25.2±2.1 ka) and that Balco et al. (Reference Balco, Stone, Porter and Caffee2002) infer in Martha’s Vineyard (27.5±2.2 ka). Similarly, radiocarbon ages in Dyke (Reference Dyke2004) place the ice margin in southern Connecticut at 19.1 cal ka BP, which is 1.6 ka younger than the moraine ages of Balco and Schaefer (Reference Balco and Schaefer2006).
Although many factors likely complicate the agreement between cosmogenic exposure and radiocarbon chronologies, including cosmogenic nuclide production rate uncertainty, one possible explanation is the presence of small but pervasive concentrations of inherited cosmogenic nuclides from previous periods of exposure. Sediment emanating from beneath the Greenland Ice Sheet today has low but detectable concentrations of 10Be, averaging several thousand atoms per gram (Nelson et al., Reference Nelson, Bierman, Shakun and Rood2014). This is similar to sediment emanating from beneath the Greenland Ice Sheet in the early Holocene (Goehring et al., Reference Goehring, Kelly, Schaefer, Finkel and Lowell2010) and through much of the middle and late Pleistocene (Bierman et al., Reference Bierman, Shakun, Corbett, Zimmerman and Rood2016). Such concentrations are the equivalent of hundreds to as much as a thousand years of surface exposure at sea level. Cobble-sized rocks removed from the modern Greenland Ice Sheet margin appear to have lower but still detectable concentrations of 10Be, averaging several hundred to several thousand atoms per gram (Corbett et al., Reference Corbett, Bierman, Neumann and Graly2016b). Conversely, boulders recently exposed from beneath a small glacier on southern Baffin Island did not have any detectable 10Be (Davis et al., Reference Davis, Bierman, Marsella, Caffee and Southon1999), although both laboratory blanks and analytic detection limits have lowered considerably since Davis et al. made those measurements.
Low concentrations of inherited 10Be in rock surfaces may be sufficient to explain, at least partially, cosmogenic nuclide exposure ages that exceed radiocarbon ages. If these low concentrations of inherited 10Be were produced by spallation in surface material during past periods of exposure, their presence would indicate low erosion efficiency of glacial ice. More likely, given abundant evidence of warm-based ice in the field area, any inherited nuclides in our samples were produced by muons, which penetrate deeply into Earth’s surface materials (Heisinger et al., Reference Heisinger, Lal, Jull, Kubik, Ivy-Ochs, Neumaier, Knie, Lazarev and Nolte2002). Numerical models of Briner et al. (Reference Briner, Goehring, Mangerud and Svendsen2016) and Bierman et al. (Reference Bierman, Shakun, Corbett, Zimmerman and Rood2016) demonstrate that muon-produced 10Be is likely present in rocks at low but measurable concentrations even after glacial erosion has stripped many meters of surface material, making it possible for inherited 10Be to exist in samples (albeit at very low levels) regardless of glacial erosion efficiency.
The role of muon production in deeply sourced rocks becomes especially important with long interglacial exposure durations (tens of thousands of years), when the low production rate of 10Be from muons (only ~3% of surface spallation rates; Phillips et al., Reference Phillips, Argento, Balco, Caffee, Clem, Dunai and Finkel2016) continues for sufficient time to build up measurable quantities of 10Be (see fig. 4 in Briner et al., Reference Briner, Goehring, Mangerud and Svendsen2016). Such long interglacial exposure times typify marginal areas of the former Laurentide, Scandinavian, and Cordilleran Ice Sheets, which ablate completely and reform with each glacial cycle. In contrast, the Greenlandic and Antarctic Ice Sheets remain at least partially intact through most interglacial periods, thereby shielding underlying rock and minimizing nuclide production even by muons. Therefore, muon-produced 10Be likely plays a more significant role in cosmogenic ages of glacial features of mid-latitude ice sheets than of high-latitude ice sheets.
Inherited cosmogenic nuclides produced by muons may make 10Be ages too old by hundreds or perhaps a thousand years (Briner et al., Reference Briner, Goehring, Mangerud and Svendsen2016). However, muon-produced 10Be is not sufficient to explain the disagreement between cosmogenic nuclide exposure ages from the Laurentide Ice Sheet terminal moraine of ~25 ka (this study) and ~27 ka (Balco et al., Reference Balco, Stone, Porter and Caffee2002) and radiocarbon ages from the oldest varves of ~19 ka (Ridge et al., Reference Ridge, Balco, Bayless, Beck, Carter, Cean, Voytek and Wei2012). Because the cosmogenic nuclide ages come from the terminal moraine and the oldest varves are tens of kilometers north of the terminal moraine (Fig. 5), it appears that initial ice margin retreat occurred very slowly. Alternatively, the offset could be explained if all samples in this data set as well as those of Balco et al. (Reference Balco, Stone, Porter and Caffee2002) contained significant concentrations of inherited 10Be from prior exposure. We consider the latter unlikely given the close agreement between bedrock and boulder ages in our data set and the presence of striations on rock surfaces (Fig. 2).
Climatic and geomorphic context
Both regionally and globally, our results place the abandonment of the Laurentide Ice Sheet terminal moraine in the Highlands of New Jersey during peak glacial conditions. In the Hybla Valley of northern Virginia (Fig. 1), ~320 km southwest of our study site, a 100 ka pollen record based on the abundance of Quercus (oak) pollen shows the coldest conditions in the eastern-central United States lasted from ~28 to 21 ka (Litwin et al., Reference Litwin, Smoot, Pavich, Markewich, Brook and Durika2013). Deglaciation from the terminal moraine occurred in the middle of this interval, before 25.2±2.1 ka (average, n=16, 1 SD) as determined cosmogenically and within local bracketing radiocarbon ages of ~27–22 cal ka BP (Harmon, Reference Harmon1968; Sirkin and Stuckenrath, Reference Sirkin and Stuckenrath1980; Cotter et al., Reference Cotter, Ridge, Evenson, Sevon, Sirkin and Stuckenrath1986; Stone et al., Reference Stone, Reimer and Pardi1989).
Climate records from the high northern latitudes indicate generally similar timing of the last glacial maximum to the age we infer for the Laurentide Ice Sheet terminal moraine in New Jersey. Oxygen isotopes from Greenland ice cores suggest that the height of glacial conditions occurred ~22 ka (Camp Century; Dansgaard et al. Reference Dansgaard, Johnsen, Moller and Langway1969) or ~26–24 ka (GISP2; Stuiver and Grootes, Reference Stuiver and Grootes2000). Sediments from a compilation of North Atlantic marine cores place the height of glacial conditions ~27–24 ka (Bond et al., Reference Bond, Showers, Cheseby, Lotti, Almasi, deMenocal, Priore, Cullen, Hajdas and Bonani1997), whereas sediments from Lake El’Gygytgyn in Siberia find the height of glacial conditions slightly later, ~22–18 ka (Melles et al., Reference Melles, Brigham-Grette, Glushkova, Minyuk, Nowaczyk and Hubberten2007). Compilations of sea-level data define the last glacial maximum as ~26–19 ka (Clark et al., Reference Clark, Dyke, Shakun, Carlson, Clark, Wohlfarth, Mitrovica, Hostetler and McCabe2009) or ~29–20 ka (Lambeck et al., Reference Lambeck, Rouby, Purcell, Sun and Sambridge2014).
The presence of the Laurentide Ice Sheet in New Jersey and adjacent southeastern Pennsylvania influenced regional geomorphology through the ice sheet’s impact on climate, glacial isostacy, and changes in sediment supply. Extensive 10Be dating of strath terraces (Reusser et al., Reference Reusser, Bierman, Pavich, Larsen and Finkel2006) along the Susquehanna River (Fig. 1), the headwaters of which were partially glaciated, shows that incision started ~25 ka and peaked at ~21 ka (Fig. 6). The timing of Susquehanna River incision is coincident with the local last glacial maximum (according to ages presented here) and with initial ice margin retreat and meltwater generation. This incision may reflect a combination of high, meltwater-augmented flows and/or the presence of glacial sediment that increased erosivity of the floodwaters. South of the glacial limit, the unglaciated Potomac River (Fig. 1) also incised, leaving several strath terrace levels at Great Falls (Bierman, Reference Bierman2015). Incision there mostly predates the glacial maximum with the most significant mode of 10Be exposure ages between 37 and 22 ka (Fig. 6). With the outlet of the Potomac River into Chesapeake Bay located at the zone of maximum glacioisostatic subsidence today (and thus maximum forebulge uplift during glaciation; Engelhart et al., Reference Engelhart, Horton, Douglas, Peltier and Törnqvist2009; DeJong et al., Reference DeJong, Bierman, Newell, Rittenour, Mahan, Balco and Rood2015), and lacking glacial meltwater influences, incision there must have been controlled by a combination of isostatically driven land surface uplift and the influence of climate on river flow.
Our results suggest that the Laurentide Ice Sheet in the northeastern United States began to retreat from its maximum extent before other large ice sheets. For example, the interconnected Eurasian ice sheets (British-Irish, Svalbard-Barents-Kara Seas, and Scandinavian) did not achieve their maximum extent until ~21 ka (Hughes et al., Reference Hughes, Gyllencreutz, Lohne, Mangerud and Svendsen2016). The Cordilleran Ice Sheet reached its maximum several thousand years later, ~17–18 ka (Clague and James, Reference Clague and James2002). We do not know why the Laurentide Ice Sheet terminal moraines in the northeastern United States are older than other terminal ice sheet moraines, but the pattern may extend to the North Atlantic region as a whole; the western margin of the Eurasian Ice Sheet reached its maximum earlier than the rest of the ice sheet, ~27–26 ka (Hughes et al., Reference Hughes, Gyllencreutz, Lohne, Mangerud and Svendsen2016) and similar to the age we infer for the southeastern margin of the Laurentide Ice Sheet. The difference in timing may also be related to ice sheet size (with the Laurentide being the largest of the now-vanished Northern Hemisphere ice sheets), ice flow dynamics, regional differences in climate, and/or differences in the chronological techniques used to constrain the timing of maximum extent.
CONCLUSIONS
Here, we date glacial recession from the Laurentide Ice Sheet terminal moraine in New Jersey. Using 10Be cosmogenic nuclide exposure ages of 16 bedrock and boulder samples, we infer that the Budd Lake segment of the terminal moraine was abandoned before 25.2±2.1 ka (average, 1 SD). This age is in close agreement with bracketing radiocarbon ages from the study region as well as cosmogenic age estimates for the terminal moraine to the east, on Martha’s Vineyard. The uncertainty in our age estimate and that of the moraine on Martha’s Vineyard is similar (~8%); both are dominated by sample-to-sample age variance rather than analytic precision, most likely caused by the violation of assumptions inherent to exposure dating. The timing of glacial recession from the Laurentide Ice Sheet terminal moraine is consistent with the height of glacial conditions and the resultant sea-level lowstand as documented by other proxy records regionally and globally, and with river incision history in the mid-Atlantic region.
ACKNOWLEDGMENTS
Funding for this work was provided by Geological Society of America Field Research Grant #5394-94 to P. Larsen and National Science Foundation EAR #9396261 to P. Bierman. We thank C. Massey for field assistance and J. Turner for laboratory assistance. Personnel at the Picatinny Arsenal in Dover, New Jersey, provided access to sample sites. Isotopic measurements were made at the Center for Accelerator Mass Spectrometry, Lawrence Livermore National Laboratory with assistance from R. Finkel, J. Koenig, and J. Southon. Previous versions of this manuscript were improved by reviews from B. Atwater, E. Brook, M. Burbach, R. Carswell, K. Marsella, M. Reheis, and J. Stone. We thank J. Briner and one anonymous journal reviewer for constructive comments on the current version, as well as M. Pavich for U.S. Geological Survey review.
SUPPLEMENTARY MATERIALS
For supplementary material/s referred to in this article, please visit https://doi.org/10.1017/qua.2017.11