Introduction
Reproductive and economic efficiencies in beef and dairy production systems are affected by the age of puberty and the beginning of reproductive life (Kenny et al., Reference Kenny, Heslin and Byrne2017). Puberty onset is defined as the first oestrus followed by a normal luteal phase (Moran et al., Reference Moran, Quirke and Roche1989). In domestic ruminants, puberty is achieved as a result of decreased estradiol negative feedback on luteinizing hormone (LH) secretion, which leads to an increase in size and estradiol production of dominant ovarian follicles, and a pubertal surge of LH (Day and Nogueira, Reference Day and Nogueira2013).
Brazilian dairy herds are mainly composed of Bos taurus taurus vs Bos taurus indicus crossbred animals, and Gir is the main zebu breed used (Canaza-Cayo et al., Reference Canaza-Cayo, Cobuci, Lopes, de Almeida Torres, Martins, dos Santos Daltro and Barbosa da Silva2016). Intensive use of the Gir breed relies on its increased adaptability to tropical conditions combined with considerable high milk production among indicine breeds (Madalena et al., Reference Madalena, Lemos, Teodoro, Barbosa and Monteiro1990). As the age of puberty is a heritable trait, genetics has a primary influence on age at first ovulation (Day and Nogueira, Reference Day and Nogueira2013). Gir is a late-puberty breed compared with taurine breeds such as Holstein. Although it is difficult to determine age at puberty in extensive management systems, it can be estimated from age at first calving. Brazilian records from the Gir and Holstein breeding programmes, published by Embrapa Dairy Cattle, show an expected age at first calving of 38.6 ± 6.3 months in Gir (Panetto et al., Reference Panetto, Silva and Verneque2021) and 26.5 ± 5.0 months in Holstein (Costa, Reference Costa2022) heifers. Therefore, the late-puberty onset compromises ∼1 year of reproductive life in Gir females.
Treatment with progesterone-based hormonal protocols during the peri-pubertal period can accelerate the onset of puberty in heifers and is an alternative approach undertaken to advance the beginning of their reproductive life ((Rodrigues et al., Reference Rodrigues, Peres, Lemes, Martins, Pereira, Day and Vasconcelos2013). This is especially relevant to late-pubertal Bos taurus indicus heifers (Sartori et al., Reference Sartori, Bastos, Baruselli, Gimenes, Ereno and Barros2010). The ability of a heifer to respond to an induction treatment appears to be an indirect way to select more precocious heifers as their capacity to respond to hormonal treatment is related to their expected age of spontaneous ovulation (Day and Nogueira, Reference Day and Nogueira2013). Despite the studies on puberty induction being dominantly focused in indicine beef breeds, in the dairy Gir breed, puberty induction and related endocrine responses remain unexplored.
The use of reproductive technologies such as IVF in prepubertal animals is also an alternative to accelerate reproduction in Gir heifers. However, it seems that oocytes obtained from heifers before puberty are less competent than the ones sourced from adult cyclic cows (Baruselli et al., Reference Baruselli, Batista, Vieira, Ferreira, Guerreiro, Bayeux, Sales, Souza and Gimenes2016). Prepubertal oocytes are smaller in diameter, have impaired metabolism and undergo a disrupted maturation process (Steeves et al., Reference Steeves, Gardner, Zuelke, Squires and Fry1999; De Paz et al., Reference De Paz, Sánchez, De la Fuente, Chamorro, Alvarez, Anel and Anel2001; Salamone et al., Reference Salamone, Damiani, Fissore, Robl and Duby2001; Warzych et al., Reference Warzych, Pawlak, Pszczola, Cieslak and Lechniak2017).
In this study, we intended to characterize the LH secretion profile of Gir heifers after hormonal puberty induction during the peripubertal stage, and its association with follicular growth, ovulatory capacity, and oocyte quality. We present data showing that LH secretion can be associated with ovulatory capacity, and no effect could be detected on oocyte quality on this basis.
Materials and methods
All procedures were approved by the Embrapa Dairy Cattle Ethics Committee (Protocol 24.2015). Reagents were purchased from Sigma Chemical Co. (St. Louis, USA) unless otherwise stated.
Experimental design
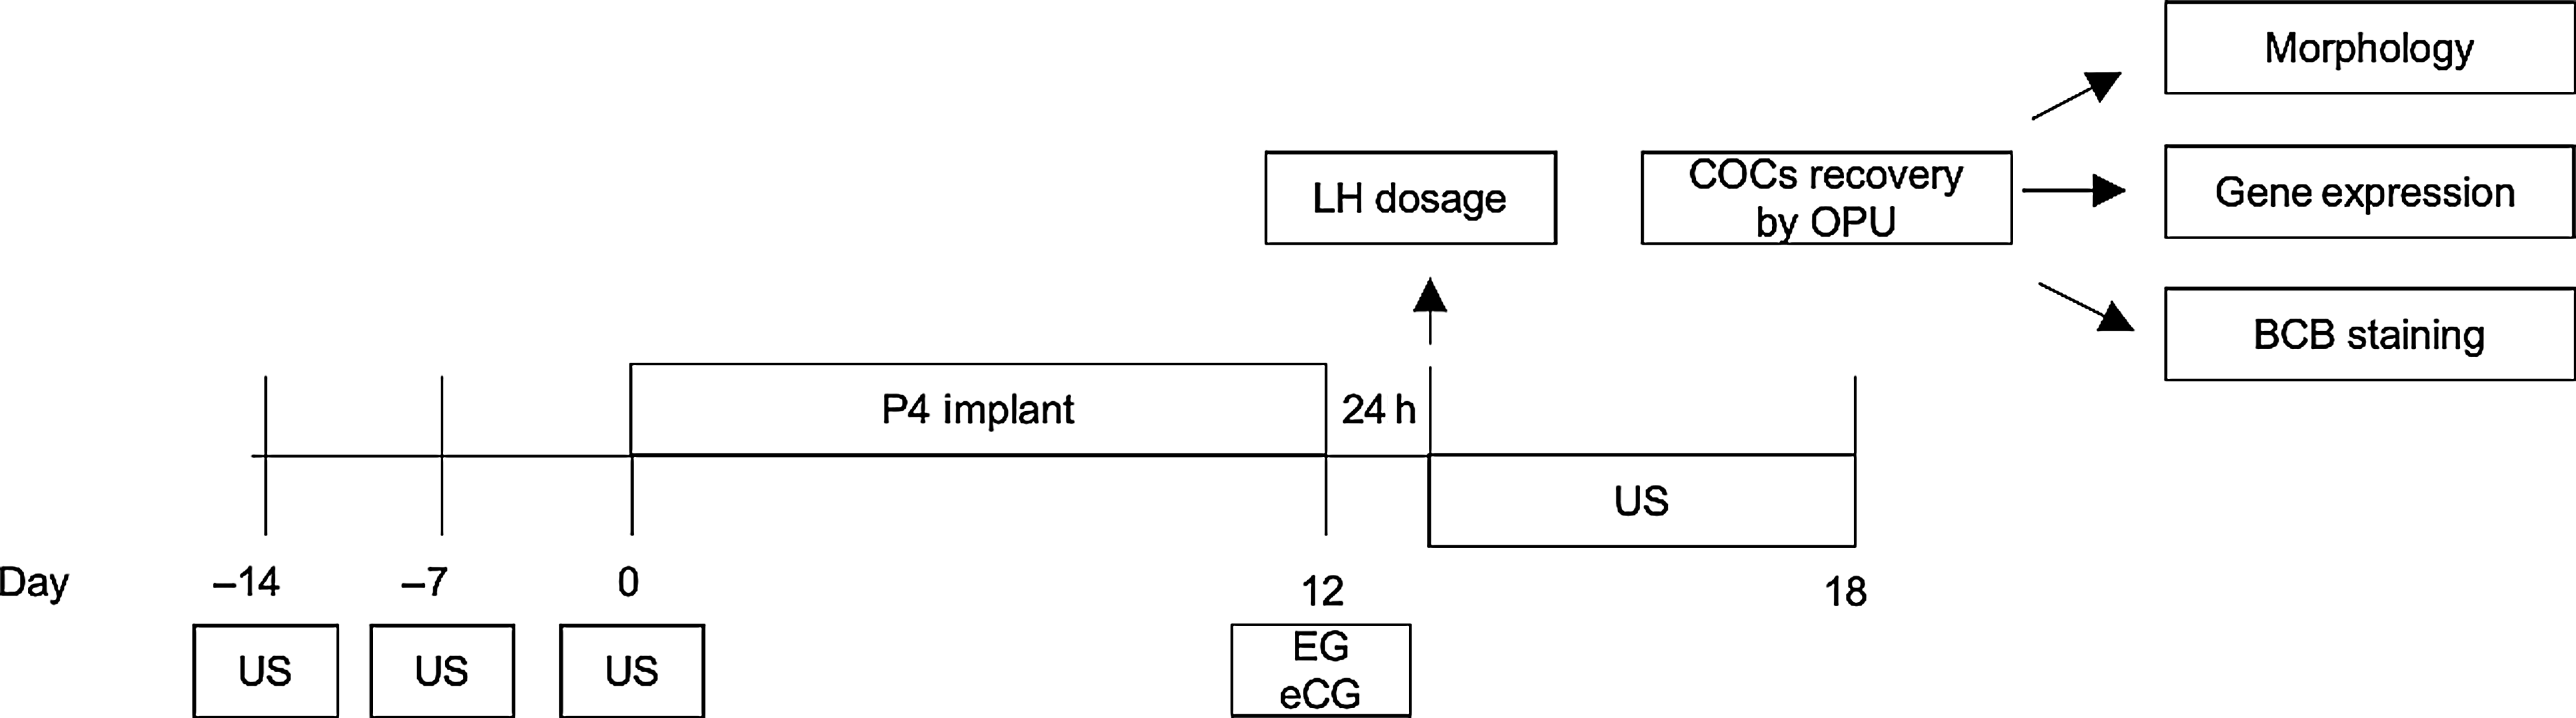
Experimental procedures are summarized in Figure 1. Prepubertal Gir heifers (n = 11, 242.4 ± 17 kg body weight and 18.4 ± 1.3 months old) were treated with a progesterone-based protocol to induce ovulation. Heifers were divided into two groups based on the ovulatory response, according to corpus luteum formation: ovulated (OV) and not-ovulated (N-OV). The largest follicle diameter and LH hormonal profile were evaluated before the ovulatory window. Oocytes from both groups were analyzed for quality [morphology, size, brilliant cresyl blue (BCB) staining and gene expression] after hormonal protocol. For quality assessments, oocytes from IVF donors (non-lactating Gir cows; n = 32 oocytes) were included as an oocyte quality control.
Schematic diagram of the experimental procedures. Days −14, −7 and 0, ultrasound evaluations were performed to confirm the absence of CL. Between days 0 and 12, the heifers received a progesterone vaginal implant (1 g). The animals received doses intramuscularly (i.m.) of 0.5 mg of EC and 200 UI of eCG. After 24 h of EC and eCG injections, the blood samples were collected. Between days 12 and 18, daily ultrasound examinations were performed to identify ovulation and perform dominant follicle measurements. On day 18, oocytes were collected by ovum pick-up for quality evaluations.

Hormonal treatment for ovulation induction
Non-pubertal heifers were treated with an intravaginal progesterone implant (1 g; Sincrogest, Ouro Fino Animal Health) for 12 days (D0–D12). At day 12, oestrogen (0.5 mg i.m. estradiol cypionate (EC); Zoetis) and equine chorionic gonadotropin (eCG, 200 IU i.m., Folligon, Intervet/Schering-Plough) were used to induce ovulation.
Ultrasound evaluations
Heifers were evaluated by ultrasonography (Mindray DP2200) at 14, 7 and 0 days before the beginning of hormonal treatment to confirm the prepubertal status (absence of a corpus luteum). Ultrasonographic ovarian examinations were performed daily from day 12 to day 18. The follicular diameter was calculated as the mean of the largest diameter and the diameter perpendicular to it, measured using ultrasound equipment. The last measurement before ovulation was considered for the OV group. For the N-OV group, the largest measurement in the protocol ovulation window (day 12 to day 15) was considered. Corpus luteum presence or absence was assessed in every evaluation.
Luteinizing hormone profile assessment
At 24 h after EC/eCG injection, serial blood samples were obtained from the jugular vein every 15 min for 6 h. Blood samples were collected in a vacuum tube containing heparin and placed immediately on ice. The tubes were centrifuged at 3000 g for 30 min, and plasma was separated and stored at −20°C until analysis. Luteinizing hormone profile assay was performed in duplicate by radioimmunoassay as previously described (Bolt and Rollins, Reference Bolt and Rollins1983; Bolt et al., Reference Bolt, Scott and Kiracofe1990). The intra-assay and inter-assay coefficients of variation for radioimmunoassay were 10.3% and 17.7%, respectively. The basal secretion, frequency of pulses, the amplitude of pulses, the concentration of the pulse and mean of the pulse height were analyzed using deconvolution and the Pulse algorithm (Software Pulse XP, version 20090124, University of Virginia, VA, USA).
Ovum pick-up (OPU)
OPU was performed on day 18 as previously described (Oliveira et al., Reference Oliveira, de Barros, Monteiro, Rosa, Leal, Serapião and Camargo2019). Before the procedure, heifers received an epidural injection of 2% lidocaine hydrochloride. Follicles of 2–8 mm were aspirated with an 18G needle coupled to a 7.5 MHz convex ultrasound transducer through a vacuum system (90 mmHg).
Oocyte quality assessment – morphology, BCB and size
COCs with a compact multilayer of cumulus cells and homogeneous cytoplasm or slightly coarse in appearance were considered IVF grade. BCB staining was performed as previously described (Manjunatha et al., Reference Manjunatha, Gupta, Devaraj, Ravindra and Nandi2007) with minor adaptations. COCs were incubated in 26 μM BCB in HEPES-buffered in vitro maturation (IVM) medium for 60 min at 38.5°C. COCs images were captured under an inverted microscope and analyzed for negative or positive BCB staining. The zona pellucida was considered for oocyte diameter measurement. Analysis was performed using ImageJ software and BCB staining images. Categorization among oocyte sizes was performed (Fair et al., Reference Fair, Hyttel and Greve1995) with one modification. As our measurements included the ZP, we increased by 20 µM the sizes for oocyte categorization, as follows: I. <120 microns, II. 120–130 microns, III. 130–140 microns, and IV. >140 microns.
Gene expression assay
IVF-grade oocytes from each animal were pooled (n = 10) and denuded using 200 µl TrypLE Express enzyme. Oocytes were collected without cells and snap frozen. Total RNA was isolated using the RNeasy Micro kit (Qiagen, Venlo, The Netherlands) following the manufacturer’s recommendations. cDNA was eluted with 14 µl water. For complementary DNA synthesis, a 10-μl RNA suspension was used in the ImProm-II Reverse Transcription System (Promega- Madison, USA) according to the manufacturer’s recommendations. A final volume of 20 μl was generated and 4 μl was used per polymerase chain reaction (PCR).
qPCR was performed using the ABI Prism 7300 system (Applied Biosystems. Foster City, USA) in duplicate in a 20-μl volume containing 6 pmol primers. Results were analyzed using the standard curve method as described by the manufacturer with expression of target genes in relation to endogenous references (GAPDH and β-ACTIN). A standard curve of each gene was prepared by purifying the qPCR reactions on agarose gel using the QIAquick PCR Purification Kit (Qiagen). Dilutions ranged from 1 to 1:10,000, totalling five points.
The primers used for the experiment were MATER F: CAGCCTCCAGGAGTTCTTTG and R: GACAGCCTAGGAGGGTTTCC (212-bp fragment), ZAR1 F: CACTGCAAGGACTGCAATATC and R: CAGGTGATATCCTCCACTC (137-bp), IGF2R F: CTACGACCTGACCGAGTG and R: TGACAGCCTCCCAGTTG (95-bp). GAPDH F: AAGGCCATCACCATCTTCCA, R: CCACTACATACTCAGCACCAGCAT (Oliveira et al., Reference Oliveira, Saraiva, Cruz, Mazeti, Oliveira, Lopes and Garcia2013) and β-ACTIN F: AAGGCCAACCGTGAGAAGAT, R: CCAGAGGCATACAGGGACAG. Relative expression is presented considering the average expression of GAPDH and β-ACTIN genes. PCR efficiency was estimated using linear regression of the log of fluorescence at each cycle, using a method and software (LinRegPCR) published previously (Ramakers et al., Reference Ramakers, Ruijter, Deprez and Moorman2003) and applying default parameters (number of points between 4 and 6 and best correlation coefficient). For each pair of primers, the fluorescence threshold line was fixed at the average of the lower and higher fluorescence values used by the software to estimate PCR efficiency.
Statistics
Mean largest follicle diameter, ZAR1 and IGF2R gene expression and LH data regarding concentration at each timepoint, basal secretion, frequency of pulses, amplitude of pulses, concentration of the secretion pulse and mean of the pulse height were compared between groups using Student’s t-test. The association between LH parameters and follicular diameter was verified by linear regression. Oocyte diameter and the number of recovered oocytes among groups were adjusted using Johnson transformation and compared by analysis of variance (ANOVA) and Tukey’s post-test. Graphs show non-transformed data. MATER gene expression was analyzed using the Mann–Whitney test. IVF-grade oocytes rate and BCB+ rate were analyzed by binary logistic regression. Categorization according to oocyte size was compared using the chi-squared (χ2) test. All analyses were performed at a 5% significance level using GraphPad Prism software.
Results
Ovulation following hormonal treatment for ovulation induction
After treatment with the progesterone-based protocol, a corpus luteum was detected in 45% of the animals (N-OV = 6 and OV = 5). Animals ovulated up to 72 h after ECG and EC injection (OV group).
Dominant follicle diameter
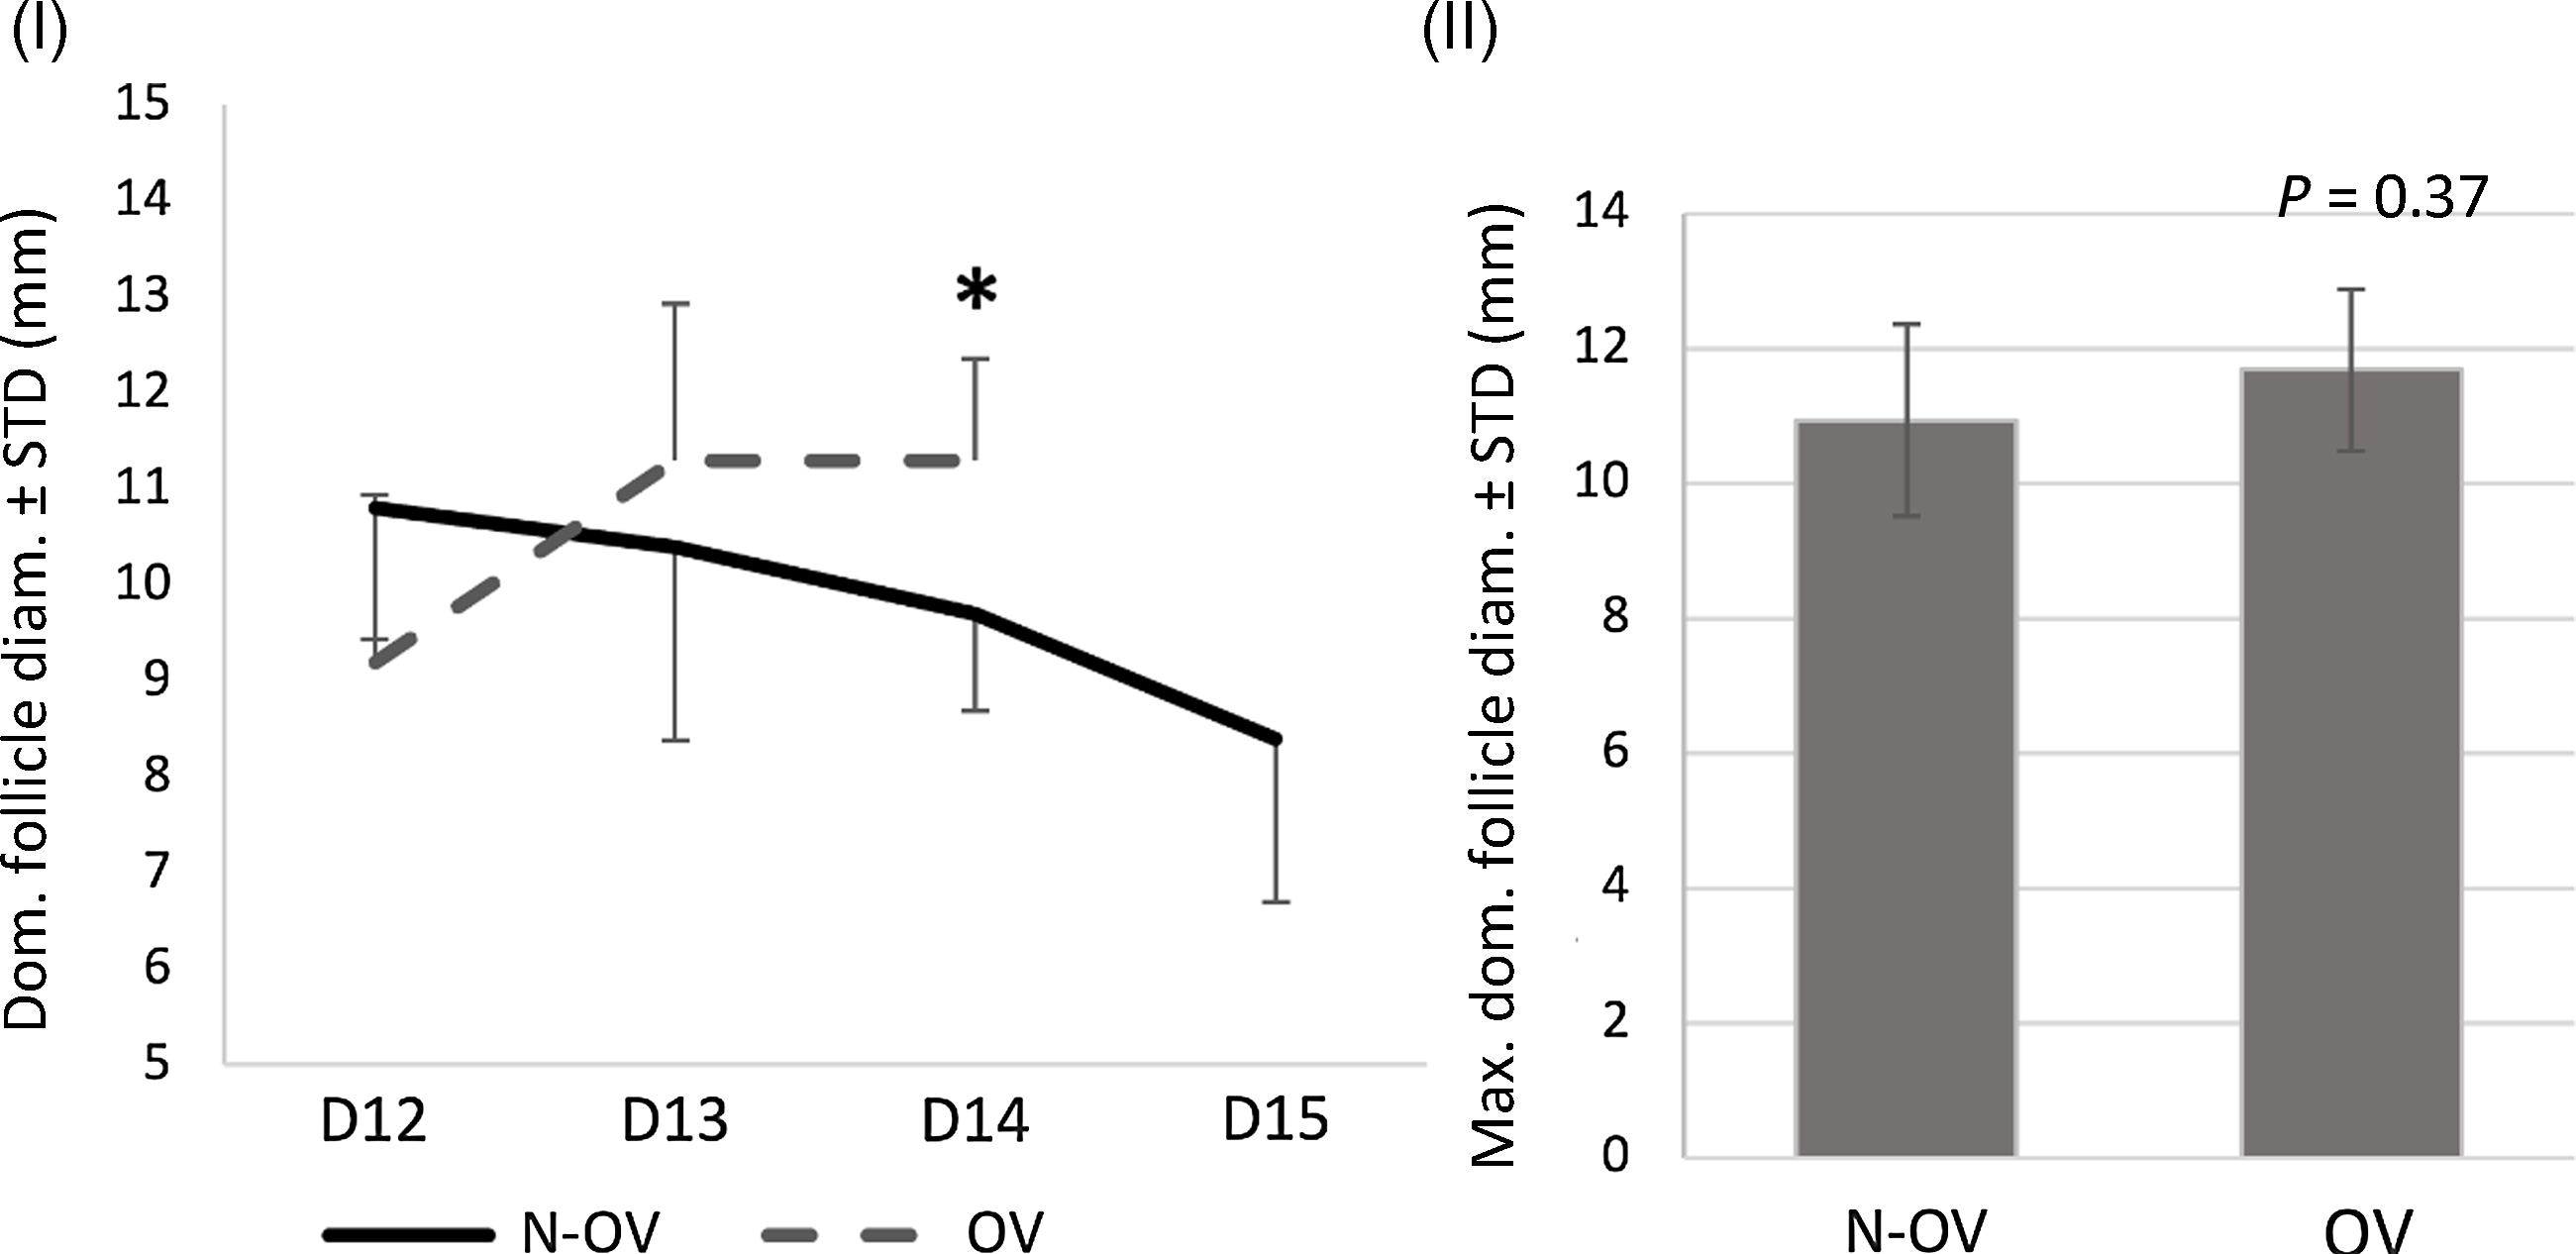
All animals were evaluated daily from day 12 to day 18 and the mean dominant follicle size is shown in Figure 2.I. The follicular diameter was similar between the N-OV and OV groups at the moment of EC injection (day 12) and after 24 h (day 13). However, on the next day (day 14) a decrease (P = 0.04) in dominant follicle diameter was noticed in the N-OV group. The largest follicular diameter within the ovulation window (day 12 to day 15) was similar between groups (Figure 2.II).
Dominant follicle growth in the N-OV and OV groups. I. Ultrasound measurements of dominant follicle are shown from day 12 to day 15. Day 15 was not included in statistical analysis as most OV heifers had already ovulated. Asterisk indicates statistical difference between groups for specified evaluation day. II. Graph shows the largest dominant follicle size mean for each group between day 12 and day 15 (ovulation window).

LH secretion profile
Mean plasmatic concentrations of LH during the experiment window (6 h), totalling 25 samples per animal, was 0.78 ± 0.02 ng/ ml in OV heifers and 0.97 ± 0.02 ng/ ml in N-OV heifers (P < 0.01). In Figure 3, raw data are presented for OV and N-OV groups, the LH levels were lower (P < 0.01) for OV heifers at five sampling times.
Plasma LH levels in N-OV and OV groups 24–30 h after EC/eCG treatment. Graph shows the mean LH concentration at each time point. A 15-min interval between sampling was adopted, totalling 25 samples in the 6-h window. Ovulation occurred in the OV group 48–72 h after EC/eCG treatment. Asterisks denote statistical difference between groups at the indicated timepoints.

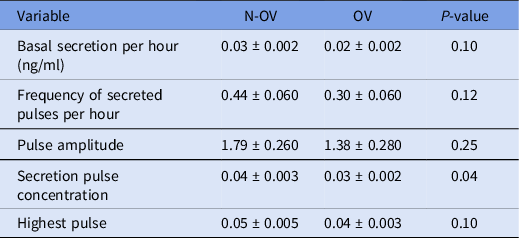
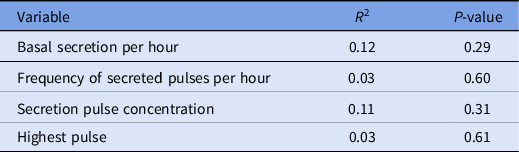
Pulse LH analysis is presented in Table 1. Basal LH secretion per hour, frequency of the secretion pulses per hour and pulse amplitude remained unaltered (P > 0.05) between groups. However, when LH concentration within the secretion pulse was analyzed, higher (P = 0.04) values were detected in heifers that did not ovulate (N-OV) compared with ovulated (OV) heifers. The mean value of the highest pulse did not differ between groups. The association between the LH-evaluated parameters and dominant follicle size by regression analysis revealed no significant effect of follicular growth on LH variables (Table 2).
LH secretion profile after deconvolution analysis by Pulse software. Samples were collected every 15 min for 6 h. Results are presented as mean ± standard error of the mean (SEM)

Linear regression analysis between follicular size and LH parameters

Oocyte quality assessment: IVF-grade oocyte rate, BCB+ and size
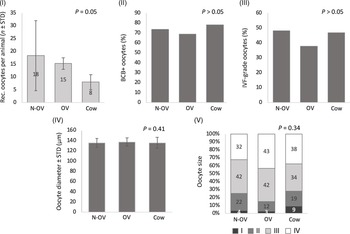
Oocytes collected from animals in the N-OV (n = 110), OV (n = 61) and cow (n = 32) groups were evaluated morphologically, measured, and stained with BCB. As shown in Figure 4, the mean recovered oocytes comparison among groups revealed a low P-value (P = 0.05). Tukey post-test comparison revealed similar numbers of recovered oocytes for N-OV and OV groups (P = 0.99) but a tendency to an increased pattern from N-OV and OV groups compared with cows (P = 0.06 and 0.09, respectively; Figure 4.I). Incidence of BCB+ (N-OV: 74%, OV: 69%, cow: 78%) and IVF grade (N-OV: 48%, N-OV: 38%, cow: 47%) oocytes were similar between groups (Figure 4.II,III). Mean oocyte diameter was also similar in all groups (Figure 4.IV). Categorization of oocyte size according to their developmental competence potential revealed similar patterns among the N-OV, OV and cow groups (Figure 4.V). Category IV (fully grown oocytes) corresponded to 32% N-OV oocytes, 43% OV oocytes and 38% cow oocytes.
Oocyte recovery and morphological quality. Oocytes from donor cows were included as a quality control group for all analysis. I. Graph shows mean number of oocytes recovered per animal in each group. II. Graph shows the percentage of BCB-stained oocytes in each group. III. Graph shows IVF-grade oocytes rate in each group. IV. Mean oocyte diameter (including zona pellucida) is shown. V. Percentage of each oocyte size category is shown. Categorization described by Fair et al. (Reference Fair, Hyttel and Greve1995) was used with modification to consider ZP measurement, as follows: I. <120 microns, II. 120–130 microns, III. 130–140 microns, and IV. >140 microns.

Gene expression of oocyte competence markers
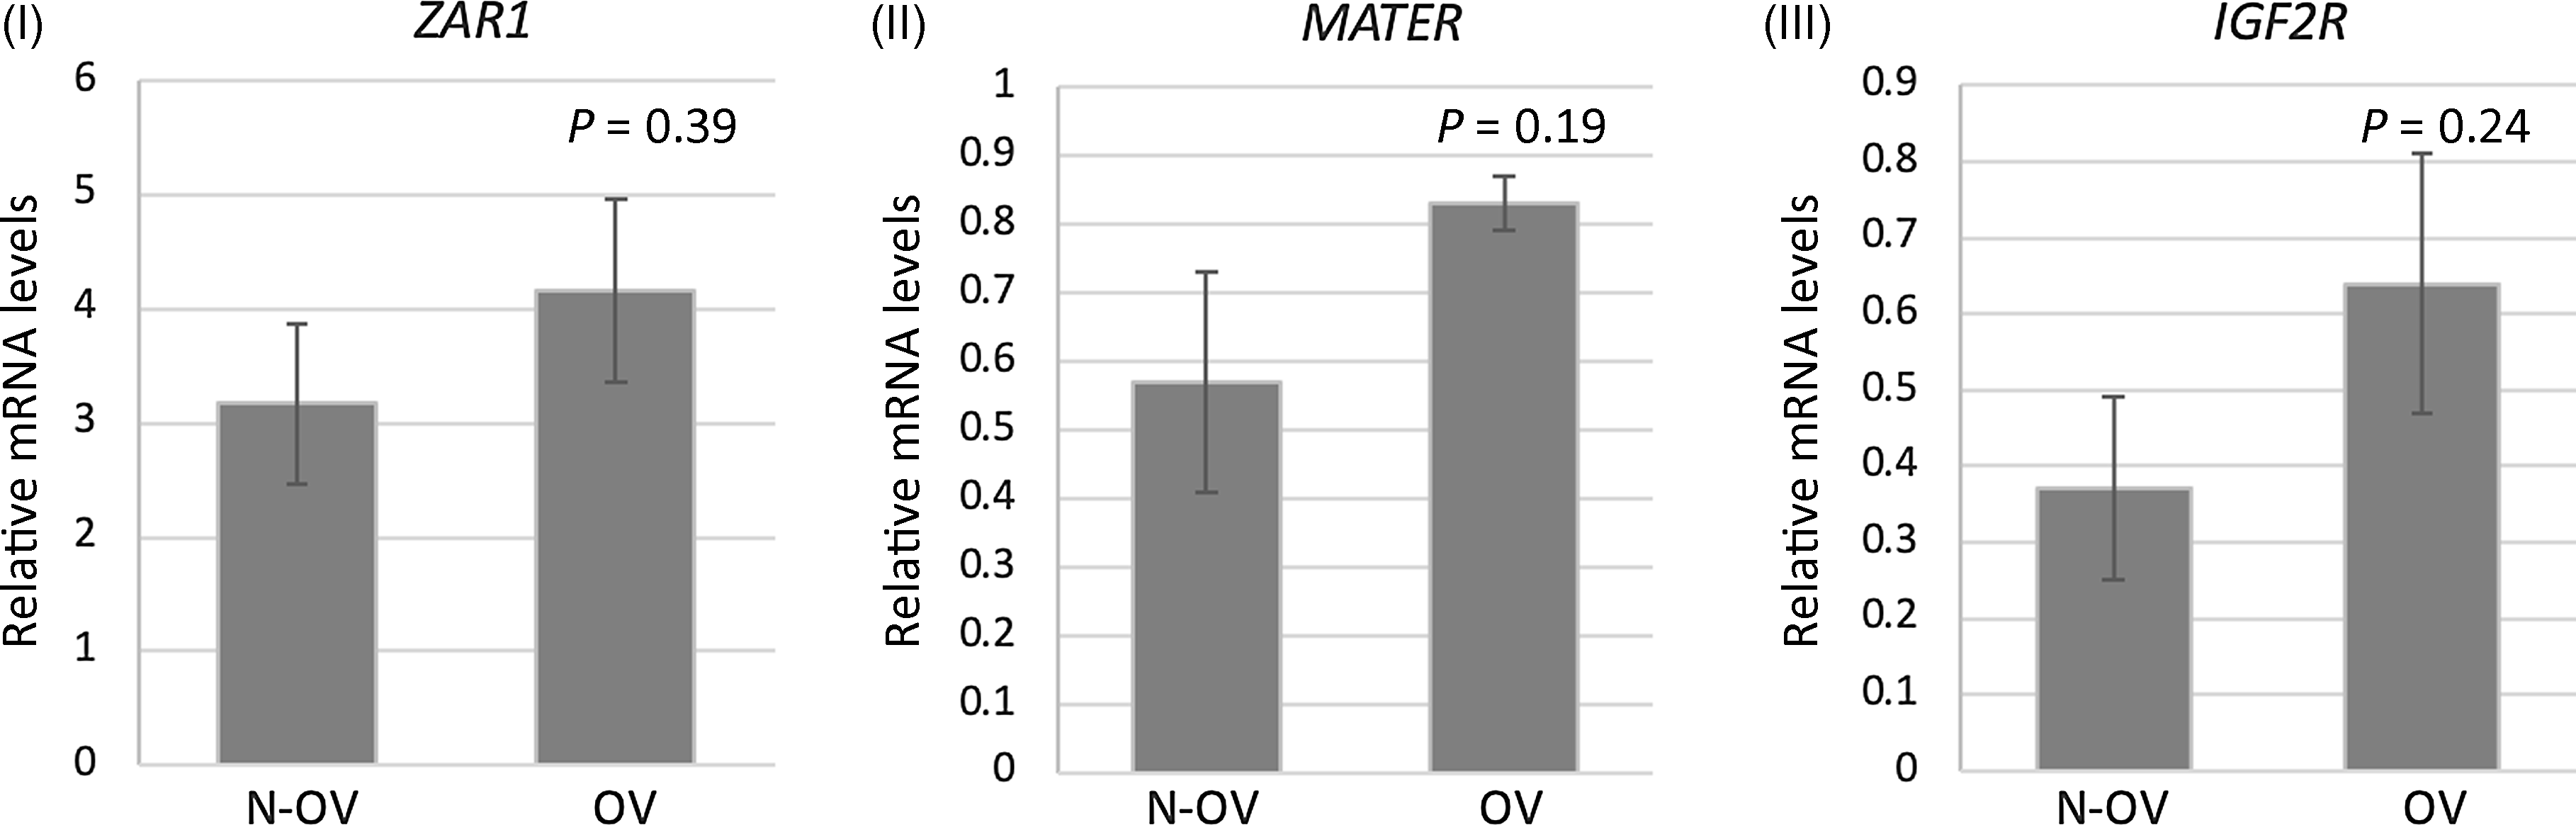
Denuded oocytes from both groups were used for gene expression analysis, and the results are shown in Figure 5. ZAR1, MATER and IGF2R transcript levels were similar between non-ovulated (N-OV) and ovulated (OV) animals. A PCR efficiency between 1.89 and 1.92 was found for all gene expression assays.
Expression of oocyte developmental competence biomarkers in N-OV and OV groups. I–III. Oocyte mRNA levels for ZAR1 (I), MATER (II) and IGR2R (III) are shown, relative to housekeeping GAPDH and β-ACTIN levels.

Discussion
In this study, we aimed to assess the influence of the LH secretion profile in the ovulatory response following a progesterone-based hormonal treatment in peripubertal Gir heifers, and to associate this profile with follicular growth and oocyte quality. Our main findings included the detection of lower LH secretion levels just before the LH surge window in heifers prone to ovulate, and a lack of effect of ovulatory response on follicular growth and oocyte quality.
Heifers selected for this study were of age, weight, ovarian follicular and luteal profiles compatible with the peripubertal stage. This period starts ∼40–60 days before the first ovulation, following the prepubertal period, and is marked by the beginning of the decline of the sensitivity to estradiol negative feedback on the central nervous system (CNS) centres that control GnRH release (Day and Anderson, Reference Day and Anderson1998). In the pre/peripubertal heifer, the GnRH tonic secretion pattern induces and closely resembles the LH secretion pattern (Cardoso et al., Reference Cardoso, Alves, Sharpton, Williams and Amstalden2015). During the transition from prepuberty to the peripuberty, the tonic LH secretion pattern undergoes alterations characterized by decreased pulse amplitude and increased pulse frequency; and the sustained increase of GnRH/LH pulse frequency is the limiting factor for the occurrence of puberty (Kinder et al., Reference Kinder, Day and Kittok1987). The changes in the GnRH/LH tonic secretion patterns result in increased growth and size attained by dominant ovarian follicles, as well as increased estradiol synthesis. As a result, estradiol concentrations attain levels sufficient to induce the pubertal GnRH/LH preovulatory surges. It has been proposed that the ability of a heifer to respond to a puberty induction treatment is related to their reproductive maturity, or to the timely proximity to the spontaneous ovulation (Day and Nogueira, Reference Day and Nogueira2013). In this study, neither frequency or amplitude of LH pulses, nor dominant follicle size following the withdrawal of hormonal protocol differed among heifers that ovulated or did not ovulate, indicating that LH pulsatile profile and follicular size immediately after the hormonal protocol were not predictive factors for the success of this hormone-based puberty induction protocol.
Here the overall plasma LH concentrations and LH concentration within pulses were lower in heifers that ovulated. These data corroborated previous findings on peripubertal heifers in which circulating LH was shown to decrease and fluctuate within a smaller range, especially in the 6 days prior to the pubertal LH surge (Gonzalez-Padilla et al., Reference Gonzalez-Padilla, Wiltbank and Niswender1975). Because ovulation requires the massive release of LH in a surge pattern, it seems that a decrease in LH levels just before the LH surge window could be a mechanism to store LH in the anterior pituitary to be released in a surge pattern later. Progesterone has an inhibitory, estradiol-dependent, effect on pituitary LH synthesis and release (Girmus and Wise, Reference Girmus and Wise1992; Nett et al., Reference Nett, Turzillo, Baratta and Rispoli2002). Therefore, in Nellore (Bos taurus indicus) heifers, an inverse relationship between circulating progesterone concentrations and total area of LH secretion (with no effect on frequency or amplitude) has been demonstrated (Cipriano et al., Reference Cipriano, Carvalho, Marangoni and Nogueira2011). The role of progesterone (or other progestogens) in puberty-inducing protocols appears to rely on its effect in reducing estradiol receptors within CNS areas that control GnRH release, which would decrease sensitivity to estradiol negative feedback (Day and Anderson, Reference Day and Anderson1998). In the present study, heifers were of similar weight, had no corpus luteum (CL) and were inserted with the intravaginal progesterone device containing the same dose, therefore, although not assessed here, circulating progesterone concentrations might not be the cause of the variation of LH concentrations among groups. Sensitivity to progesterone or previous estradiol-priming within CNS centres that control GnRH/LH release might participate in the mechanisms that influence ovulation success in non-pubertal Gir heifers, but this hypothesis warrants further investigation.
The hormonal protocol used in this study included EC and ECG on the day of implant withdrawal. Estradiol induces preovulatory GnRH surges (Christian and Moenter, Reference Christian and Moenter2010), and has a direct stimulatory action for LH release by the pituitary (Kesner et al., Reference Kesner, Convey and Anderson1981). In taurine-breed heifers, the ability of estradiol to induce an LH surge develops between 3 and 5 months of age, and the percentage of heifers that respond to estradiol increases as puberty approaches (Schillo et al., Reference Schillo, Dierschke and Hauser1983; Staigmiller et al., Reference Staigmiller, Short and Bellows1979). In 7-month-old Holstein heifers, estradiol administration induced an LH surge in 80% of heifers, and those that did not respond had higher circulating LH (Swanson and McCarthy, Reference Swanson and McCarthy1978). Therefore, in corroboration with these previous studies, our data indicated that the inability of some heifers to respond to the puberty induction protocol related to the immaturity of neuroendocrine centres involved with LH surgical release. The role of ECG (which has LH activity in the bovine) in oestrus synchronization protocols is to enhance final follicular maturation (De Rensis and López-Gatius, Reference De Rensis and López-Gatius2014) and improve the efficiency of the progestin-based fixed-time artificial insemination protocol (Sá Filho et al., Reference Sá Filho, Torres-Júnior, Penteado, Gimenes, Ferreira, Ayres, Castro e Paula, Sales and Baruselli2010).
Our study also aimed to compare oocyte quality in animals that ovulated or not following hormonal treatment, to understand ovulatory effects on a short-term basis. This is because puberty is associated with oocyte quality. Oocytes from prepubertal heifers are associated with lower blastocyst rates, and developed embryos present disturbances in nutrient uptake and an increased apoptosis rate (Steeves et al., Reference Steeves, Gardner, Zuelke, Squires and Fry1999; Zaraza et al., Reference Zaraza, Oropeza, Velazquez, Korsawe, Herrmann, Carnwath and Niemann2010; Diederich et al., Reference Diederich, Hansmann, Heinzmann, Barg-Kues, Herrmann, Aldag, Baulain, Reinhard, Kues, Weissgerber, Haaf and Niemann2012). Puberty onset increases growth hormone (GH) and insulin-like growth factor 1 (IGF1) levels, molecules that play important roles in embryonic development (Oropeza et al., Reference Oropeza, Wrenzycki, Herrmann, Hadeler and Niemann2004). However, as sexual maturation occurs and puberty onset approaches, Bos taurus indicus crossbred oocytes have a similar developmental potential as adult cows, suggesting that oocyte quality near puberty has already increased (Camargo et al., Reference Camargo, Viana, Sá, Ferreira and Vale Filho2005).
We selected three non-invasive and one invasive oocyte quality assays to compare groups and included adult cow oocytes as a control group. BCB analysis is an indicator of a fully developed oocyte population (Mota et al., Reference Mota, Batista, Serapião, Boité, Viana, Torres and De Almeida Camargo2010), and IVF grade (usually titled ‘viable’) oocyte rate is a routine morphological classification. The oocyte diameter category is related to RNA synthesis and storage, essential to drive early embryonic development in bovine, and reflects distinct developmental competence potential among categories (Fair et al., Reference Fair, Hyttel and Greve1995). Oocyte gene expression patterns reflect oocyte quality, and previously validated biomarkers were evaluated in this study. ZAR1 (Wu et al., Reference Wu, Viveiros, Eppig, Bai, Fitzpatrick and Matzuk2003) and MATER (Tong et al., Reference Tong, Gold, Pfeifer, Dorward, Lee, Bondy, Dean and Nelson2000) are maternal-effect genes critical for oocyte–embryo transition and early embryonic development, and IGF2R is a member of the IGF family, in which abundance was associated with oocyte competence in the bovine (Biase et al., Reference Biase, Everts, Oliveira, Santos-Biase, Fonseca Merighe, Smith, Martelli, Lewin and Meirelles2014).
Our results revealed a similar pattern for all groups in the four assays. Similar rates of IVF-grade, BCB+ and fully grown oocytes (>110 µm, categories III and IV; Fair et al., Reference Fair, Hyttel and Greve1995), together with a similar gene expression pattern for oocyte quality biomarkers, suggested that oocyte quality had already increased before puberty onset in Gir peripubertal heifers, and that short-term effects of ovulation on oocyte quality were not important, considering the evaluated parameters. It is also important to note that animals were exposed to progesterone over a prolonged period (12 days), and that could have affected prepubertal physiological conditions in non-expected ways, positively affecting oocyte quality. Overall, we detected an adequate oocyte quality index according to multiple parameters, indicating that hormonally treated peripubertal Gir heifers could be used as oocyte donors irrespective of their ovulatory response.
We conclude that (1) the lower plasmatic LH concentration and concentration in secretion pulses may reflect ovulatory response, and (2) the ability to ovulate after a progesterone-based protocol has no effect in the short term on oocyte quality in Gir prepubertal heifers.
Acknowledgements
The authors thank Professor Guilherme de Paula Nogueira (UNESP) for LH dosages.
Authors contribution
CSO and PMSR made substantial contributions to conception and design, acquisition of data, analysis, interpretation of data, and writing the manuscript. AJRC, CASM, GRL and PHEG participated in the acquisition of data. BRCA and NZS made substantial contributions to the conception and design, and analyzed and interpreted the data. All authors revised and approved the manuscript.
Funding
This study was supported by CAPES (scholarship, financial code 001); CNPq (grant number 408435/2016-0) and FAPERJ (BRCA fellowship).
Competing interest
There are no conflicts of interest to report.