INTRODUCTION
The Earth is undergoing a change in climate, including an increasing global air temperature, partly caused by human activities (Pachauri & Reisinger Reference Pachauri and Reisinger2007). Both positive and negative impacts of climate change on agriculture have been predicted, depending on geographical region and time scale (Olesen & Bindi Reference Olesen and Bindi2002; Tubiello et al. Reference Tubiello, Soussana and Howden2007; Lobell et al. Reference Lobell, Burke, Tebaldi, Mastrandrea, Falcon and Naylor2008). In general, negative effects on crop yield are expected to be more pronounced by the end of the 21st century than in the nearer future (Tubiello et al. Reference Tubiello, Soussana and Howden2007). Projected climate changes in Norway include increases in winter and summer temperatures (Hansen-Bauer et al. Reference Hansen-Bauer, Drange, Førland, Roald, Børsheim, Hisdal, Lawrence, Nesje, Sandven, Sorteberg, Sundby, Vasskog and Ådlandsvik2009). Future changes in the precipitation pattern in Norway are also expected, both with regard to the total amount of annual rainfall and the intra-annual distribution and intensity of single rainfall events (Haugen & Iversen Reference Haugen and Iversen2008).
Dairy and beef production in many temperate regions across the globe, including Norway, is dependent on high-quality forage as its main source of energy (Wilkins & Humphreys Reference Wilkins and Humphreys2003). To serve this purpose, forage grass production has been adapted to current climate conditions by extensive plant breeding and management efforts. Timothy (Phleum pratense L.), grown either in single stands or mixed with other grass and legume species, is one of the most commonly grown grass crops in cold temperate regions (Ashikaga et al. Reference Ashikaga, Tamaki, Tanaka, Deguchi, Iida and Sato2010), including all agricultural regions of Norway (Höglind et al. Reference Höglind, Hanslin and Van Oijen2005; Nordheim-Viken et al. Reference Nordheim-Viken, Volden and Jorgensen2009).
Typical timothy production systems in northern Europe include cultivation in single stands or mixtures with other grasses and/or legumes (Riesinger Reference Riesinger2010). In this region, there are often no more than three cuts per season (Jing et al. Reference Jing, Bélanger, Baron, Bonesmo, Virkajärvi and Young2012), which is lower than in many other regions where more frequent harvesting regimes or grazing dominate (Parsons Reference Parsons, Jones and Lazenby1988). Timing of cuts is a key factor for both the quality and quantity of the forage grass (Höglind et al. Reference Höglind, Hanslin and Van Oijen2005; Nordheim-Viken et al. Reference Nordheim-Viken, Volden and Jorgensen2009). The cutting of timothy normally occurs from the time when the grass species is in the early heading stage to when it has reached the full heading stage. Within this range, the biomass yield is normally higher if the grass is cut late than if it is cut early. However, the energy and nutritional value normally decreases from the early heading stage to later development stages. Naturally, the development stage at which the grass is cut also affects the maximum number of cuts per growing season and the total annual biomass yield. In addition to the development stage at harvest, the number of cuts per season depends on the length of the growing season, which is controlled in the first instance by temperature and then by day length. The latter factor becomes increasingly important at higher latitudes.
Periods of rain during harvest of perennial grasses can have a negative impact on the nutrient and energy content of the grass and on the fermentation capacity and nutritive quality of the silage, as well as increasing the possibility of contamination by bacteria that negatively interfere with the fermentation process (Orosz et al. Reference Orosz, Szűcsné-Péter, Owens and Bellus2008). In addition, harvesting during periods of wet weather and water-saturated soils may increase the risk of direct plant injury and of soil compaction (Batey Reference Batey2009), with negative long-term impacts on both grassland (Sveistrup & Haraldsen Reference Sveistrup and Haraldsen1997) and arable crop production (Hamza & Anderson Reference Hamza and Anderson2005). To avoid such negative effects and to achieve high, secure production, the harvesting regime for forage grass production systems in northern Europe has been adapted to the climate conditions that prevailed during the 20th century. Given the projected climate changes during the 21st century, the harvesting regime of forage grasses may need to undergo changes in order to achieve optimal production levels and harvest security in future. Harvest security is defined here as the possibility of harvesting without negative impacts on forage quality or soil structure. However, little is known about how climate change will affect the harvesting security of timothy production. In order to adapt forage grass production systems to projected future climate conditions, specific knowledge about the impact of climate change on different harvesting systems is required.
The growth, development and yield quality and quantity of grassland production as a response to weather, soil and crop management practices can be simulated with dynamic models (Riedo et al. Reference Riedo, Grub, Rosset and Fuhrer1998; Schapendonk et al. Reference Schapendonk, Stol, van Kraalingen and Bouman1998; Höglind et al. Reference Höglind, Schapendonk and Van Oijen2001; Bonesmo & Belanger Reference Bonesmo and Belanger2002; Hurtado-Uria et al. Reference Hurtado-Uria, Hennessy, Shalloo, Schulte, Delaby and O'Connor2012). The LINGRA model (Schapendonk et al. Reference Schapendonk, Stol, van Kraalingen and Bouman1998; Höglind et al. Reference Höglind, Schapendonk and Van Oijen2001) has been extensively applied to simulate growth of grasses, including perennial ryegrass (Rodriguez et al. Reference Rodriguez, Van Oijen and Schapendonk1999) and timothy (van Oijen et al. Reference van Oijen, Höglind, Hanslin and Caldwell2005) under conditions that represent the current northern and western European climate. Dynamic simulation models are also increasingly being used to study crop production under projected climate change conditions (Soussana et al. Reference Soussana, Graux and Tubiello2010; Iqbal et al. Reference Iqbal, Eitzinger, Formayer, Hassan and Heng2011; Vucetic Reference Vucetic2011; White et al. Reference White, Hoogenboom, Kimball and Wall2011). Höglind et al. (Reference Höglind, Thorsen and Semenov2012) simulated the yield response of timothy leys to climate change for a single harvesting regime with relatively short intervals (600 °C days) between harvests from a Northern European perspective. The yield response varied largely between locations and climate change projections, with an average yield increase across locations and climate change projections of 11% compared with the baseline scenario. However, little or no information is available about the extent to which the yield response to climate change is dependent on cutting frequency. Both frequent and less frequent cutting is common in Northern Europe, depending on, e.g. animal species, animal production intensity and the relative cost for producing feed on the own farm v. buying it from other producers.
The overall aim of the present study was to determine the impact of future climate change projections on the yield level of timothy and the security of harvest without negative impacts on forage quality and soil structure. Specific objectives included determination of the harvest security and biomass yield levels for two harvesting regimes with contrasting cutting frequencies at five locations with different climates in Norway.
MATERIALS AND METHODS
In the present study, timothy grass production was simulated as a function of daily weather, soil and crop management data under current climate conditions and scenarios that represent projected future climate conditions. The LINGRA timothy model, which has been described by Höglind et al. (Reference Höglind, Schapendonk and Van Oijen2001), was applied for these simulations. In the LINGRA model version applied in the present paper, a timothy phenology model from Bonesmo (Reference Bonesmo2000) was incorporated. Five locations in Norway were included in the simulations: Apelsvoll, Oppland County (60°42′N, 10°52′E, 264 m a.s.l.); Ås, Akershus County (59°40′N, 10°48′E, 89 m a.s.l.); Sola, Rogaland County (58°53′N, 5°38′E, 7 m a.s.l.); Tromsø, Troms County (69°41′N, 18°55′E, 100 m a.s.l.); and Værnes, Nord-Trøndelag County (63°27′N, 10°55′E, 12 m a.s.l.). These locations represent different geographical and agricultural regions and also a substantial variation in current growing conditions, as well as projected climate change. For each location, the timothy crop was simulated under baseline climate conditions, represented by the period 1961–90, and future climate conditions representing the periods 2046–65 and 2080–99.
Climate scenarios and weather and soil input data
Weather input data to the LINGRA simulations for the two future periods were based on the Special Report on Emission Scenarios (SRES) scenario A1B (Nakićenović et al. Reference Nakićenović, Alcamo, Davis, de Vries, Fenhann, Gaffin, Gregory, Grübler, Jung, Kram, Lebre La Rovere, Michaelis, Mori, Morita, Pepper, Pitcher, Price, Riahi, Roehrl, Rogner, Sankovski, Schlesinger, Shukla, Smith, Swart, van Rooijen, Victor and Dadi2000), which is included in the Intergovernmental Panel on Climate Change (IPCC) Fourth Assessment Report (Pachauri & Reisinger Reference Pachauri and Reisinger2007). The A1B scenario assumes rapid economic growth, technological advancements, interaction and convergence among regions and an energy sector relying both on fossil and non-fossil fuel sources, and results in intermediate levels of future greenhouse gas emissions compared with other SRES scenarios (Nakićenović et al. Reference Nakićenović, Alcamo, Davis, de Vries, Fenhann, Gaffin, Gregory, Grübler, Jung, Kram, Lebre La Rovere, Michaelis, Mori, Morita, Pepper, Pitcher, Price, Riahi, Roehrl, Rogner, Sankovski, Schlesinger, Shukla, Smith, Swart, van Rooijen, Victor and Dadi2000). To obtain data on daily weather conditions, including solar radiation, minimum and maximum air temperature, precipitation and potential evapotranspiration, the Long Ashton Research Station Weather Generator (LARS-WG) (Semenov Reference Semenov2008) was applied. With this tool, daily weather data representing future time periods can be generated based on 15 Global Climate Models (GCMs) (Semenov & Stratonovitch Reference Semenov and Stratonovitch2010), which are all included in the IPCC Fourth Assessment Report (Solomon et al. Reference Solomon, Quin, Manning, Marquis, Averyt, Tignor, LeRoy Miller and Chen2007). In the present paper, LARS-WG was first calibrated against historical weather data consisting of daily observations of temperature, precipitation, sunshine hours, wind speed and relative humidity for at least 30 consecutive years for each location, which were obtained from the EKlima website (http://eklima.met.no/) of the Norwegian Meteorological Institute. Subsequently, daily stochastic weather data for the two future periods 2046–65 and 2080–99 were generated using the calibrated LARS-WG. In total, 100 years of weather data for each location, period and GCM included in LARS-WG were generated. In addition, 100 years of weather data representing the normal (baseline) period, 1961–90, were generated for each of the five locations. Data representing the period 1961–90 in the 100-year data sets were used instead of observed weather data to obtain the same number of repetitions as for the two future periods. For each location, soil properties for Kise, Hedmark County (60°46′N; 10°48′E), which are described by Colleuille et al. (Reference Colleuille, Haugen and Øverlie2007) and which represent a moderately drought-sensitive sandy soil with a storage capacity of 100 mm plant-available water to 0·6 m depth, were used.
Simulated crop management
The management practices were the same in all simulations for all five locations and three periods studied. Cultivar-specific parameters were taken from a previous calibration of the LINGRA model for the timothy cultivar Grindstad under climate and soil conditions representing Norway (van Oijen et al. Reference van Oijen, Höglind, Hanslin and Caldwell2005). Grindstad is the dominant timothy cultivar in Norway and is also frequently grown in Finland and Sweden (Daugstad Reference Daugstad2011). Each simulation started in the spring and continued throughout the growing period as defined by Höglind et al. (Reference Höglind, Thorsen and Semenov2012). The winter period was not simulated in the present study, so possible effects of climate change on winter survival of the grass were not accounted for. In addition, no possible carry-over effects from the previous season were taken into account. Two contrasting harvest regimes, early and late harvest, were simulated. In the early harvest regime, the first cut was performed at the early heading stage (10 tillers per 10 m2, in which the top of the inflorescence was visible) as defined by Bonesmo (Reference Bonesmo2000), and the period between each of the subsequent cuts was set to 600 °C days above 0 °C. In the late harvesting regime, the first cut was set a few days later, between the early and full heading stages (50% of elongated tillers with heads fully emerged). In this harvesting regime, the period between each of the subsequent cuts was set to 800 °C days above 0 °C. No cut was allowed to take place later than 5 weeks before the end of the thermal growing period in order to allow proper cold acclimation (Höglind et al. Reference Höglind, Thorsen and Semenov2012). To estimate harvest security, two harvest security indices were defined based on the following principal requirements for successful harvesting and subsequent conservation of the grass: first, the grass was harvested within 1 week after it had reached the pre-planned development stage in order to keep forage quality at an acceptable level. Second, a sufficiently long period (2–3 days) without rain prior to harvesting was required to ensure that the harvested crop was dry enough for successful storage (Merry et al. Reference Merry, Jones, Theodoru and Hopkins2000). Third, the soil had to be dry enough to carry tractors and harvesting equipment without causing unnecessary compaction of the soil and damage to plants (Sveistrup & Haraldsen Reference Sveistrup and Haraldsen1997). Against this background, two indices were constructed to reflect harvest security. To reflect the need for a harvest window of 2–3 days within 1 week after the pre-planned harvest time, the highest number of consecutive days with no rain during a period of 1 week, i.e. the length of the longest dry spell within 1 week after the pre-planned harvest time, was calculated. To reflect the need for sufficiently dry soil to carry tractors and harvesting equipment, the accumulated precipitation during the same week was calculated. These indices were considered to give a good estimate of the practical feasibility of harvest, as a short dry spell indicated poor conditions for conserving the forage, and high precipitation indicated a high risk of soil compaction. However, it is clear that this was a rough estimate, as the risk of soil compaction is also influenced by, e.g. the infiltration, run-off and drainage conditions of the specific field. In addition, the total annual above-ground biomass production and the dry matter (DM) content of each cut were determined. Finally, biomass production in the period between the last cut and the end of the growing season was determined. The biomass produced during the latter period was considered suitable for animal grazing and is referred to below as grazing yield.
The harvest security and yield indices were calculated for each set of weather data generated from the 15 GCMs included in LARS-WG. Three of these GCMs, FGOALS, HADGEM and NCPCM, were excluded from further analyses. During certain time periods and locations, FGOALS generated weather conditions that were not within the range that could be handled by the LINGRA model. LARS-WG did not allow the use of HADGEM and NCPCM to generate weather data during the period 2080–99.
Statistical analysis
To assess the difference in the harvest security indices, including precipitation amount and the length of the dry spell in the 7 days prior to cutting, between the baseline period and the two future periods, analyses of variance (ANOVA) and least significant difference (LSD) analyses were conducted using PROC GLM in SAS (SAS Institute Inc 2008). Harvest security indices and DM yield related to each GCM and future period were tested individually against the baseline harvest indices and DM yields. Individual years were used as replicates. A Levene's test showed that the homoscedasticity criterion for the ANOVA analysis was not always met, i.e. the standard deviations within the periods, locations and harvesting regimes were statistically different. Therefore, the results from the ANOVA were compared with a Welch ANOVA. Differences in total annual DM yield and DM yields from the single cuts during the growing seasons between the baseline and the future periods were analysed using the same methods.
RESULTS
Temperature and precipitation
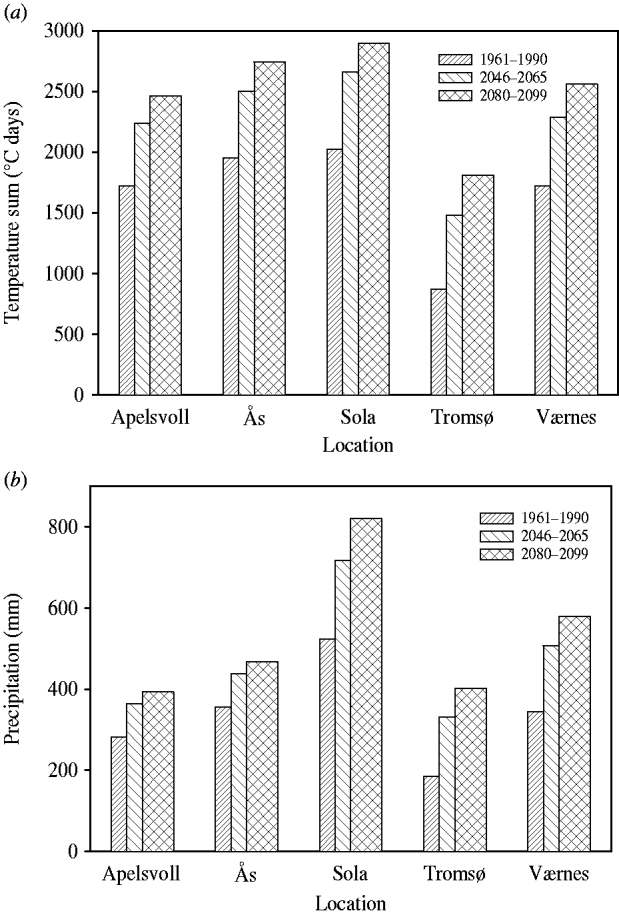
The temperature sum (above 0 °C) as averaged across all 12 GCMs during the growing period was higher in the two future periods than in the period 1961–90, at all locations. The highest temperature sum (2896 °C days) during the growth period was found at Sola in the period 2080–99 and the lowest (869 °C days) at Tromsø in the period 1961–90 (Fig. 1a). Also the accumulated precipitation during the growing period was higher for the two projected future periods as averaged across all GCMs than for 1961–90 climate conditions at all locations. The highest precipitation (820 mm) was accumulated at Sola (Fig. 1b) in the period 2080–99 and lowest (186 mm) at Tromsø in the period 1961–90 (Fig. 1b).
(a) Temperature sum (above 0 °C) during the growing period for five locations in Norway under the 1961–90 baseline scenario and two future periods based on projected climate change. (b) Accumulated precipitation during the growing period for five locations in Norway under the 1961–90 baseline scenario and two future periods based on projected climate change.

Harvest security
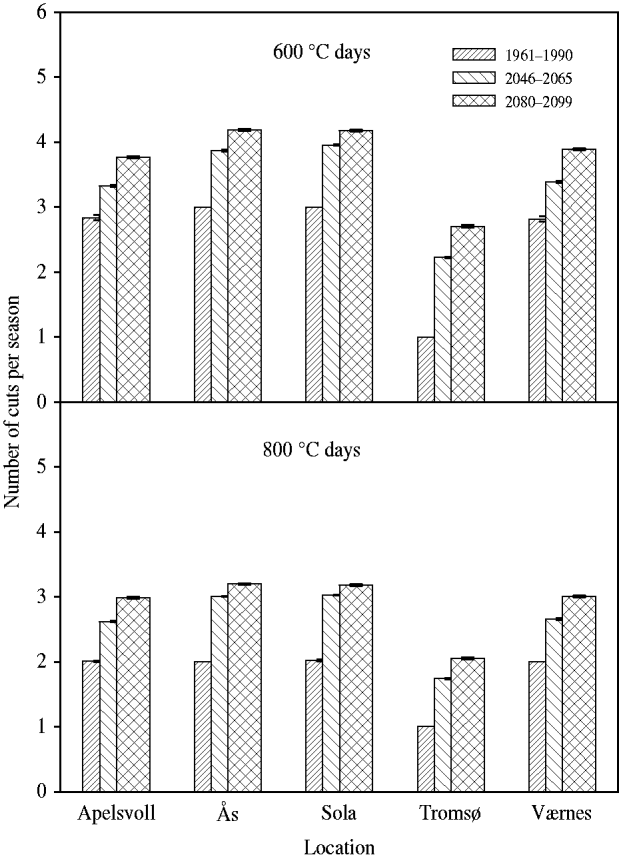
The average number of cuts per growing season was higher in the two future periods than in the period 1961–90 across all locations and both harvesting regimes. The highest number of cuts (4·18 on average for all GCMs) per season was simulated for the 600 °C days harvesting regime at Sola in 2080–99 and the lowest number (1·0 on average for all GCMs) for both harvesting regimes in the period 1961–90 at Tromsø (Fig. 2).
Average number of cuts per growing season (excluding grazing yield) for five locations in Norway in the (a) 600 °C days and (b) 800 °C days harvesting regimes.
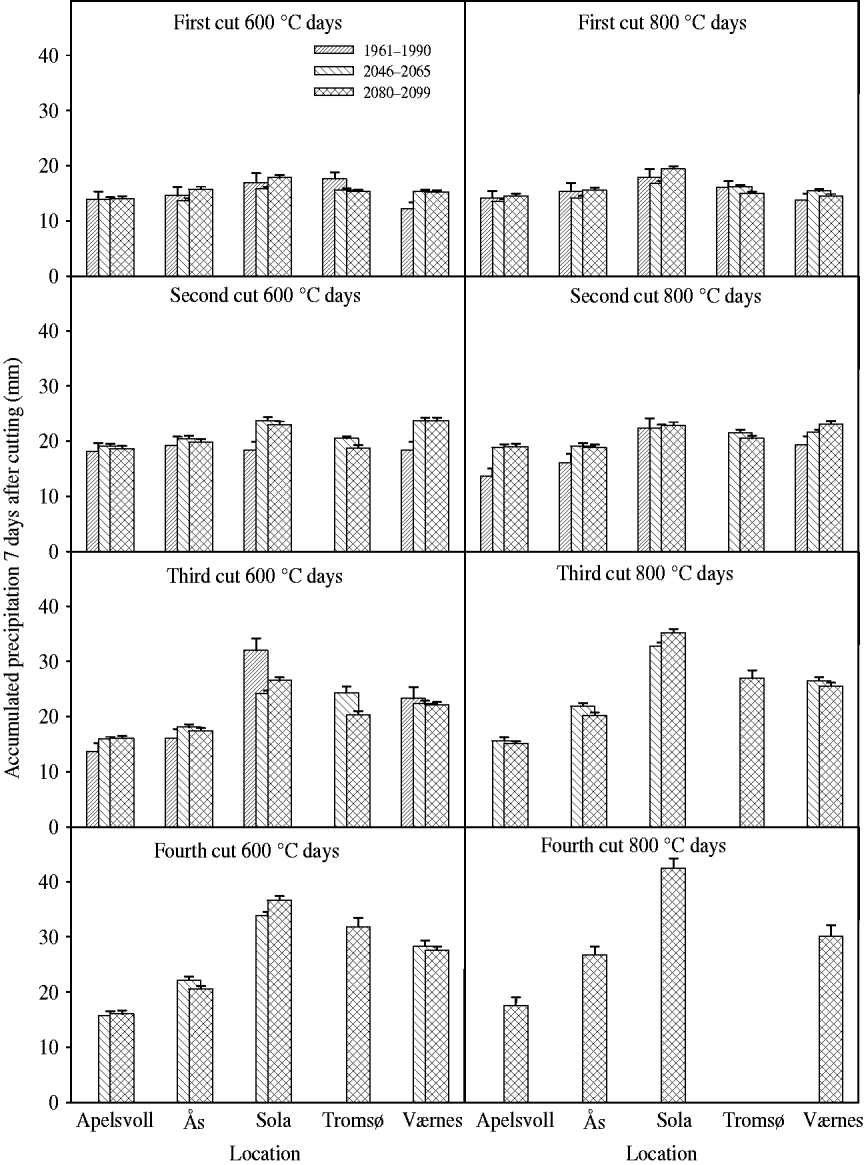
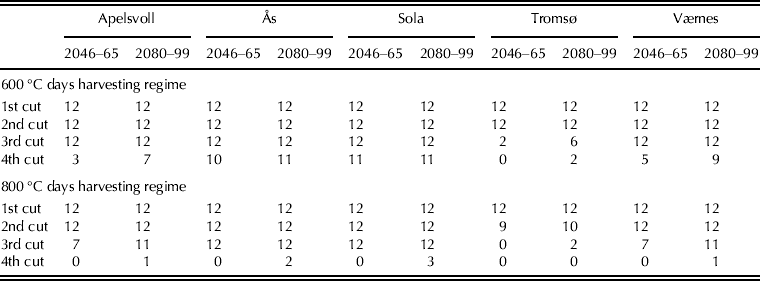
The total precipitation 7 days after harvest as averaged across all GCM generated weather data in which the cut number in question was simulated before the end of the growing season in a majority of the repetitions (Table 1) varied among locations, periods and harvesting regimes. The lowest precipitation (12·2 mm) was found after the first cut for the 600 °C days harvesting regime in the baseline period at Værnes, and the highest precipitation (42·5 mm) was found after the fourth cut in the 800 °C days harvesting regime in the period 2080–99 at Sola. There was a larger difference in precipitation among locations after later cuts than earlier for both harvesting regimes in all three periods. However, the differences between accumulated precipitation between the baseline period and the two future periods were small. There was significantly (P < 0·05) higher accumulated precipitation for the majority of the 12 sets of accumulated precipitation associated with each GCM after the second cut at Apelsvoll for the periods 2046–65 and period 2080–99 in the 800 °C days harvesting regime, and at Værnes for the period 2080–99 in the 600 °C days harvesting regime, than in the baseline period for the same locations and harvesting regimes. At Sola after the third cut, there was a significantly smaller accumulated precipitation in the majority of the GCM associated sets of accumulated precipitation for the period 2046–65 in the 600 °C days harvesting regime than in the baseline period for the same location and harvesting regime (Fig. 3).
Average precipitation (mm) 1 week after harvest for the three periods and two harvesting regimes studied.
Number of GCM-generated weather data sets, out of 12 data sets, which simulated cuts for the two harvesting regimes (600 and 800 °C days) at five locations in Norway in the periods 2046–65 and 2080–99
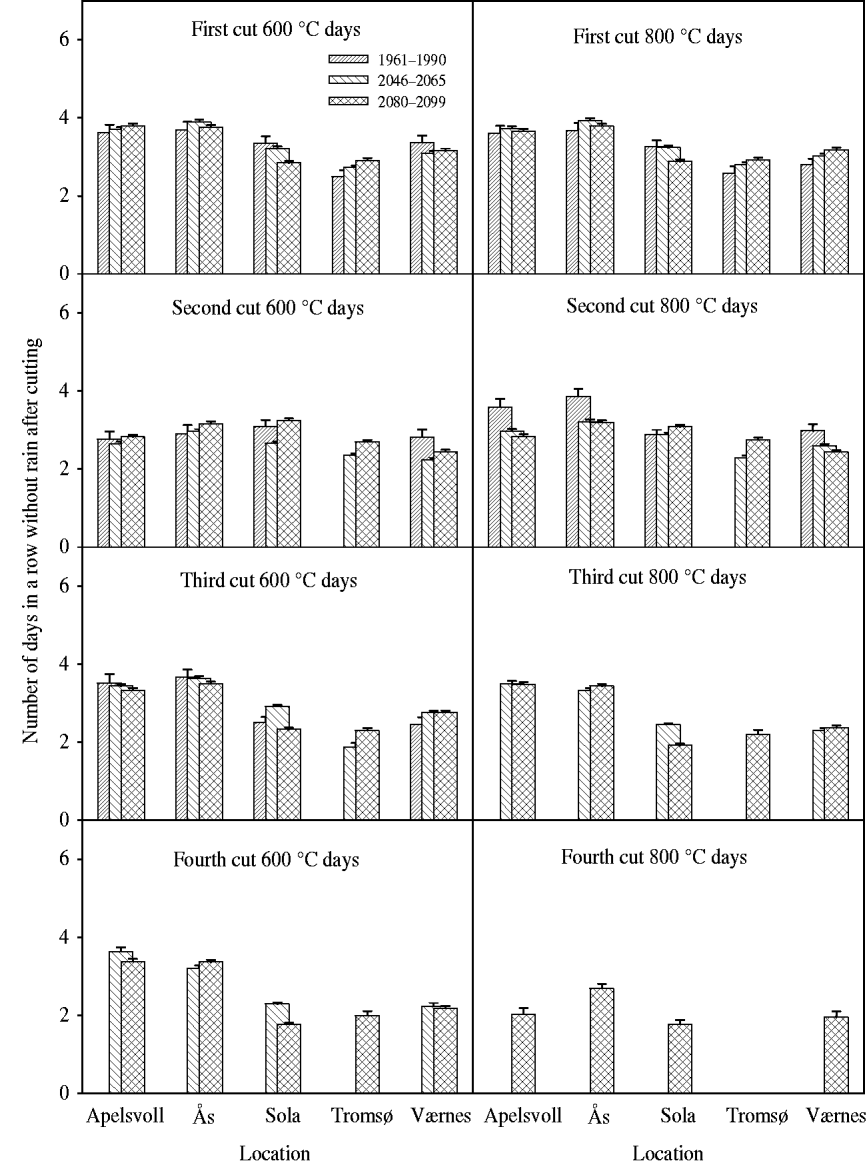
The longest dry spell period with no rain 7 days after harvest varied among the three time periods from 1·8 days after the fourth cut at Sola in the 600 °C days harvesting regime for the period 2080–99, and 3·9 days after the first cut at Ås in the 800 °C days harvesting regime for the period 2046–65 (Fig. 4). The variation in dry spell duration among locations tended to be higher after later cuts than after earlier cuts (Fig. 4). Compared to the period 1961–90 within harvesting regimes, a majority of the 12 sets of dry spells associated with each GCM was significantly (P < 0·05) shorter after the second cut in the 800 °C days harvesting regime at Apelsvoll and Ås in both the periods 2046–65 and 2080–99 and in Værnes in the period 2080–99 (Fig. 4).
Longest dry spell (number of days) after harvest without rain for the three periods and two harvesting regimes studied.
DM yield
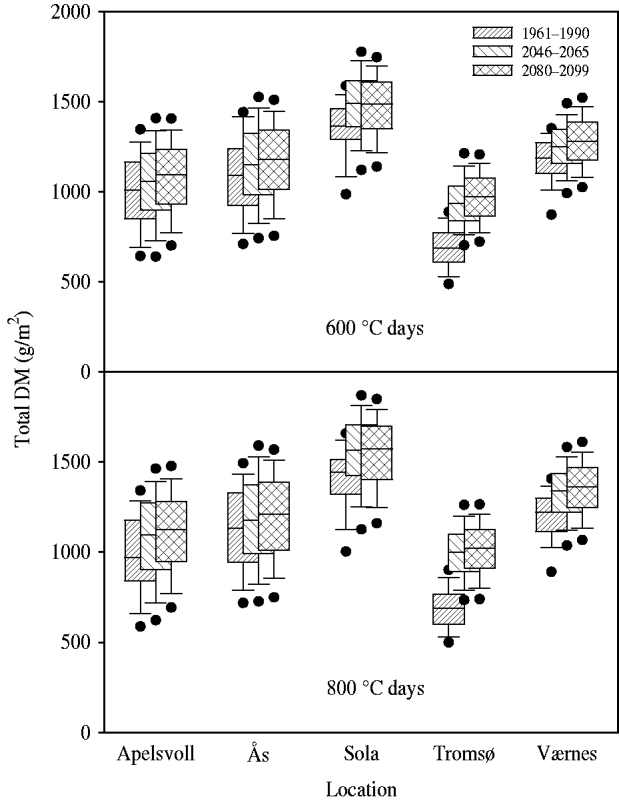
The total biomass yield, including the grazing yield, over one growing season was significantly (P < 0·05) higher in the two future periods than in 1961–90 in the majority of the 12 GCMs at all locations and in both harvesting regimes, except at Ås in the period 2046–65 for both harvesting regimes and Apelsvoll for the 600 °C days harvesting regime in the same period. Within all three periods, and averaged across all 12 GCMs, the highest seasonal biomass yield (1548 g DM/m2) was simulated at Sola in the period 2046–65 for the 800 °C days harvesting regime, and the lowest seasonal biomass yield (690 g DM/m2) was simulated at Tromsø in the baseline period for the 600 °C days harvesting regime (Fig. 5).
Total biomass yield, including grazing yield (g DM/m2), per growing season for five locations in Norway in the baseline climate and in projected climate change scenarios based on average GCMs. (Box limits represent 25 and 75 percentiles, whiskers represent 10 and 90 percentiles, and outliers represent 5 and 95 percentiles.)
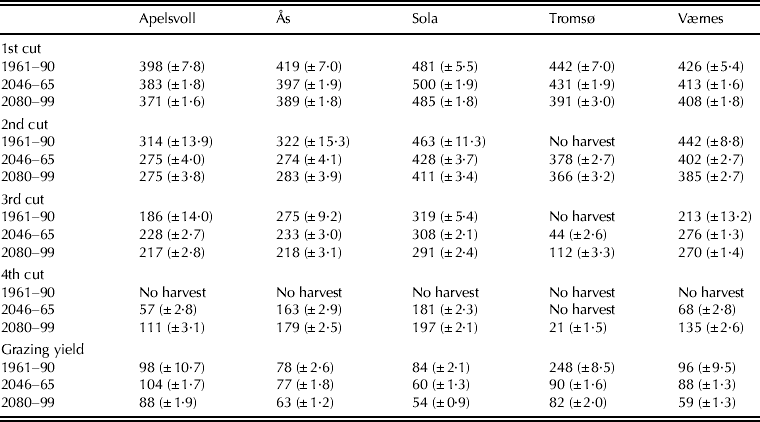
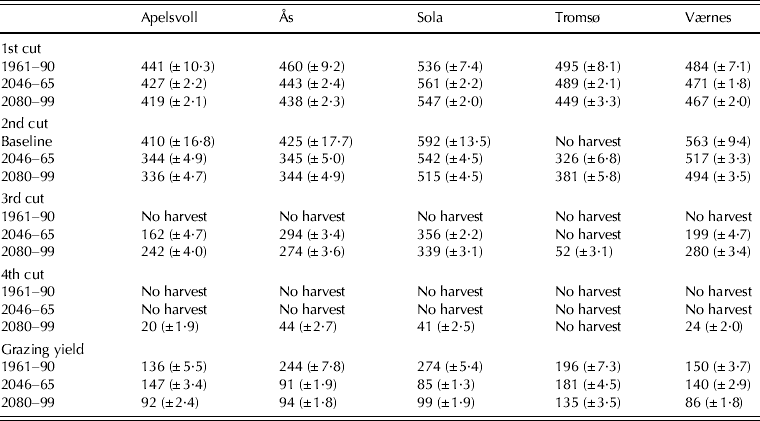
The higher seasonal yield in the two future periods than in 1961–90 was not consistent over all single cuts during the growing season. For the first and second cuts, biomass yields were higher in 1961–90 than in the two future periods at most locations and in both harvesting regimes. Therefore the higher overall seasonal yields in the future periods than in 1961–90 were the result of a higher number of cuts or higher yield levels in the third cut (Tables 2 and 3). Grazing yield was lower in the two future periods than in 1961–90 for both the 600 and 800 °C days harvesting regimes (Tables 2 and 3).
Average biomass yield (g DM/m2) across 12 GCMs (±s.e.m.) for the different cuts during the growing season, 600 °C days harvesting regime at five locations in Norway
DM = dry matter.
Average biomass yield (g DM/m2) across 12 GCMs (±s.e.m.) for the different cuts during the growing season, 800 °C days harvesting regime at five locations in Norway
DISCUSSION
The results presented above show a substantial impact of projected climate change on the production of a currently grown timothy cultivar at different locations in Norway. The clearest result was arguably the general trend for higher total annual biomass yield across the locations, mainly as a result of more cuts per season. The yield response did not differ consistently between harvesting systems, which is in line with results presented by Riedo et al. (Reference Riedo, Gyalistras and Fuhrer2000) concerning the effect of climate change on swards managed by cutting compared with grazing. The fact that there was no clear trend in dry spell duration and accumulated precipitation 7 days after harvest when comparisons were made within cut numbers renders it impossible to make any general statement on changes in harvest security in perennial grass ley production in Norway under future climate conditions from the present study. However, in south-western, central and northern regions of the country, the higher biomass yield and increased number of cuts per season under the climate change scenarios were associated with shorter dry spells and higher precipitation after late cuts than earlier cuts. These results indicate that the additional cuts may be more difficult to harvest and conserve than those performed earlier in the growing season.
There are both positive and negative effects of climate change on grass production reported from previous studies. Topp & Doyle (Reference Topp and Doyle1996) showed that the total biomass yield of perennial mixed grass/clover leys at different locations in Scotland was higher in future climate conditions than under baseline climate conditions, which was, however, solely an effect of increases in atmospheric CO2 levels. Holden & Brereton (Reference Holden and Brereton2002) reported increases in grass production in a few regions of Ireland and decreases in others, the latter as a result of increased drought during the summer period. For mountainous regions in central Europe, increased pasture production has been reported under future conditions with elevated temperatures, with these production increases being further elevated by increases in CO2 levels (Riedo et al. Reference Riedo, Gyalistras and Fuhrer2001). Izaurralde et al. (Reference Izaurralde, Thomson, Morgan, Fay, Polley and Hatfield2011) reported the negative impact of precipitation and temperature changes on perennial grass and legume species in a review of climate change impact studies on pasture and rangeland in the USA. The positive effects of projected future temperature and precipitation changes on DM yield levels in northern Europe (ignoring any possible effects of elevated CO2 levels) shown in the present study and in that by Höglind et al. (Reference Höglind, Thorsen and Semenov2012) stand out in this context.
The present results give a first indication of harvest security under future climate change conditions compared with current conditions. Previous studies about harvest security in grass leys under future climate conditions are scarce. In regions such as continental Europe and the UK, where grass leys are used to a large extent for grazing, harvest security is often a smaller problem than in the production systems that dominate in Norway and other northern European countries. The difference in grassland management between regions makes it difficult to compare the lack of negative effects of climate change on harvest security found in the present paper for Norway with findings for other regions. Nevertheless, the differences in climate change effects on forage grass production between locations found in the present paper may have an impact on the geographical distribution of future grass-ley-based agriculture such as dairy, cattle and sheep production within Norway.
When interpreting the results of the present study, one should bear in mind the high uncertainty associated with all projections of future climate change and with generating weather data representing these projections. This uncertainty was reflected here in large variations in biomass yield of timothy grass. Consequently, statements about future production of perennial leys have to be made with caution until the prediction of future climate conditions becomes more accurate and precise. Moreover, the present study only included one scenario for greenhouse gas emissions, the SRES scenario AB1. This scenario represents intermediate levels of greenhouse gas emissions compared with other SRES scenarios. Including other SRES scenarios, e.g. those assuming higher greenhouse gas emissions than assumed in the AB1 scenario, could have resulted in different biomass yield and harvest security results. As pointed out by Hallegatte et al. (Reference Hallegatte, Przyluski and Vogt-Schilb2011) there is also a need to construct new scenarios of climate change, to better grasp its uncertainty in impact studies than what is possible in the SRES scenarios. Furthermore, direct effects of elevated atmospheric CO2 levels were not included in the present study owing to lack of data for calibrating the CO2 response function for timothy (Höglind et al. Reference Höglind, Thorsen and Semenov2012). Based on previous studies from other regions, it can be assumed that such effects would further increase the difference in biomass yield between the period 1961–90 and the two future periods. However, elevated atmospheric CO2 levels would not directly change the harvesting conditions for perennial grasses. Possible indirect changes such as longer drying times due to higher biomass production cannot be assessed by the harvest security indices used here. Neither were possible changes in overwintering conditions that may affect biomass production taken into account. An earlier study (Thorsen & Höglind Reference Thorsen and Höglind2010) indicated an increased risk of winter injury in timothy in a few locations in Northern Europe, but not in any of the locations in Norway included in the present study.
In addition to climatic conditions, soil type also affects biomass production and harvest security. One could assume that the soil type could affect both the drying process of the grass in the field and the harvesting practices. The simulations of the present study were performed for a moderately drought-sensitive soil with a storage capacity of 100 mm plant-available water to 0·6 m depth. Results from a previous study (Höglind et al. Reference Höglind, Thorsen and Semenov2012), which compared irrigated and non-irrigated timothy production suggest that the annual yield should be water-limited at nearly all locations and periods for this soil. However, it is impossible to know how representative the soil that was used in the present study is for the ley production in Norway, since detailed data about the proportion of different soil texture classes in agricultural soils in Norway are lacking. Soil statistics (Eriksson et al. Reference Eriksson, Andersson and Andersson1991) and estimates of soil water-holding capacity (Berglund et al. Reference Berglund, Berglund and Gustafson Bjureus2002) from Sweden show that about two-thirds of the agricultural soils in Sweden have a water-holding capacity for leys above 100 mm. The conditions for grass production in Norway and Sweden are similar in many ways. In total, these statistics indicate that the water-holding capacity of the soil used in the present study could be representative for an intermediately drought-sensitive soil for many regions in Scandinavia.
CONCLUSIONS
In conclusion, the results from the present study showed positive effects of climate change on timothy grass production at five locations in Norway with conditions that are representative for large regions of Northern Europe. Biomass production was higher at all locations under future climate conditions compared with the current baseline conditions and there were no consistent negative effects on harvest security, as evaluated using accumulated precipitation and dry spell duration after harvest. Further studies of perennial grass production and production security under climate change conditions could be extended to include more scenarios of greenhouse gas emissions, as well as the direct impact of elevated atmospheric CO2 levels. Such studies could also include other cultivars with hypothetical traits to explore in more detail the options for adaptation of timothy-based grass production systems to future conditions by breeding. It is reasonable to believe that the plant breeding industry will develop cultivars that are better adapted to the expected future climate than currently grown cultivars. Alternative harvest security indices that take into account indirect effects of higher biomass production and interactions between climate change and soil type could also be formulated and evaluated.
We thank Dr Hans Martin Hanslin and Dr Torfinn Torp, Norwegian Institute for Agricultural and Environmental Research, for help and discussions about the statistical analyses. The present study was conducted with financial support from the Norwegian Ministry of Agriculture and Food.