



Introduction
The plain of the Sarno River (Campania, Italy) is especially known for the presence of Pompeii, the world's most famous archaeological site of the Roman age. This town was completely buried by the Plinian eruption of the Somma–Vesuvius volcano in CE 79 (Sigurdsson et al., Reference Sigurdsson, Carey, Cornell and Pescatore1985), which also destroyed the towns of Herculaneum, Stabiae, and the houses and farms distributed throughout the territory directly affected by the volcanic products (Fig. 1). For this reason, starting from the first excavations of Pompeii and Herculaneum at the end of eighteenth century, scholars have focused their studies mainly on the buried cities and remains as well as on the coastal plain area, where most of these are found. Particular attention was devoted to the paleogeographical reconstruction of the coastal sector, which was deeply modified by the eruption (Cinque and Russo, Reference Cinque and Russo1986; Barra et al., Reference Barra, Bonaduce, Brancaccio, Cinque, Ortolani, Pagliuca and Russo1989; Cinque, Reference Cinque1991; Pescatore et al., Reference Pescatore, Senatore, Capretto, Lerro and Patricelli1999). Indeed, the shoreline in CE 79 was located ~1 km inland with respect to the present position and was characterized by an articulated profile, with marshy areas and a lagoon. This is where the most recent research has focused, searching for the ancient port that has not yet been located (Nicosia et al., Reference Nicosia, Bonetto, Furlan and Musazzi2019; Amato et al., Reference Amato, Aiello, Barra, Infante and Di Vito2021). The physiographic and environmental conditions of the entire plain just before CE 79 were reconstructed through interdisciplinary research, with particular attention to the dynamics of rural settlements (Seiler et al., Reference Seiler, Kastenmeier and Vogel2009, Reference Seiler, Märker, Kastenmeier, Vogel, Esposito, Heussner, Boni, Balassone, Di Maio, Joachimski, Bork, Meller and Gerlach2011; Vogel et al., Reference Vogel, Esposito, Seiler and Märker2012).
Geographical sketch of the study area with position of sites cited in the text. FSV = Fossa San Vito.

Investigations on more ancient periods were limited to the study of necropolises (Iron Age to Archaic Period) in the upper Sarno Plain (e.g., d'Ambrosio, Reference d'Ambrosio1988a; Longo, Reference Longo and Longo2010a, Reference Longo and Longob), until the discovery in 2000 of the Longola site, in the present Poggiomarino neighborhood (Cicirelli and Albore Livadie, Reference Cicirelli and Albore Livadie2011). This well-preserved peri-fluvial village, which developed along the Sarno River during a period of weaker volcanic activity, allowed a continuity in the use of the site. This discovery opened the way for new hypotheses about occupation of the plain during Protohistory and enhanced the research of other settlements through geoarchaeological investigations (Cicirelli and Di Maio, Reference Cicirelli and Di Maio2009).
Even though the most famous volcanic eruption of Somma–Vesuvius is that of CE 79, other explosive events affected the Sarno Plain over the last millennium. These explosive events are known as Mercato (8.9 ka; Santacroce et al., Reference Santacroce, Cioni, Marianelli, Sbrana, Sulpizio, Zanchetta, Donahue and Joron2008), Avellino (3.87 ka; Passariello et al., Reference Passariello, Albore Livadie, Talamo, Lubritto, D'Onofrio and Terrasi2009), AP1–6 (AP = Avellino–Pompeii; ca. 3.7 ka for AP1, doubtful age of 217 BCE for AP6; Rolandi et al., Reference Rolandi, Petrosino and McGeehin1998; Andronico and Cioni, Reference Andronico and Cioni2002; Santacroce et al., Reference Santacroce, Cioni, Marianelli, Sbrana, Sulpizio, Zanchetta, Donahue and Joron2008), and Pollena (CE 472; Sulpizio et al., Reference Sulpizio, Mele, Dellino and La Volpe2005). Pyroclastic fall deposits of the Agnano–Monte Spina eruption from Campi Flegrei (age between 4482 and 4625 cal yr BP; Smith et al., Reference Smith, Isaia and Pearce2011) can also be found in the upper Sarno Plain with thicknesses of less than 10 cm (de Vita et al., Reference de Vita, Orsi, Civetta, Carandente, D'Antonio, Deino and di Cesare1999).
The most important and well-studied protohistoric eruption is the Avellino event that buried and preserved many Early Bronze Age settlements in Campania. Since discovery of the Palma Campania village (Fig. 1) in the 1970s (Albore Livadie and D'Amore, Reference Albore Livadie and D'Amore1981), the disruptive effects of this eruption have been extensively studied at several sites, including Afragola and Nola (Fig. 1; Di Vito et al., Reference Di Vito, Zanella, Gurioli, Lanza, Sulpizio, Bishop, Tema, Boenzi and Laforgia2009; Albore Livadie and Vecchio, Reference Albore Livadie and Vecchio2020), which represent exceptional archives for reconstructing the eruption dynamics and effects. Comparative studies have hypothesized that the effects of the Somma–Vesuvius and Campi Flegrei eruptions have strongly influenced the growth and decline of many human settlements over the millennia (e.g., Nava et al., Reference Nava, Giampaola, Laforgia and Boenzi2007; De Simone et al., Reference De Simone, Perrotta and Scarpati2011; Di Lorenzo et al., Reference Di Lorenzo, Di Vito, Talamo, Bishop, Castaldo, de Vita, Nave, Pacciarelli, Meller, Bertemes, Bork and Risch2013; Di Vito and de Vita, Reference Di Vito and de Vita2013; Albore Livadie and Vecchio, Reference Albore Livadie and Vecchio2020). To better decipher these dynamics, data on the paleolandscape and paleoenvironment are needed.
The available knowledge on the past environment of the Sarno Plain is based on limited pollen data from archaeological layers, mostly dated to CE 79, which shed some light on land use in urban and peri-urban contexts (Mariotti Lippi, Reference Mariotti Lippi2000; Dimbleby and Grüger, Reference Dimbleby, Grüger, Jashemski and Meyer2002; Jashemski and Meyer, Reference Jashemski and Meyer2002; Mariotti Lippi and Bellini, Reference Mariotti Lippi, Bellini, Morel, Tresseras and Matamala2006; Barone Lumaga et al., Reference Barone Lumaga, Russo Ermolli, Menale and Vitale2020). More recently, Vignola et al. (Reference Vignola, Bonetto, Furlan, Mazza, Nicosia, Russo Ermolli and Sadori2022) provided a pollen sequence reconstructing the environmental conditions and the plant landscape of the Pompeii surroundings between 900–750 BCE and CE 79. Their study revealed that this portion of the Sarno floodplain was a freshwater backswamp with patchy inundated and dry areas, characterized by a mosaic of vegetation types including Mediterranean coastal scrubland, hygrophilous plants, and mesophilous trees. Anthropogenic traits since pre-Roman times show the occurrence of pasturelands, cultivated fields, and olive groves.
The scarcity of data on the past environment and landscape of the Sarno Plain is related to the difficulty of finding sediments suitable for palynological analysis in an alluvial environment rich in repeated primary and secondary volcanic inputs (Di Vito et al., Reference Di Vito, Calcaterra, Petrosino, Zanchetta, de Vita, Marotta, Cesarano, De Simone, Sansivero and Rucco2019a, Reference Di Vito, Rucco, de Vita, Doronzo, Bisson, Vitturi and Rosi2024). Discovery in the inner sector of a thick lacustrine deposit, whose base is older than 5500 years (Santo et al., Reference Santo, Santangelo, De Falco, Forte and Valente2019), has provided an exceptional opportunity to study in detail the environmental evolution of this area over the past millennia. The presence of numerous Campi Flegrei and Somma–Vesuvius primary and reworked volcanic levels also provided the dual opportunity to refine the chronology of the fill and to study the effects of eruptions on vegetation and human activities. Reworked tephra can make chronostratigraphic reconstructions very difficult, but when the age and extent of reworking are accurately retraceable, as in the sequence here presented, the reworked materials derived from tephra may provide a viable secondary isochron (Lowe, Reference Lowe2011).
The aims of this work are thus: (1) build a vegetation record for the last six millennia in the upper Sarno Plain; (2) scan the sequence of landscape and land use changes by combining paleoenvironmental, chronological, and archaeological/historical data; and (3) highlight the direct and/or indirect effects of volcanic eruptions on the environment and human activities in the upper Sarno Plain.
The Study Site
Geological and geomorphological setting
The Sarno Plain (~15 km long and ~9 km wide) is a portion of the wider Campania Plain, a large peri-Tyrrhenian graben situated along the inner sector of the Southern Apennines (Fig. 1). During the Early and Middle Pleistocene, this area was affected by a strong tectonic subsidence and was filled by a sequence of marine and transitional deposits several hundred meters thick, resting on the buried Mesozoic–Cenozoic carbonate bedrock (Santangelo et al., Reference Santangelo, Romano, Ascione and Russo Ermolli2017, and references therein). Volcanic products from Neapolitan volcanoes also accumulated in the last 100 ka, among which the Campanian Ignimbrite (CI, ca. 40 ka; Giaccio et al., Reference Giaccio, Hajdas, Isaia, Deino and Nomade2017) represents the most important chronostratigraphic marker in the area.
The plain is limited by carbonate mountains, bounded by NW–SE and NE–SW trending fault scarps with regional significance. The transition between the plain and the mountain sectors is characterized by the presence of a wide piedmont area, consisting in several generations of entrenched and superimposed alluvial fans as well as volcaniclastic and debris slope deposits. The oldest generations are chronologically constrained to Late Pleistocene and Holocene, while the youngest are still active (Cinque et al., Reference Cinque, Alinaghi, Laureti and Russo1987; Valente et al., Reference Valente, Ascione, Santangelo and Santo2019).
The Fossa San Vito sinkhole
In the foothill alluvial belt of the Sarno Mountains, a wide sinkhole is present, named Fossa San Vito (FSV; Figs. 1 and 2a). Sinkholes are sub-circular closed depressions, with width and depth ranging from a few to several hundred meters, originated by a collapse of the topographic surface induced by either natural causes or human activities, such as mining, quarrying and groundwater pumping (Vennari and Parise, Reference Vennari and Parise2022). Depending on the kind of materials involved in the collapse and on the main subsidence mechanism, several classifications have been proposed (e.g., Gutiérrez et al., Reference Gutiérrez, Parise, De Waele and Jourde2014). In particular, Santo et al. (Reference Santo, Santangelo, De Falco, Forte and Valente2019) have classified the FSV as a peculiar type of cover collapse sinkhole affecting alluvial and pyroclastic deposits resting on top of a deeply buried carbonate bedrock. Gutiérrez et al. (Reference Gutiérrez, Parise, De Waele and Jourde2014) also suggested that this kind of sinkhole is likely to occur immediately after strong earthquakes, as testified by case studies in Italy and in other parts of the world (Del Greco et al., Reference Del Greco, Garbarino and Oggeri2004; Buchignani et al., Reference Buchignani, D'Amato Avanzi, Giannecchini and Puccinelli2008).
(a) Geomorphological sketch of the study area with position of Fossa San Vito (FSV) sinkhole and B24 core. 1 = Alluvial deposits (Holocene); 2 = active alluvial fan (Late Pleistocene–Holocene); 3 = entrenched alluvial fan (Middle-Late Pleistocene); 4 = debris slope deposits (Middle–Late Pleistocene); 5 = carbonate bedrock (Mesozoic); 6 = quarry; 7 = water flow tank; 8 = fault. (b) Cross section A–B of the FSV sinkhole showing the buried morphostratigraphical setting.

FSV has a typical sub-circular planar shape (200 m in diameter and an area of ~35,000 m2) and an asymmetric longitudinal profile (Fig. 2b), with a higher inner scarp towards the NNE (max height ~25 m) that decreases towards the SSW (~15 m; Santo et al., Reference Santo, Santangelo, De Falco, Forte and Valente2019). The sinkhole inner scarps provide good exposures of the stratigraphic units involved in the collapse, including the CI and the pyroclastic and alluvial deposits resting on its top.
A detailed morphostratigraphic study carried out by Santo et al. (Reference Santo, Santangelo, De Falco, Forte and Valente2019), supported by the analysis of ancient and newly drilled boreholes and 14C dating, allowed reconstruction of the sinkhole origin and evolution. The collapse intersected the upper portion of the piedmont stratigraphy, including the entire CI formation, involving a volume of materials of about 40,000 m3. It occurred abruptly, causing the formation of a cylinder-like depression, at least 50 meters deep, which was rapidly occupied by a lake.
The cross section in Figure 2b shows the subsurface stratigraphic setting of the FSV sinkhole. The top of the CI deepens towards the sinkhole center and is covered by a thinly layered succession of silts and clays alternating with coarser material, which testifies to the presence of a lake, whose depocenter can be located in the central-northern sector of the sink area. 14C dating of a piece of wood, found at the base of the infilling sequence, allowed the collapse to be dated to ca. 5500 cal. yr BP (Santo et al., Reference Santo, Santangelo, De Falco, Forte and Valente2019). After that time, the lake was progressively filled by alluvial deposits coming from the upper part of the piedmont area and by pyroclastic fall deposits, both primary and reworked. The presence of a small medieval church (San Apollonia) located inside the sinkhole (Guarino and Nisio, Reference Guarino and Nisio2010) testifies that in historical times the lake had already disappeared or was much reduced in extent.
Climate and vegetation
The climatic context of the study area is Mediterranean, with differences in rainfall and thermal conditions related to variations in altitude and slope exposure. The average annual rainfall is 1000–1100 mm in the low-elevation sectors and 1400–1500 mm in the summit sectors (Iovino and Menguzzato, Reference Iovino and Menguzzato1991). Rainfall distribution presents a typical Mediterranean regime with about 70% of rainfall concentrated in the autumn–winter period. Thermal data indicate that the area lies between isotherm 17° (100 m asl) and 10° (1134 m asl), the average minimum temperatures of the coldest month are between 5.6°C and −2.4°C, and the average maximum temperatures of the warmest month are between 30.5°C and 24.5°C (Iovino and Menguzzato, Reference Iovino and Menguzzato1991).
The distribution of vegetation is directly affected by anthropogenic action, which has changed the composition and structure of forests and caused, in some areas, even their disappearance or their replacement with species of agronomic interest (mainly hazelnut groves; Iovino, Reference Iovino2007).
Different thermopluviometric conditions allow the vegetation of the study area to be included in the Mediterranean sclerophyll and in the deciduous broadleaf belts. The former is currently characterized by degraded scrubland alternating with areas with olive, hazelnut, and chestnut groves, and holm oak (Quercus ilex) forests. The deciduous broadleaf belt is represented mostly by chestnut coppices and to a lesser extent by oak groves with a predominance of turkey oak (Q. cerris) and downy oak (Q. pubescens). Along with the oaks, there are other mesophilic and mesoxerophilic broadleaf trees including black hornbeam (Ostrya carpinifolia), opal maple (Acer opalus), and ash (Fraxinus ornus), to which Neapolitan alder (Alnus cordata) is added in the wetter areas. Such formations prevail from 600/700 m up to about 1000 m. On the other hand, in the hilly sector and warmer exposures below 700 meters, oak forests with the presence of hornbeam and ash prevail (Iovino, Reference Iovino2007).
Archaeological setting
The most ancient evidence of settlement in the upper Sarno Plain comes from the Foce locality, at the foot-slope of the Sarno Mountains (Fig. 3a). This site shows a continuity of living from the Middle and Final Neolithic (second half fourth millennium BCE) up to the Early Bronze Age (EBA; 2150–1850 BCE), when the village was abandoned before the Avellino eruption (Marzocchella, Reference Marzocchella, Tazieff and Vallet1986, Reference Marzocchella1994; Marzocchella et al., Reference Marzocchella, Calderoni, Nisbet and Albore Livadie1999) whose products were found over traces of habitation huts (Palma Campania facies), animal shelters, and foodstuff. Pre-protohistoric sporadic materials were also recovered on the slopes of the Saretto hill (Marzocchella et al., Reference Marzocchella, Calderoni, Nisbet and Albore Livadie1999), near the Palazzo spring, and in San Giovanni (Fig. 3a; Marzocchella, Reference Marzocchella, Tazieff and Vallet1986, Reference Marzocchella1994), where they have been chronologically placed in the Middle Bronze Age 3 (MBA3; Apennine facies: 1400–1300 BCE).
Distribution of the most important archaeological sites (red circles) in the upper Sarno valley. For details on the numbered sites, see Supplementary Material (Tab. 1SM). (a) Neolithic, Eneolithic, and Bronze Age; (b) Iron Age, Orientalizing, and Archaic periods; (c) Hellenistic and Roman periods; (d) Middle Age. FSV = Fossa San Vito sinkhole.

The most important site for the Protohistory of the plain is Longola, a fluvial village located in a meander of the Sarno River (Fig. 3a and b), ~8 km to the SW of the Sarno Mountains. Here, the discovery of finds in polished stone suggested a widespread presence of Neolithic communities in the plain (Albore Livadie, Reference Albore Livadie, Cicirelli and Albore Livadie2011). Spare evidence of MBA3 is also present at Longola before a period of caesura after which the well-known Iron Age (950–725 BCE) settlement developed, up to the sixth century BCE. The Longola site and other finds located along the Sarno River have demonstrated that flat morphologies close to waterways represented a choice for settlement in the protohistoric period (Albore Livadie and Cicirelli, Reference Albore Livadie and Cicirelli2003; Guzzo, Reference Guzzo2003; D'Angelo, Reference D'Angelo2004).
The archaeological importance of the territory is certainly linked to the extensive finds of necropolises from the Iron Age (“fossakulture”; ninth through eighth centuries BCE) and Orientalizing period (seventh century BCE), the most important of which are located in the present San Marzano, San Valentino Torio, and Striano neighborhoods (Fig. 3b; d'Ambrosio, Reference d'Ambrosio1988a, Reference d'Ambrosiob, Reference d'Ambrosio1990, Reference d'Ambrosio1991, Reference d'Ambrosio1993, Reference d'Ambrosio1999, Reference d'Ambrosio2003, Reference d'Ambrosio2005; Rota, Reference Rota1994; Greco and Mermati, Reference Greco, Mermati, Herring, Lemos, Lo Schiavo, Vagnetti, Whitehouse and Wilkins2006; d'Ambrosio et al., Reference d'Ambrosio, Di Maio and Scala2009; d'Agostino, Reference d'Agostino2010–2011; Longo, Reference Longo and Longo2010a, Reference Longo and Longob; Laudonia, Reference Laudonia, Cipriani, Greco, Pontrandolfo and Scafuro2019). During the middle eighth century BCE, contacts with the Greek colonies of Cumae and Pithecusa are evinced by the presence in these necropolises of rich funerary objects and imported materials (Rota, Reference Rota1994; D'Anna et al., Reference D'Anna, Pacciarelli, Rota, Paoletti and Bettini2011). Between the end of seventh century BCE and the beginning of the sixth century BCE, an important cultural change led to the foundation of the main fortified centers of Pompeii, Stabiae, and Nuceria (Fig. 1; Guzzo, Reference Guzzo2007). During the sixth century BCE, the necropolises were no longer in use, probably due to the abandonment of the small agricultural villages in favor of these new cities (Longo, Reference Longo and Longo2010c).
After a century of presumed abandonment, it appears that the territory was resettled from the fourth century BCE, when Samnite tribes became integrated with the population of the cities. Samnite tombs with very rich outfits were found at San Valentino Torio and Sarno (Rota, Reference Rota1994; Albore Livadie, Reference Albore Livadie, Cicirelli and Albore Livadie2011) testifying to a slow transformation process of the rural settlement in the Sarno River plain (Vogel et al., Reference Vogel, Märker, Esposito and Seiler2016a). The most recent tombs are placed chronologically between the end of the third century BCE and the beginning of the second century BCE (Rota, Reference Rota1994).
From this period onwards, important public structures were built, including a Hellenistic–Roman theatre (Foce), which was damaged by the earthquake of CE 62 (de Spagnolis Conticello, Reference de Spagnolis Conticello1994). This theatre was probably located close to an extra-urban sanctuary (fourth and second centuries BCE), as evinced by the recovery of a large amount of votive clay material (de Spagnolis Conticello, Reference de Spagnolis Conticello1994).
Archaeological discoveries from the Roman period are abundant (Fig. 3c; de Spagnolis Conticello, Reference de Spagnolis Conticello1994; Longo, Reference Longo and Longo2010c). The most significant evidence is related to traces of the Serino aqueduct, built in the Julio-Claudian period (first century BCE through first century CE), which supplied water to Pompeii, Neapolis, Puteoli, and Misenum (De Feo and Napoli, Reference De Feo and Napoli2007; Libertini et al., Reference Libertini, Miccio, Leone and De Feo2017; Filocamo et al., Reference Filocamo, Carlut, Dessales, Burckel and Borensztajn2018, and references therein). The numerous remains of this famous aqueduct are located on the same axis of via Popilia, an important road that connected, among others, Nola and Nuceria (de Spagnolis Conticello, Reference de Spagnolis Conticello1994). Some villae rusticae (farms) are scattered in the territory (de Spagnolis Conticello, Reference de Spagnolis Conticello1994; Soricelli, Reference Soricelli and Franciosi2002) as well as traces of the first agrarian subdivisions, which are dated to the first century BCE, after the social war that established the definitive dominance of Rome (Soricelli, Reference Soricelli and Franciosi2002).
There is little evidence of occupation of the upper Sarno Plain after CE 79, whereas a clear resettlement occurs after the Late Ancient eruption of CE 472 (de Spagnolis Conticello, Reference de Spagnolis Conticello1994). Archaeological evidence for the early Middle Age (570–1220 CE) is incomplete but balanced by written sources (Fig. 3d). Following the barbarian raids, local populations took refuge on the hillslopes, where the first settlement of Terravecchia was built. With the advent of the Lombards (sixth century CE) and the establishment of the Benevento duchy, Sarno became the seat of a gastaldate. The top of the hill was fortified, thus starting the history of the castle, whose importance grew between the Norman–Swabian and Aragonese periods (from eleventh century CE) and subsequently waned during the viceregal period (sixteenth century CE; Cordella, Reference Cordella, Mazzocchella, Rota, de Spagnolis Conticello, Andria, Iannelli and Cordella1994).
Some local and Lombard early medieval tombs (Villa Venere–San Vito) were found near a main road suggesting that during the early Middle Age, people used to adapt previous structures to their needs and provided routine maintenance of public facilities (Iannelli, Reference Iannelli1994). Other tombs were located near the San Vito church, sited in 1049, which probably represented a pole of aggregation for the rural population since the eighth century CE (Iannelli, Reference Iannelli1994). The church is located outside the southern edge of the FSV sinkhole and incorporates spolia of a Roman column, suggesting the possibility that it was built on the remains of an ancient Roman temple. Inside the same sinkhole, the remains of the early medieval church of Santa Apollonia were discovered, with frescoes dating from the fifth to the ninth centuries CE (Guarino and Nisio, Reference Guarino and Nisio2010).
From the ninth century and at least until the eleventh century, the Sarno territory was under the direct control of the Abbey of Cava de’ Tirreni. Documents in the Codice Diplomatico Cavense (CDC, I, p. 12 [822 AD], p. 15 [827 AD], p. 49 [857 AD], p. 50 [857 AD], p. 53 [AD 857], p. 57 [859 AD], p. 84 [AD 889], p. 88 [AD 882], p. 148 [AD 928], p. 188 [AD 955]) state that the area was intensively cultivated with vineyards, orchards, cereals, legumes, oaks and chestnuts, while olive trees climbed near Villa Venere (Iannelli, Reference Iannelli1994).
A document of 1066 (Bull granted in 1066 by Alfano I, Archbishop of Salerno, for the reorganization of the Sarnese diocese) attests that the major centers in the Sarno Plain at that time were Sarno, San Valentino (Balentinu), San Marzano, and Striano (Istricanum) and that a large forest, the Sylva Mala, occupied the area of the present-day settlement of Boscoreale (Savino, Reference Savino2005). Several female monasteries developed in the fourteenth century CE, under the control of Robert d'Anjou and Sancia d'Aragon (Franco, Reference Franco and Vitolo2016), in an area that must have been marshy in several places due to the frequent Sarno River floods.
During the Norman–Swabians, Angievin, and Aragonese domination (eleventh through fifteenth centuries CE), the Sarno Plain gained a strategic importance as a hinge between the “Terra di Lavoro”, the Sorrento Coast, and the Salerno area (Vitolo, Reference Vitolo2016). Finally, on the banks of the Sarno River, the so-called “Rotta di Sarno” was fought in 1460, between Angevin and Aragonese troops, which ended with the victory of the latter (Savino, Reference Savino2005; Cappelli, Reference Cappelli, Abbamonte, Barreto, D'Urso, Perriccioli, Saggese and Senatore2011). A reclamation of the Sarno area was undertaken in 1592 to improve the quality of the soil and obtain a wider stretch of land to be cultivated (Cappelli, Reference Cappelli, Abbamonte, Barreto, D'Urso, Perriccioli, Saggese and Senatore2011). Further details on the cited sites can be found in Supplementary Material (Table 1SM).
Materials AND Methods
Core B24
The core B24 (40°48′09″N, 14°38′32″E; 30 m asl), drilled by Santo et al. (Reference Santo, Santangelo, De Falco, Forte and Valente2019) at the sinkhole depocenter (Fig. 2b), intercepted the entire post-collapse infilling. This is characterized by 50 meters of lacustrine silts alternated with sands and gravels (Fig. 4) resting on the primary and reworked products of the CI. The thinly layered lacustrine silts and clays often include plant-rich horizons. Locally, coarser levels made up of carbonate gravels are also present. Throughout the infilling it is possible to identify ashy and sandy layers of pyroclastic origin as well as pumice fragments. Due to the presence of frequent coarse levels, some core intervals were lost during drilling operations (for details see Santo et al., Reference Santo, Santangelo, De Falco, Forte and Valente2019).
Core B24 log with position of pollen samples, dated levels, and tephra layers.

Pollen analysis
Pollen analysis was undertaken on 70 samples collected in the fine-grained intervals of the B24 core, between 10.80 and 47.60 m depth (Fig. 4). Samples were treated with a chemical–physical procedure including HCl and HF digestion, ultrasonic sieving at 200 μm and 10 μm, and ZnCl2 separation. A detailed pollen diagram was constructed (TiliaGraph; Grimm, Reference Grimm2004) with almost all recognized taxa (very rare taxa excluded) plotted against core depth (cm). Diagram zonation was provided by TiliaGraph through constrained cluster analysis, which measures samples’ similarity, in terms of distance in a multidimensional space, by respecting their stratigraphical order (for details see Di Donato et al., Reference Di Donato, Esposito, Russo-Ermolli, Scarano and Cheddadi2008, Reference Di Donato, Esposito, Garilli, Naimo, Buccheri, Caffau, Ciampo, Greco and Stanzione2009). Particular attention was devoted to the recognition of anthropogenic indicators that were grouped following their significance with respect to the different human activities: tree crops, cereal crops, ruderals, grazing practices, and fire activity. A synthetic diagram was built with taxa and groups of taxa, as indicated in Table 1, with the aim of better visualizing the evolution of the landscape and environmental setting as well as the anthropogenic activities. Indeterminate grains, spores, and non-pollen palynomorphs (NPPs) were excluded from the pollen sum for the calculation of AP and NAP percentages.
List of taxa and taxa groups as plotted in the synthetic pollen diagram

Wood analysis
Wood analysis was carried out on six samples taken from the B24 core at 36.10, 36.15, 36.20, 38.90, 39.50, and 45.00 m depth. Samples were directly observed under a RL (reflected light) microscope at different magnifications (from 100× to 400×), with the support of atlases (Schweingruber, Reference Schweingruber1978) and reference wood material. For each sample, three wood sections (transverse, radial, and tangential) were observed, in order to recognize the anatomical elements useful for taxonomic determination.
Tephrostratigraphy
Two kinds of volcaniclastic deposits, identified as primary tephra and reworked volcaniclastic layers, were recognized within the sediments of the FSV sinkhole. Primary tephra were well-sorted, sandy layers characterized by a sharp basal contact with lacustrine sediments. Reworked volcaniclastic layers contained sparse, up to cm-sized pumice fragments embedded in a sandy volcaniclastic matrix. Eleven samples from the two categories, labelled with an alphanumeric code (SV- for San Vito, numbers for the depth in meters), were recovered. Samples were repeatedly wet-washed in a + 3-phi sieve to remove the clayey fraction. Grain size and lithological component analyses were performed on the residue after pretreatment up to the +2-phi fraction. A standard working methodology was set to analyze glasses of the juvenile component of the two categories of samples: 30 and at least 100 juvenile fragments were extracted from +1- and +2-phi fraction of primary and reworked volcaniclastic layers, respectively. The fragments were embedded in epoxy resin and suitably polished for SEM–EDS chemical analysis. About 30 individual chemical data points were acquired on primary tephra, and at least 50 individual glass analyses points on different clasts were obtained on reworked volcaniclastic layers. The analyses were carried out at the DiSTAR SEM laboratory (University of Naples Federico II). The micro-analytical measurements were performed using a Field Emission Scanning Electron Microscope (FESEM) Zeiss Merlin VP Compact, used together with an X-ray energy dispersion spectrometer (EDS) and an X-ray wavelength dispersion spectrometer (WDS), equipped with four analytical crystal(s). Operating conditions and standards used for calibration are reported in Totaro et al. (Reference Totaro, Insinga, Lirer, Margaritelli, Català i Caparrós, de la Fuente and Petrosino2022).
Radiocarbon dating
The chronological framework of the B24 core was established through four 14C analyses. In particular, bulk samples were collected at 11.60, 23.50, and 27.50 m depth. Wood remains, collected at 45.00 m depth, were already dated by Santo et al. (Reference Santo, Santangelo, De Falco, Forte and Valente2019). Samples at 23.50 and 27.50 m depth were pre-treated at iCONa (isotopic mass spectrometry laboratory) of the Department of Environmental, Biological and Pharmaceutical Sciences and Technologies of University of Campania. Radiocarbon dating was performed by accelerator mass spectrometry using the dedicated beam line of the HVEE 3 MV Tandem accelerator installed at the INFN–LABEC laboratory in Florence. Samples at 11.60 and 45.00 m depth were dated with the same protocol at the CIRCE laboratory of the University of Campania Luigi Vanvitelli.
Results
The pollen diagram
Among the 70 analyzed samples, 61 were rich in pollen grains, the others were very poor or barren and therefore were excluded from the diagrams. Pollen sums ranged from 120 to 1200 grains; 66 taxa were identified; concentration values ranged from 4300 to 181,000 grains/gram of sediment. Two main compositional pollen zones were identified in the detailed diagram (Fig. 5).
Detailed pollen diagram with pollen zones (CONISS). Taxa percentages are plotted against depth (cm). Taxa colors reflect group composition as indicated in Table 1. MED = Mediterranean taxa; DEC = deciduous forest taxa; WW = wet woodland taxa; AP = arboreal pollen; NAP = non-arboreal pollen; Quercus dec. = deciduous species of Quercus.

Zone 1
Zone 1 is represented by 38 samples, from the base of the analyzed core interval up to ~18 m depth (Fig. 5). Cluster analysis allows subdividing the Zone 1 in four subzones (a, b, c, d). In subzone 1a, the AP curve shows values over 80%, identifying a closed landscape (sensu Favre et al., Reference Favre, Escarguel, Suc, Vidal and Thévenod2008) around the Fossa San Vito lake. The AP value decreases to 35% in subzone 1b and rises again, oscillating around 80%, in subzones 1c and 1d. Tree assemblages are dominated by deciduous Quercus, Carpinus, Ostrya, and Q. ilex, the latter showing a fluctuating decreasing trend from the base to the top of the zone. Carpinus is well represented only in subzone 1a and decreases drastically from subzone 1b. Concerning other deciduous forest elements, Hedera shows two peaks of ~25% at the end of subzone 1a (31 m) and in subzone 1c. Floodplain forest taxa (mainly Alnus and Corylus) do not show high percentages, whereas the montane forest is essentially represented by Fagus, which exhibits some peaks in subzones 1a and 1b but decreases in 1c and 1d. Vitis is almost constantly present throughout Zone 1, with values around 2–3%. Olea, Juglans, and Castanea start to be present from subzone 1c. The herb assemblages have very low amounts but show an increase in subzones 1b and 1c in concurrence with the AP declines. Only a few pollen grains of cereals are present in subzones 1b–d. Cyperaceae are constantly present but in low percentages, whereas Myriophyllum shows a significant increase in subzones 1c and 1d. In this same core interval, it is interesting to report the presence of eggs of Filinia longiseta (sensu Van Geel, Reference Van Geel, Smol, Birks and Last2001; Fig. 6a), a common and cosmopolitan planktonic rotifer usually occurring in shallow lakes and variety of small water bodies, known to be a valuable indicator of eutrophic waters (Karabin, Reference Karabin1985; Berzins and Pejler, Reference Berzins and Pejler1989). Trilete spores and microcharcoals start to increase from subzone 1b where the coprophilous fungal spores achieve their highest percentages.
(a) Two specimens of Filinia longiseta (sensu Van Geel, Reference Van Geel, Smol, Birks and Last2001) found in the sample at 23.77 m depth; (b) transverse section of Quercus cerris L. (sample at 38.90 m); (c) transverse section of Quercus ilex L. (sample at 45.00 m).

Zone 2
Zone 2 is represented by 18 samples, from ~18 up to 10.80 m depth, and is subdivided into two subzones (a, b). The AP curve shows an oscillating decreasing trend reaching its minimum at the beginning of subzone 2b and then a recovery up to the end of the zone (Fig. 5). The AP trend mainly follows the deciduous Quercus oscillations and is partly influenced by the wet woodland elements, dominated by Alnus, which progressively increase. Vitis and Castanea rise in this zone, the latter showing an notable peak in subzone 2a. Fagus is always present, yet with percentages lower than in Zone 1. The AP decline corresponds to progressive increase of herbs, dominated by Poaceae, Asteraceae, Lamiaceae, Brassicaceae, and Caryophyllaceae. Cereals show higher values throughout the zone. In addition, significant amounts of trilete spores and microcharcoals occur in all zones, whereas coprophilous fungal spores show high percentages, especially in subzone 2b.
Wood anatomy
All the analyzed wood samples were poorly preserved, presumably due to the taphonomic processes occurring after sedimentation. In all cases, the wood was particularly deformed and compressed and, in two cases (samples at 36.10 and 36.20 m), almost lithified. Moreover, infiltration of various plant elements was evident in the sample at 39.50 m. This poor preservation state altered the anatomical characters, which made the identification rather problematic. However, it was possible to identify the key characters in two samples, which led to species-level identification. The sample at 38.90 m depth was identified as Quercus cerris L. (Fig. 6b) and the sample at 45.00 m depth was identified as Quercus ilex L. (Fig. 6c).
Tephrostratigraphy
Based on grain-size data, the samples investigated can be classified as coarse-grained sands with a variable gravel fraction. Primary tephra layers are better sorted than slightly reworked ones, but the sorting also may have been influenced by the effects of subaqueous deposition. Analysis of the lithological components reveals the strikingly different characteristics of the primary and reworked tephra, the former being composed almost entirely of juvenile fragments, whereas in the latter the lithic (mostly limestone) clasts predominate over the juvenile fraction. Grain-size and lithological component diagrams of selected samples are reported in Supplementary Material (Figs. 1SM and 2SM).
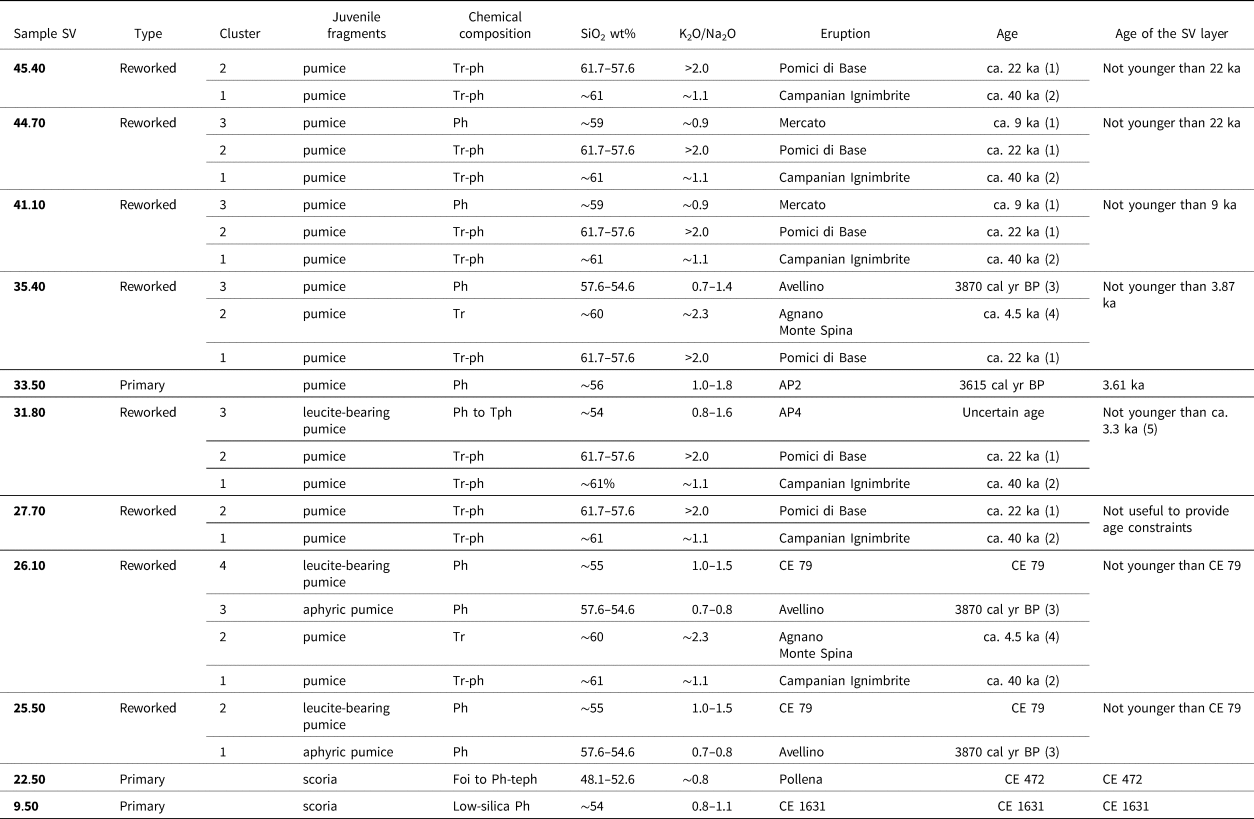
The glasses of juvenile fragments extracted from the primary tephra and volcaniclastic layers were classified according to a total alkali silica diagram (TAS diagram; e.g., Le Maitre, Reference Le Maitre2005) and mainly fall in the phonolite–tephriphonolite and trachyte fields, which are typical compositions of the products of Campi Flegrei and Somma–Vesuvius eruptions (see Totaro et al., Reference Totaro, Insinga, Lirer, Margaritelli, Català i Caparrós, de la Fuente and Petrosino2022, and references therein). The type-section of the primary pyroclastic fall deposits expected in the study area is shown in Figure 7. It was built, starting from the CI eruption (ca. 40 ka; Giaccio et al., Reference Giaccio, Hajdas, Isaia, Deino and Nomade2017), on the basis of previous field investigations both along the limestone mountains bordering the Sarno Plain and in the tectono-karstic basins on top of reliefs (Sulpizio et al., Reference Sulpizio, Zanchetta, Demi, Di Vito, Pareschi and Santacroce2006; Petrosino et al., Reference Petrosino, Rolandi and Bellucci2009; Vogel et al., Reference Vogel, Märker, Rellini, Hoelzmann, Wulf, Robinson and Steinhübel2016b; Di Vito et al., Reference Di Vito, Calcaterra, Petrosino, Zanchetta, de Vita, Marotta, Cesarano, De Simone, Sansivero and Rucco2019a, Reference Di Vito, Rucco, de Vita, Doronzo, Bisson, Vitturi and Rosi2024).
Left: type section of the pyroclastic fall deposits cropping out in the upper Sarno Plain (the same area of Fig. 3); the thicknesses shown for the single layers are the maximums recorded in the area. Right: plot of the eruptions found in the San Vito succession; red flag = primary tephra (mono-component); yellow flag = reworked tephra (poly-component). See text for further details.

The thickest pyroclastic-fall deposits in the area were emplaced by the caldera forming CI eruption from Campi Flegrei and the Pomici di Base (ca. 22 ka; Santacroce et al., Reference Santacroce, Cioni, Marianelli, Sbrana, Sulpizio, Zanchetta, Donahue and Joron2008) and Mercato (ca. 9 ka; Santacroce et al., Reference Santacroce, Cioni, Marianelli, Sbrana, Sulpizio, Zanchetta, Donahue and Joron2008) eruptions from Somma–Vesuvius. The deposits from sustained column phases of sub-Plinian events (e.g., AP2, CE 472 Pollena, CE 1631 Somma–Vesuvius eruptions) are also recorded in the San Vito sinkhole area. Bearing in mind the primary pyroclastic deposits possibly emplaced in the area, for which a rich database is available in the literature (e.g. Santacroce et al., Reference Santacroce, Cioni, Marianelli, Sbrana, Sulpizio, Zanchetta, Donahue and Joron2008; Smith et al., Reference Smith, Isaia and Pearce2011; Tomlinson et al., Reference Tomlinson, Arienzo, Civetta, Wulf, Smith, Hardiman and Lane2012; Totaro et al., Reference Totaro, Insinga, Lirer, Margaritelli, Català i Caparrós, de la Fuente and Petrosino2022, and references therein), we compared their chemical compositions with those of juvenile fragments extracted from the FSV sequence. Apart from the three primary tephra, the glasses of which have a homogeneous chemical composition, the results of the analyses of the reworked volcaniclastic layers clustered to identify different sourcing eruptions starting from CI. On these clusters, we used a “first appearance” approach, considering the age of the emplacing eruptive event a post-quem age constraint for the layer in which we found the juvenile fragments of a specific Campi Flegrei or Somma–Vesuvius eruption (Fig. 7) for the first time. These correspond well with the primary products found in outcrops of the area (see the type-section of Fig. 7). Under this premise, some reworked layers (e.g., SV 27.70) were not useful to provide an age constraint, because only juvenile fragments from eruptions older than the inferred chronostratigraphic position were found within them.
The results on the analyzed samples, from the deepest to the topmost, are reported in Table 2. Figure 8 illustrates a selection of chemical diagrams. The full set of chemical data and diagrams is reported in Supplementary Material (Fig. 3SM), along with the detailed discussion on tephra attribution.
Summary of the attribution of the primary and reworked tephra embedded in the San Vito sequence, with the age constraints derived from tephrostratigraphic analysis. Abbreviations: Tr = trachyte; Tr-ph = trachy-phonolite; Ph = phonolite; Tph = tephriphonolite; Ph-teph = phono-tephrite; Foi = foidite. (1) Santacroce et al. (Reference Santacroce, Cioni, Marianelli, Sbrana, Sulpizio, Zanchetta, Donahue and Joron2008); (2) Giaccio et al. (Reference Giaccio, Hajdas, Isaia, Deino and Nomade2017); (3) Passariello et al. (Reference Passariello, Albore Livadie, Talamo, Lubritto, D'Onofrio and Terrasi2009); (4) Smith et al. (Reference Smith, Isaia and Pearce2011); (5) Totaro et al. (Reference Totaro, Insinga, Lirer, Margaritelli, Català i Caparrós, de la Fuente and Petrosino2022) and references therein. See Supplementary Materials for further details
Total alkali–silica diagrams (on the left) and (CaO + MgO)/FeO vs K2O/Na2O diagrams (on the right) for glasses extracted from juvenile fragments of three selected tephra layers compared to the products of the correlative eruptions. (1) Data from Santacroce et al. (Reference Santacroce, Cioni, Marianelli, Sbrana, Sulpizio, Zanchetta, Donahue and Joron2008); (2) data from Pappalardo et al. (Reference Pappalardo, Buono, Fanara and Petrosino2018); (3) data from Tomlinson et al. (Reference Tomlinson, Arienzo, Civetta, Wulf, Smith, Hardiman and Lane2012).

Core chronology
The results of 14C dating, shown in Table 3, indicate that the base of the analyzed sedimentary succession is older than 5473 years. The deepest sample, consisting of evergreen oak wood, was dated by Santo et al. (Reference Santo, Santangelo, De Falco, Forte and Valente2019). The other ages, which are part of this work, were obtained on bulk sediment samples. Calibration of radiocarbon ages was obtained through the IntCal 13.14C dataset, with Calib 8.2 (Reimer et al., Reference Reimer, Bard, Bayliss, Beck, Blackwell, Bronk Ramsey and Buck2013).
Results of radiocarbon dating. Calibration data set: IntCal13.14c (Reimer et al., Reference Reimer, Bard, Bayliss, Beck, Blackwell, Bronk Ramsey and Buck2013). The sample at 45.00 m depth was dated by Santo et al. (Reference Santo, Santangelo, De Falco, Forte and Valente2019)

Discussion
The robustness of the core chronology, which is the basis of any cross-correlation between different data sets, is clearly shown in the age–depth graph (Fig. 9) in which the chronostratigraphical positions of all tephra samples fall very close to the segments joining the 14C ages. Despite the reliability and consistency of all chronological markers, the frequent alternation of fine- and coarse-grained levels is evidence that deposition in the San Vito sinkhole occurred at different sedimentation rates and that the use of an age model based on average values (Fig. 9) could lead to spurious correlations among data sets. For this reason, we opted to construct a synthetic pollen diagram plotted against depth, with the age added as a secondary scale (Fig. 10).
Age/depth plot of the B24 core. The black line represents the linear interpolation between median probabilities of 14C-dated levels (black dots). Average values of sedimentation rates between dated levels are shown on the left side of the line. Red dots indicate the chronostratigraphical positions of recognized tephra layers. Stratigraphical positions and ages of all chronological markers are detailed in the table below the graph.

Synthetic pollen diagram with taxa groups plotted against depth (for group composition see Table 1). The age is added as a secondary axis. Horizontal dashed black lines indicate the positions and ages of tephra layers connected to known eruptions of Vesuvius volcano. Horizontal dotted red lines indicate the positions and ages of 14C-dated levels. N = Neolithic; E = Eneolithic; EBA = Early Bronze Age; M-LBA = Middle-Late Bronze Age; I = Iron Age; It = Italic period (corresponds to the conventional Greek period as defined in southern Italy); R = Roman period; M = Middle Ages; Mo = Modern Age; LPPI = local pastoral pollen indicators.

Volcanological implications
The widespread occurrence of juvenile clasts from the CI (Campi Flegrei), Pomici di Base, and Mercato (Somma–Vesuvius) eruptions in the basal part of the FSV core sediments is consistent with the distribution of the pyroclastic fall deposits of these eruptions, which are often found as thick primary deposits on the slopes of the mountains bordering the Sarno Plain (see Fig. 7). The age of 5473 cal yr BP, obtained at the base of the FSV sequence, is in good agreement with the occurrence of glasses of the previously mentioned eruptions in the deepest part of the cored sediments. In fact, between 9 and ca. 6 ka both volcanic sources experienced periods of quiescence interrupted by poorly known low-magnitude explosive events (e.g., MA eruptions occurring between Mercato and Avellino events at Somma–Vesuvius; Branca et al., Reference Branca, Cinquegrani, Cioni, Conte, Conticelli, De Astis and de Vita2023, and references therein), the products of which did not reach the Sarno Plain. From about 4.5 ka, which is the age of the Agnano Monte Spina eruption (Campi Flegrei), recurrent Plinian and sub-Plinian activity occurred mainly at Somma–Vesuvius, whose fingerprints helped construct the chronostratigraphy of the FSV sequence.
The positions of both primary and reworked tephra samples in the age-depth graph of Figure 9, falling very close to the segment joining the 14C ages, testifies to the validity of the “first appearance” approach for glass clusters belonging to poly-component tephra, and allows further constraining of the tephra age itself. In fact, the remobilization of the pyroclastic fall deposits, emplaced by the sustained column phase, should have occurred shortly after the eruptive event, with their juvenile fragments being mixed in the lacustrine sediments with other juvenile clasts from previous eruptions. Absence of the respective primary tephra in the cored sequence may be due to the expected much reduced thickness, which makes its identification difficult, especially when it is shortly followed by deposition of remobilized sediments. To corroborate this statement, the isopach maps of the main sustained column deposits of the last 5 ka spread towards the Sarno Plain are shown in Figure 11. The FSV area is somewhat peripheral for most of the explosive events of this time span. For the AP eruptions in particular, the cumulative distribution of the primary phases recognized by Rolandi et al. (Reference Rolandi, Petrosino and McGeehin1998), as reported in Lirer et al. (Reference Lirer, Petrosino, Alberico and Postiglione2001), is shown. Andronico and Cioni (Reference Andronico and Cioni2002) detailed the distribution of the products of the single AP eruptions, from which emerges that the AP2, corresponding to the second protohistoric eruption of Rolandi et al. (Reference Rolandi, Petrosino and McGeehin1998), and AP3, AP4, and AP5 (corresponding to three different phases of the third protohistoric eruption of Rolandi et al., Reference Rolandi, Petrosino and McGeehin1998) emplaced more than 15 cm of pyroclastic fall deposits in the Poggiomarino area, ~2 km closer to the volcano than FSV, in the same dispersal direction. Hence, we can hypothesize that the thickness of primary pyroclastic fall deposits of these eruptions that never exceeded 10 centimeters reached the FSV area.
Isopach maps for pyroclastic fall deposits of the Campi Flegrei and Somma–Vesuvius eruptions emplaced in the last 6 ka in the ESE Sarno Plain and along the reliefs bordering the same sector of the plain. Isopachs of Somma–Vesuvius eruption from Lirer et al. (Reference Lirer, Petrosino, Alberico and Postiglione2001) and isopachs of the Campi Flegrei Agnano Monte Spina eruption from de Vita et al. (Reference de Vita, Orsi, Civetta, Carandente, D'Antonio, Deino and di Cesare1999). Thickness data (in cm) for the isopachs.

In fact, we found the primary tephra of the AP2 eruption (3615 cal yr BP in volcaniclastic layer SV 33.50), the most intense of the AP series, whose distal equivalent has been found on land from Piana di Fondi in Latium to Raganello Basin in Calabria (Sevink et al., Reference Sevink, De Neef, Di Vito, Arienzo, Attema, van Loon, Ullrich, den Haan, Ippolito and Noorda2020). We also clearly identified, among the glasses of volcaniclastic layer SV 31.80, the cluster from the AP4 eruption, for which a precise age is not available in literature. Our data contribute a further clue to the inconsistency of the 2800 cal yr BP age attributed by Rolandi et al. (Reference Rolandi, Petrosino and McGeehin1998) to the initial phase of the third protohistoric eruptive period, as already suggested by Insinga et al. (Reference Insinga, Petrosino, Alberico, de Lange, Lubritto, Molisso, Sacchi, Sulpizio, Wu and Lirer2020) in the light of several findings in marine cores. Moreover, the age of AP4, inferred from our age model at the SV 31.80 sample depth, is not younger than 3100 yr (Fig. 9), because the AP4 glasses make up a cluster in this remobilized tephra layer. This is in good agreement with the conclusion of Vogel et al. (Reference Vogel, Märker, Rellini, Hoelzmann, Wulf, Robinson and Steinhübel2016b), who suggested that the presence of a very weak initial pedogenetic transformation between the AP2 and AP3 tephra deposits at Scafati, near Pompeii, is incongruent with the 500-year time gap hypothesized between these two eruptions.
The Sarno Plain in the Pre-Protohistoric period (ca. 6000–2750 BP)
From the base of the succession up to ~30 m depth, a dense forest cover characterized the landscape around the Fossa San Vito (FSV) lake, as indicated by AP percentages over 80% (Fig. 10). The woods surrounding the lake were mainly composed of evergreen and deciduous oaks. Wood analysis confirms the presence of Q. ilex and allows (at least one of) the deciduous oak species to be attributed to Q. cerris (Fig. 6b and c). The spread of Q. ilex in the area was also attested by anthracological analysis performed on charred frustules recovered from the holes of Early Bronze Age huts found at Foce (Fig. 3a; Marzocchella et al., Reference Marzocchella, Calderoni, Nisbet and Albore Livadie1999). At the nearby Iron Age site of Longola (Fig. 3b), the palisades that embanked the canals mainly consisted of Q. robur and Q. cerris (Albore Livadie and Cicirelli, Reference Albore Livadie and Cicirelli2003).
On the basis of chronological markers, this core interval likely covers the upper Neolithic up to the Iron/Italic Age. The relative stability of the forest cover during this period suggests that the occurrence of major volcanic eruptions, three of which are recorded in the B24 stratigraphy as primary or slightly reworked tephra (Avellino, AP2, and AP4), did not appear to have affected the local vegetation. Figure 11 shows that FSV is located somewhat on the periphery of the isopach maps for these eruptive events, indicating the deposition of very thin pyroclastic fall layers, which were not thick enough to significantly affect the tree cover in the area. Indeed, the slight but clear AP% reduction recorded in conjunction with the Avellino tephra cannot be related to the effects of the eruption but rather to human activities, being coincident with the presence of ruderals and grazing indicators (Fig. 10).
It is notable that Deciduous and Mediterranean forest associations show an opposition throughout the Pre-Protohistoric period (Fig. 10). This contrast suggests a climatic significance, indicating periods of greater aridity during the periods of evergreen oak expansion alternating with periods of greater humidity when this is reduced in favor of deciduous species. The frequent lithologic changes in the core, and consequent variations in sedimentation rates, prevent understanding whether these fluctuations are cyclical, and thus relatable to the Holocene climatic shifts (Bond et al., Reference Bond, Showers, Cheseby, Lotti, Almasi, Demenocal, Priore, Cullen, Hajdas and Bonani1997; Mayewski et al., Reference Mayewski, Rohling, Stager, Karlénd, Maascha, Meekere and Meyersona2004; Kaniewski et al., Reference Kaniewski, Marriner, Cheddadi, Guiot and Van Campo2018; Di Rita and Magri, Reference Di Rita and Magri2019).
Recognition of climate-driven vegetation oscillations is not always easy in continental records that are more affected by local environmental conditions and/or the effects of anthropogenic activities. In this case, the geographic position of the FSV lake and the scant presence of anthropogenic indicators (except for some coprophilous fungi that are excluded from the base sum) in the pollen spectra of the Pre-Protohistoric period made it possible to record natural variations in vegetation. In fact, the lake position at ~45 m asl, at the base of steep slopes reaching 800 m asl, allowed pollen from different vegetation belts to reach and be deposited into the basin. The pollen source area can be identified in a quite restricted but diversified geographic area, including the plain to the WSW of the sinkhole and the lower alluvial slopes up to the plateaus towards the NE. After the Pre-Protohistoric period, the stronger human effect on vegetation prevents any climatic influence to be identified.
The scattered occurrence of anthropogenic indicators suggests a limited presence of settlements or anthropogenic activities near the FSV lake during most of the Pre-Protohistoric interval, except in the period straddling the Avellino eruption (Fig. 10). It is important to point out that archaeological evidence from the Neolithic to the Bronze Age in this area is limited to a few archaeological excavations (Fig. 3a; Table 1SM), which do not provide an extensive territorial settlement picture. In this regard, pollen data acquire even greater value because they can provide indication of land use even for periods that are poorly represented in the archaeological record. The scarcity of archaeological data in this period is also related to the burial of ancient soils by significant thicknesses of primary and reworked volcanic material (Di Vito et al., Reference Di Vito, Calcaterra, Petrosino, Zanchetta, de Vita, Marotta, Cesarano, De Simone, Sansivero and Rucco2019a). For example, major flood events occurred in a large area of the Campania Plain following the main Vesuvius eruptions (Di Vito et al., Reference Di Vito, Calcaterra, Petrosino, Zanchetta, de Vita, Marotta, Cesarano, De Simone, Sansivero and Rucco2019a, Reference Di Vito, Talamo, de Vita, Rucco, Zanchetta and Cesaranob, Reference Di Vito, Rucco, de Vita, Doronzo, Bisson, Vitturi and Rosi2024) and strongly influenced the subsequent repopulation (Di Vito et al., Reference Di Vito, Castaldo, de Vita, Bishop and Vecchio2013). This particular condition makes it difficult to reach prehistoric levels except by deep investigation. Even the stratigraphic sequence of the B24 core shows frequent arrivals of coarse volcanic material that are important chronostratigraphic markers, essential for the correlation between paleoenvironmental and archaeological data. In particular, the recognition of Avellino (slightly reworked), AP2 (primary), and AP4 (slightly reworked) tephra layers allowed precise attributions of the Bronze Age periods (Middle Bronze Age 1–2 between Avellino and AP2; Middle Bronze Age 3 and Late Bronze Age between AP2 and AP4).
Between 5473 and 3870 cal yr BP, anthropogenic activities are evinced by the occurrence of grazing indicators (coprophilous fungi and local pastoral pollen indicators [LPPI]) associated with cereals, ruderal taxa, and fires (Fig. 10). This time interval covers the Eneolithic and part of the Early Bronze Age, for which the archaeological evidence, although scarce, indicates that the area was frequented. In conjunction with the Avellino tephra layer, a peak of microcharcoals indicates the occurrence of fires, most probably related to anthropogenic activities rather than to the effects of the eruption, as expected in a distal area that was not reached by ballistic ejecta and where only a very reduced thickness of pyroclastic fall deposit was emplaced (Fig. 11). In fact, the concomitant reduction in AP% is due to the decline of the Mediterranean forest that must have been present in the vicinity of the lake, where the anthropogenic activities probably developed. The presence of an Early Bronze Age (EBA) stable settlement at Foce (Fig. 3a) is documented by the discovery of structures for either sheltering animals or foodstuffs (Marzocchella, Reference Marzocchella, Tazieff and Vallet1986, Reference Marzocchella1994; Marzocchella et al., Reference Marzocchella, Calderoni, Nisbet and Albore Livadie1999), whereas no archaeological evidence of Middle Bronze Age (MBA) 1–2 has been reported so far in the area. This could be linked to the previously mentioned burial of ancient soils even if a socio-environmental derangement linked to the eruptions was not excluded (Di Lorenzo et al., Reference Di Lorenzo, Di Vito, Talamo, Bishop, Castaldo, de Vita, Nave, Pacciarelli, Meller, Bertemes, Bork and Risch2013).
The widespread re-occupation of the Campania territory after the Avellino eruption only started from the MBA3, as indicated by archaeological evidence (Di Lorenzo et al., Reference Di Lorenzo, Di Vito, Talamo, Bishop, Castaldo, de Vita, Nave, Pacciarelli, Meller, Bertemes, Bork and Risch2013). With regard to the Sarno Plain, human presence is indicated in this period at Longola and San Giovanni (Fig. 3a). Since pollen data suggest scant anthropogenic activities in the FSV lake surroundings between the Avellino and AP4 eruptions, it is possible that such activities were taking place in more distant areas, outside the FSV pollen source area. The same can be said for the Iron Age, when the Sarno Plain was very often frequented, as indicated by necropolises and the well-known settlement of Longola (Fig. 3b), but anthropogenic indicators are very few and not very significant in the FSV record after the AP4 eruption (Fig. 10).
During most of the Pre-Protohistoric period, Vitis is continuously present in the B24 core with percentages above 2% (Fig. 10). The wild variety of Vitis, a natural component of the floodplain forest undergrowth, was certainly present since the beginning of the Holocene in the wetlands of the alluvial–coastal plains of southern Italy (Russo Ermolli et al., Reference Russo Ermolli, Di Pasquale, Di Pasquale, Pellegrino and Rossi2011). Evidence of the earliest form of cultivation in Campania occurs in the Pertosa Cave (Vallo di Diano) during the M/LBA as a large quantity of Vitis vinifera seeds (Breglia et al., Reference Breglia, Sellitto, Larocca, Minelli and Fiorentino2019). In the Sarno Plain, its constant presence from ca. 6000 up to ca. 3100 BP (late Neolithic to the end of the Bronze Age) near the banks of the FSV sinkhole is probably related to the wetness condition of the pond that favored the growth of the wild species. Regardless of these pollen results, however, grape cultivation and pressing for wine production has been proven with certainty to have existed at the Longola site in the Iron Age (Celant, Reference Celant, Cicirelli and Albore Livadie2011; Delle Donne, Reference Delle Donne, Cicirelli and Albore Livadie2011).
The scattered presence of cereal pollen throughout the Pre-Protohistoric period (Fig. 10) indicates that the area around the FSV lake, as well as the entire Sarno Plain, was also exploited for grain cultivation. This was also evinced by the recovery of cereal pollen and seeds of Triticum dicoccum Schübl and Hordeum vulgare L. in the Iron Age levels of Longola (Celant, Reference Celant, Cicirelli and Albore Livadie2011; Delle Donne, Reference Delle Donne, Cicirelli and Albore Livadie2011; Di Maio et al., Reference Di Maio, Balassone, Bellini, Boni, Ciampo, Ciattini, Di Donato, Cicirelli and Albore Livadie2011).
The onset of severe anthropogenic effects
Starting from ~30 m depth, pollen data show a sudden increase in anthropogenic indicators associated with a similarly rapid decline in forest cover, which reaches its lowest level in relation to the Pompeii eruption (Fig. 10). This long time interval, between AP4 (ca. 3100 BP) and CE 79, is characterized by a volcanic quiescence, possibly interrupted only by the low-intensity AP6 eruption, which did not affect the Sarno Plain. This certainly favored intensive exploitation of the plain and the emergence of major urban centers, such as Pompeii, Nuceria, and Stabiae (e.g., Ruffo, Reference Ruffo2012). In fact, during this period there is a succession of different cultural processes, including the Samnitization of the fourth century BCE and the Roman advance, from the third century BCE onward (Seth et al., Reference Seth, McConnell, Di Rita, Michelangeli, Magri, Sadori and Masi2023). In this dynamic cultural context, the major cities of the plain cannot be considered in isolation from their hinterland in which they were geographically, politically, and culturally embedded and to which they were economically dependent (Seiler, Reference Seiler, Guzzo and Guidobaldi2008). In fact, the presence of necropolises, monumental buildings (theatre, extra-urban sanctuary), and important infrastructure, such as the Serino aqueduct and the via Popilia, testify to the cultural and economic vitality of the entire plain, whose management was probably divided among the major cities (Vogel et al., Reference Vogel, Esposito, Seiler and Märker2012). Further evidence of the economic importance of the Sarno Plain is the presence of 140 villae rusticae (farms), devoted to agricultural production, which was of vital importance for the economy of the entire region (Seiler et al., Reference Seiler, Märker, Kastenmeier, Vogel, Esposito, Heussner, Boni, Balassone, Di Maio, Joachimski, Bork, Meller and Gerlach2011; Vogel et al., Reference Vogel, Esposito, Seiler and Märker2012, Reference Vogel, Märker, Esposito and Seiler2016a). Added to this are the traces of agrarian subdivision of the land, found even around the FSV site (Soricelli, Reference Soricelli and Franciosi2002; Ruffo, Reference Ruffo2012), which are also mentioned in historical sources (e.g., Liber Coloniarum).
In addition to deforestation, human activities in the open surroundings of FSV were mainly devoted to grazing and secondly to cereal crops. The large amounts of fire indicators, recorded in the B24 core all through this period, may be ascribed partly to slash and burn practices. The strong reduction in AP affected both Mediterranean and deciduous associations, suggesting that intensive deforestation occurred not only in the area closer to the FSV, but also on the higher slopes. This wood exploitation was certainly linked to the high demand for timber for the construction of buildings and infrastructure. In addition, the need of quarries for the extraction of stone materials can be a further cause of deforestation involving the deciduous species growing on the calcareous Sarno slopes.
The local character of this deforestation phase can be deduced from its absence in the regional pollen records of southern Italy where intensive widespread deforestation is only recorded from the Late Roman–Medieval period (Di Donato et al., Reference Di Donato, Esposito, Russo-Ermolli, Scarano and Cheddadi2008; Di Rita et al., Reference Di Rita, Lirer, Bonomo, Cascella, Ferraro, Florindo and Insinga2018; Di Lorenzo et al., Reference Di Lorenzo, Aucelli, Corrado, De Iorio, Schiattarella and Russo Ermolli2021, Reference Di Lorenzo, Di Donato, Molisso, Lubritto and Russo Ermolli2023).
After the Pompeii eruption
Soon after CE 79, pollen data indicate a rapid recovery of the forest cover (both Deciduous and Mediterranean associations) in the surroundings of the FSV lake and an almost total absence of anthropogenic indicators (Fig. 10). The archaeological evidence of the post-eruption period in the upper Sarno valley is scarce, confirming what emerges from pollen data.
This evidence indicates that the Pompeii eruption had a major effect on the entire Sarno Plain, regardless of the thicknesses of pyroclastic fall deposits that reached the different sectors (Fig. 11). In addition, most of the southwestern part of the plain was also reached by pyroclastic flows (e.g., Doronzo et al., Reference Doronzo, Di Vito, Arienzo, Bini, Calusi, Cerminara and Corradini2022, and references therein), whose destructive power was decidedly higher with respect to pyroclastic fall, and could have resulted in a wide range of impacts, destruction, and loss of life. This means that the eruption directly affected the main economic centers of the plain by radiating its indirect effect throughout the territory they managed. This was also affected by the development of marshy areas following the irreversible damage to the plain irrigation system (Visone, Reference Visone2004).
The phase of abandonment is followed by the progressive resumption of human activities, which is evinced by the increase of crops and grazing indicators coupled with a new and progressive decline of the evergreen oak curve (Fig. 10). This change indicates that economic recovery of the area occurred from the end of the second century CE, when the new agrarian subdivision of the plain is also dated (Soricelli, Reference Soricelli1997).
From this time, a change in land use is evident. Land was no longer exclusively devoted to grazing and grain cultivation but shows the development of all tree crops (Olea, Castanea, Juglans, and Vitis) and the appearance of the cultivation of Brassicaceae. It has already been demonstrated that cabbage cultivation was widespread in Roman times (Cilliers and Retief, Reference Cilliers and Retief2009), as stated by Pliny the Elder (NH 19, 139–141) and Columella (RR 10, 135). The role of cabbages in the vegetable production of Campania is extensively testified by pollen data at least since the first century BCE (Russo Ermolli et al., Reference Russo Ermolli, Romano, Ruello and Barone Lumaga2014; Vignola et al., Reference Vignola, Bonetto, Furlan, Mazza, Nicosia, Russo Ermolli and Sadori2022).
The cultivation of Juglans and Castanea in Campania is indicated since the Roman period. At Pontecagnano, intensive walnut crops are suggested by pollen data since the third century BCE (Russo Ermolli et al., Reference Russo Ermolli, Di Pasquale, Di Pasquale, Pellegrino and Rossi2011). At Neapolis, walnut and chestnut cultivation is recorded since the first century BCE (Russo Ermolli et al., Reference Russo Ermolli, Romano, Ruello and Barone Lumaga2014), while in the Gulf of Gaeta and in Lake Averno since the first century CE (Grüger and Thulin, Reference Grüger and Thulin1998; Di Rita et al., Reference Di Rita, Lirer, Bonomo, Cascella, Ferraro, Florindo and Insinga2018).
In the Late Roman Period (after 1540 BP) the practice of grazing recovered and, together with the tree crops, it continued all through the Middle Ages, without interruptions. Not even the Pollena eruption (CE 472) seems to have destabilized the agrarian system and the exploitation of the Sarno Plain, as also confirmed by the archaeological evidence. The reduced effects of this eruption, with respect to the CE 79 event, is probably related to the different dispersal and thickness of the volcanic products (Fig. 11), which did not deeply affect the main economic centers of the plain (De Simone et al., Reference De Simone, Perrotta and Scarpati2011).
The intensive Castanea cultivation, recorded in the B24 core at ~18 m depth (around 1000 BP; Fig. 10), can be ascribed with a good degree of certainty to the direct control of the Abbey of Cava de’ Tirreni. In fact, as quoted in Codice Diplomatico Cavense (cfr §2.3), this Abbey managed a wide territory, intensively cultivated with vineyards, orchards, cereals, legumes, oaks, and chestnuts. The same literary source mentions the distinction between the chestnut groves (castanietum), used for firewood, and the intentionally grafted chestnuts (insertetum), which produced a greater quantity and better quality of edible fruits (Vitolo, Reference Vitolo1989; Squatriti, Reference Squatriti and Squatriti2013). Afterwards, chestnut groves declined in favor of vineyards and cereal crops; walnut cultivation also shows a recovery. It is worth noting that the increase in Vitis is coincident with the growth of Ulmus (Fig. 5), suggesting a practice of viticulture with the support of elms, reported also by Passigli (Reference Passigli, Cortonesi and Giammaria1999) in the Pontine plain during the medieval period. Iannelli (Reference Iannelli1994) reported the presence of olive trees near Villa Venere in the Late Middle Ages.
The FSV lake evolution
After its formation at ca. 6000 cal. yr BP, the FSV lake was filled during periods of quiet laminated sedimentation alternating with deposits of coarse alluvial debris, coming from the adjacent slopes, and primary and reworked pyroclastic fall material. The natural reduction in the width and depth of the lake underwent an acceleration from 23.5 m depth (ca. 1500 BP), when average sedimentation rates increased from 5 to 12 m/ka (Fig. 9). This appears to be related to increased alluvial fan activity following the arrival of the Pollena eruption (CE 472) pyroclastic fall products (Di Vito et al., Reference Di Vito, Calcaterra, Petrosino, Zanchetta, de Vita, Marotta, Cesarano, De Simone, Sansivero and Rucco2019a, Reference Di Vito, Rucco, de Vita, Doronzo, Bisson, Vitturi and Rosi2024), whose traces in the core are recorded at 22.20 m depth.
The change in the lake size is also clearly inferred from pollen data, showing an increase in marsh plants and wet woodland taxa starting from the same core depth. In particular, the rise in Myriophyllum indicates that the lakeshores are approaching the pollen site while the concomitant expansion of Filinia longiseta (Fig. 6a) is a sign of reduced water depth and consequent reduced oxygenation. This rotifer can provide further environmental indications, being found in higher abundance in water bodies located within areas of intensive land use (Sudzuki et al., Reference Sudzuki, Watanabe, Suzuki and Narita1983) and developing most abundant communities at a temperature between 23°C and 31°C (Dumont, Reference Dumont1995). Contraction of the water body also allowed development of alder woods on the wet soils, closer to the pollen site. Furthermore, the presence of the Santa Apollonia church (fifth to ninth century CE) inside the sinkhole suggests that the lake was much reduced in size or even dried in early medieval times (Guarino and Nisio, Reference Guarino and Nisio2010). Indeed, final closure of the lake is recorded in the pollen sequence at a depth of 10.80 meters, which corresponds to ca. CE 500 (Fig. 10). The last part of the infilling, exclusively made up of coarse material rich in pumice fragments (Fig. 4), was probably deposited in subaerial conditions. Within this core interval, the last primary tephra layer, corresponding to the CE 1631 Vesuvius eruption, is recorded at 9.50 m depth (Fig. 7).
CONCLUSIONS
This study provides the first well-dated long history of environmental and land-use changes in the Sarno Plain, an area that has witnessed the birth and development of important cultural centers, such as the Iron Age site of Longola and the Roman towns of Pompeii and Stabiae, buried by the catastrophic Vesuvius eruption of CE 79.
The recovery of a lacustrine succession covering the last 6000 years at the foot-slope of the Sarno Mts. gave us the exceptional opportunity to provide a valuable pollen record for the Campania region. The integrated use of 14C ages and tephrostratigraphy for the construction of a robust chronology had the advantage of crosschecking between the two datasets.
We demonstrated that most of the reworked volcaniclastic layers were emplaced soon after the eruptive events and thus their “first appearance” in the sedimentary record could be used as a chronological marker. This approach allowed us to assign an age of ca. 3100 cal yr BP to the protohistoric eruption AP4, hitherto poorly dated as younger than 2800 cal yr BP.
Interesting climatic interference was highlighted in the Pre-Protohistoric period, before strong anthropogenic effects, through the opposed oscillations of the deciduous and Mediterranean associations, marking periods of higher and lower humidity.
The chronology allowed identification of human activities in the different cultural periods, demonstrating the long-standing resilience of the populations that have inhabited this territory, which also interacted with the occurrence of numerous volcanic, even catastrophic, events. In-depth archaeological and historical knowledge has been essential to attributing variations in land use to a particular cultural facies and thus determining their major activities in the spatial setting. Pre-Protohistoric communities were mainly devoted to animal breeding and grain cultivation. Starting from the Roman period, extensive tree crops were added to these, with chestnut groves becoming the main crop of the medieval period.
Despite that the upper Sarno Plain was only reached by reduced thickness of pyroclastic fall deposits, it was indirectly influenced by the major eruptions that affected the southwestern sector of the plain, where the main economic centers developed both in Protohistoric and Roman times. In fact, our results show that, as expected, a thickness of pyroclastic fall tephra on the order of 10 cm did not affect either the tree cover or human activities in any significant way. On the other hand, the total destruction of the built environment and of social links, due to the large number of victims in the main towns during the CE 79 eruption, also had a profound effect outside the area directly affected by the lethal pyroclastic currents. This result can provide useful information for defining the limits of the area that could be exposed to the indirect effects of a possible future eruption.
Supplementary material
The supplementary material for this article can be found at https://doi.org/10.1017/qua.2024.30.
Acknowledgments
We thank two anonymous reviewers and the Editors for their careful reading of our manuscript and their many insightful comments and suggestions. The tephrostratigraphic analysis was financially supported by the National Recovery and Resilience Plan (NRRP), Mission 4, Component 2, Investment 1.3 - Project RETURN – CUP E63C22002000002.



