1. INTRODUCTION
Receiver Autonomous Integrity Monitoring (RAIM) was proposed to provide a navigation solution with guaranteed integrity using methods of consistency checking among measurements within a Global Positioning System (GPS) receiver (Brown, Reference Brown1992; Lee, Reference Lee1986). Its functions include the calculation of protection level and fault detection (Wang and Ober, Reference Wang and Ober2009). The purpose is to produce an upper bound that is not exceeded with given risks. The protection level is compared with an alert limit to decide the availability so that users are aware of any hazardous situation when no alarm is generated but the position error is larger than allowed. With the advent of next-generation Global Navigation Satellite Systems (GNSS) and augmentation systems, A-RAIM, a new integrity monitoring architecture, is under study where the burden of integrity monitoring among space-based and ground-based augmentation systems and aircraft receivers is adjusted. The purpose is to provide the Localiser with the Vertical Guidance-200 (LPV-200) service worldwide through to 2020 (GEAS, 2008; 2010). Two current methods that can be adopted for calculation of VPL in A-RAIM were studied and compared by Jiang and Wang (Reference Jiang and Wang2014). VPL is then compared with Vertical Alarm Limit (VAL) as one of the conditions to decide service availability. However, the application of other methods to calculate VPL for this framework is very limited. Efforts are made in this study to integrate all popular methods in this framework with the focus to propose a new approach to improve A-RAIM availability.
When calculating the VPL with the conventional algorithms, there are mainly three options: the classic method (Brown and Chin, Reference Brown and Chin1998), the method in Walter and Enge (Reference Walter and Enge1995) and the solution separation method (Brenner, Reference Brenner1996). There are also different ways to fix the size of the unknown bias for calculation of VPL (Ober, Reference Ober2003): Minimal Detectable Bias (MDB), Minimal Hazardous Bias (MHB) and Worst Case Bias (WCB). The MDB is used in the classic method. The WCB has been used to derive the ideal VPL with the exact value of VPL satisfying the required integrity risk (Milner and Ochieng, Reference Milner and Ochieng2011), which is also applied in A-RAIM (Milner and Ochieng, Reference Milner and Ochieng2010). The WCB that produces the maximum integrity risk is searched within the range of MHB and MDB. However, to ensure the maximum integrity risk value is the same as the given one, the input VPL also needs to be searched. With two search loops, the calculation is complex and the accuracy is not guaranteed. A new procedure to calculate the exact VPL value is presented to overcome this problem with the following procedure. First, the search range is defined in the domain of Type II error, which has a one-to-one relationship with the bias size with a given Type I error. Then the VPL corresponding to each Type II error in the search domain is calculated. The maximum VPL is the result that is able to protect the user against all possible bias. Also, an optimisation algorithm is adopted to reduced the computational time.
All the methods to calculate VPL are incorporated in the A-RAIM structure, where the multiple hypothesis structure in the Multiple Hypothesis Solution Separation (MHSS) method (Pervan et al., Reference Pervan, Pullen and Christie1998; Blanch et al., Reference Blanch, Ene, Walter and Enge2007; Reference Blanch, Walter and Enge2010) is an essential part. The advantages of the multiple hypothesis structure include a) the ability to accommodate a complete set of failure modes; b) the flexibility of risk allocation onto each hypothesis; c) flexibility to define the prior probability of any fault mode according to the environment.
The structure of this paper is as follows. In Section 2, the basic model is given and followed by the solution separation statistic used in A-RAIM. The equivalence of this statistic with other fault detection statistics is obtained. The allocation of integrity risk and continuity risk for A-RAIM is shown in Section 3. In Section 4, three different methods for the calculation of VPL are provided. The design process of the new approach to calculate the ideal VPL is described in Section 5. A numerical example to illustrate the mechanism is shown in Section 6. Under a given error model, the risk definition and constellation and the A-RAIM performances are provided in Section 7.
2. SYSTEM MODELS AND TEST STATISTICS
The mathematical and stochastic models to relate measurements to the position solution after linearization are
 $${\rm E(y) = Ax; \ D(y) = Q_y = P^{ - 1} }$$
where y∈Rn×1 is the measurement vector, x∈Rn×1 is the unknown position vector, A∈Rm×n is the design matrix with rank n and Qy∈Rm×m is the positive definite covariance matrix of the measurements.
The vertical position estimation  ${\rm \hat x_v} $ is,
 $${\rm \hat x_v = e_v^T (A^T PA)^{ - 1} A^T Py}$$
where ev∈Rn×1 is a zero vector with the third element as one.
The vertical position error is the difference between  ${\rm \hat x_v} $ and the true vertical position xv,
 $${\rm \nabla x_v = \hat x_v - x_v} $$
The test statistic used in A-RAIM is the solution separation (GEAS, 2010). The subset vertical position estimation  ${\rm \hat x_{vi}} $ is the weighted least squares estimation with the ith measurement removed. The solution separation is
 ${\rm \hat x_v - \hat x_{vi} }$. The standardized solution separation is used as the test statistic for failure mode i,
 $${\rm t_i = \displaystyle{{\hat x_v - \hat x_{vi}} \over {\sigma _{ss,i}}} }$$
where σss,i is the standard deviation of the solution separation and 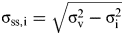 ${\rm \sigma _{ss,i} = \sqrt {{\rm \sigma} _{\rm v}^2 - {\rm \sigma} _{\rm i}^2}} $ without correlation among measurements (Blanch et al., Reference Blanch, Walter and Enge2010) with σ v as the standard deviation of the vertical position error ∇xv and σi as the standard deviation of the vertical subset solution error
 ${\rm \nabla x_{vi} = \hat x_{vi} - x_v }$.
The relationship between the solution separation statistic and other test statistics is not clearly defined (Young and McGraw, Reference Young and McGraw2003). It is shown below that the equivalence exists without correlation. Assuming there is an unknown bias in the measurements,  ${\rm \hat x_{vi}} $ was proved to be equivalent with the unbiased vertical position estimation (Diggelen and Brown, Reference Diggelen and Brown1994). Therefore it can be concluded that the test statistic in Equation (4) is equivalent with the “maximum residual” (Kelly, Reference Kelly1998) and the one in the data-snooping method (Baarda, Reference Baarda1967) when all the measurements are uncorrelated, which is the case for GNSS A-RAIM.
Also, the slope parameter Vslopei in the classic method (Brown and Chin, Reference Brown and Chin1998), which is also defined as the project matrix from the test statistic domain to the position domain, was proved to be equivalent with σss,i (Blanch et al., Reference Blanch, Walter and Enge2010),
 $${\rm Vslope_i = \displaystyle{{|e_v^T (A^T PA)^{ - 1} A^T Pe_i |} \over {\sqrt {e_i^T (P - PA(A^T PA)^{ - 1} A^T P)e_i}}} = \sigma _{ss,i}} $$
where ei∈Rm×1 is a zero vector with the ith element as one.
3. ALLOCATION OF INTEGRITY RISK AND CONTINUITY RISK AMONG FAILURE MODES
In A-RAIM, the integrity risk and continuity risk are defined to calculate VPLs. The integrity risk is the probability of the navigation system failing to protect against the hazardous situation within the Time-To-Alert (TTA), which is caused by faults producing undetected navigation errors greater than a VAL (GEAS, 2008; 2010). The total integrity risk IR is divided into the horizontal IRh and vertical IRv. Within the context of A-RAIM and LPV-200, the vertical integrity risk is then divided onto each failure mode. The vertical integrity risk under failure mode i IRi is defined as (GEAS, 2008),
 $${\rm IR}_{\rm i} = {\rm P}\{ |\nabla x_v | \gt {\rm VPL}\mathop \cap \nolimits |{\rm t}_{\rm i} | \lt {\rm T}_{\rm i} |{\rm H}_{\rm i} {\rm \;} \} {\rm P}_{{\rm H}_{\rm i}} $$
where  ${\rm P}_{{\rm H}_{\rm i}} $ is the prior probability of the failure mode i Hi. Ti is the threshold to be compared with the test statistic.
Without correlation among the multivariate normal distribution of the position error and test statistic, the independence of these two is concluded (Ober, Reference Ober2003; Milner and Ochieng, Reference Milner and Ochieng2010). Therefore, Equation (6) can be expressed as,
 $${\rm IR}_{\rm i} = {\rm P}\{ |\nabla x_v | \gt VPL|{\rm H}_{\rm i} \} {\rm P}\{ |{\rm t}_{\rm i} | \lt {\rm T}_{\rm i} |{\rm H}_{\rm i} {\rm \;} \} {\rm P}_{{\rm H}_{\rm i}} $$
Under failure mode i, the fault free hypothesis Hi0 is tested against the hypothesis Hia for the case of a faulty measurement. The corresponding integrity risk for the hypotheses are IRi0 and IRia. There are two types of test errors: probability of missed detection (PMD) and probability of false alarm (PFA). In A-RAIM, PMD is not a given parameter and the PMD under the faulty mode i is,
 $${\rm P}_{{\rm MDi}} = {\rm P}\{ |{\rm t}_{\rm i} | \lt {\rm T}_{\rm i} |{\rm H}_{{\rm ia}} {\rm \;} \} $$
The continuity risk is defined as the probability of continuity break per 15 s for the duration of aircraft approach (GEAS, 2008). The PFA can be obtained from the fault free continuity risk in A-RAIM (GEAS, 2008),
 $${\rm P}_{{\rm FAi}} = {\rm P}\{ |{\rm t}_{\rm i} | \gt {\rm T}_{\rm i} {\rm |H}_{{\rm i}0} \} $$
4. THREE METHODS TO CALCULATE VPLS FOR A-RAIM
There is no unknown bias in both position error and the test statistic under fault free modes. With PFA given in A-RAIM, Equation (9) is applied in Equation (7). The fault free VPL under Hi0 is,
 $${\rm VPL}_{{\rm i}0} = {\rm K}\left[ {1 - \displaystyle{{{\rm IR}_{{\rm i}0}} \over {2{\rm P}_{{\rm H}_{{\rm i}0}} (1 - {\rm P}_{{\rm FAi}} )}}} \right]{\rm \sigma} _{\rm v} $$
where K[ ] is the inverse of the cumulative distribution function of a Gaussian random variable with zero mean and unit variance. In current methods, 1−PFAi is assumed to be one under the fault free mode.
Under the faulty mode, there is an unknown bias in both position error and test statistic, and the PMD under the faulty mode is not given. Therefore, the straightforward derivation of VPL is impossible. Beside the ideal VPL (VPLMO) (Milner and Ochieng, Reference Milner and Ochieng2010) which aims to derive the exact solution, there are other algorithms used to obtain conservative VPLs with higher efficiency of computation, where the conservative VPL is able to guarantee a lower than given integrity risk. Three current algorithms adapted in the A-RAIM framework are listed below.
In Brown and Chin (Reference Brown and Chin1998), the bias is fixed with a given PFA and integrity risk and the noise is bounded by another term (Angus, Reference Angus2007). Therefore, the VPLBC under each single hypothesis is
 $${\rm VPL}_{{\rm BCi}} = {\rm \delta} _{\rm i} \cdot {\rm Vslope_i }+ {\rm K}\left( {1 - \displaystyle{{{\rm IR}_{{\rm ia}}} \over {2{\rm P}_{{\rm H}_{{\rm ia}}}}}} \right){\rm \sigma} _{\rm v} $$
Instead of the bias, the threshold is projected into the position domain in Walter and Enge (Reference Walter and Enge1995) which generates a smaller VPL (VPLWE) than the one in Equation (11),
 $${\rm VPL}_{{\rm WEi}} = {\rm K}\left( {1 - \displaystyle{{{\rm P}_{{\rm FAi}}} \over 2}} \right){\rm Vslope_i} + {\rm K}\left( {1 - \displaystyle{{{\rm IR}_{{\rm ia}}} \over {2{\rm P}_{{\rm H}_{{\rm ia}}}}}} \right){\rm \sigma} _{\rm v} $$
The total position error is separated into the solution separation and the subset position error without the necessity of projecting from the test statistic domain in Pervan et al. (Reference Pervan, Pullen and Christie1998); Blanch et al. (Reference Blanch, Walter and Enge2010). And the VPLPB under each single hypothesis is,
 $${\rm VPL}_{{\rm PBi}} = {\rm K}\left( {1 - \displaystyle{{{\rm P}_{{\rm FAi}}} \over 2}} \right){\rm \sigma} _{{\rm ss},{\rm i}} + {\rm K}\left( {1 - \displaystyle{{{\rm IR}_{{\rm ia}}} \over {2{\rm P}_{{\rm H}_{{\rm ia}}}}}} \right){\rm \sigma} _{\rm i} $$
These three different methods to calculate VPL are shown in Figure 1.
Three VPL Calculation Mechanisms.

5. THE NEW APPROACH TO CALCULATE THE VPL IN A-RAIM
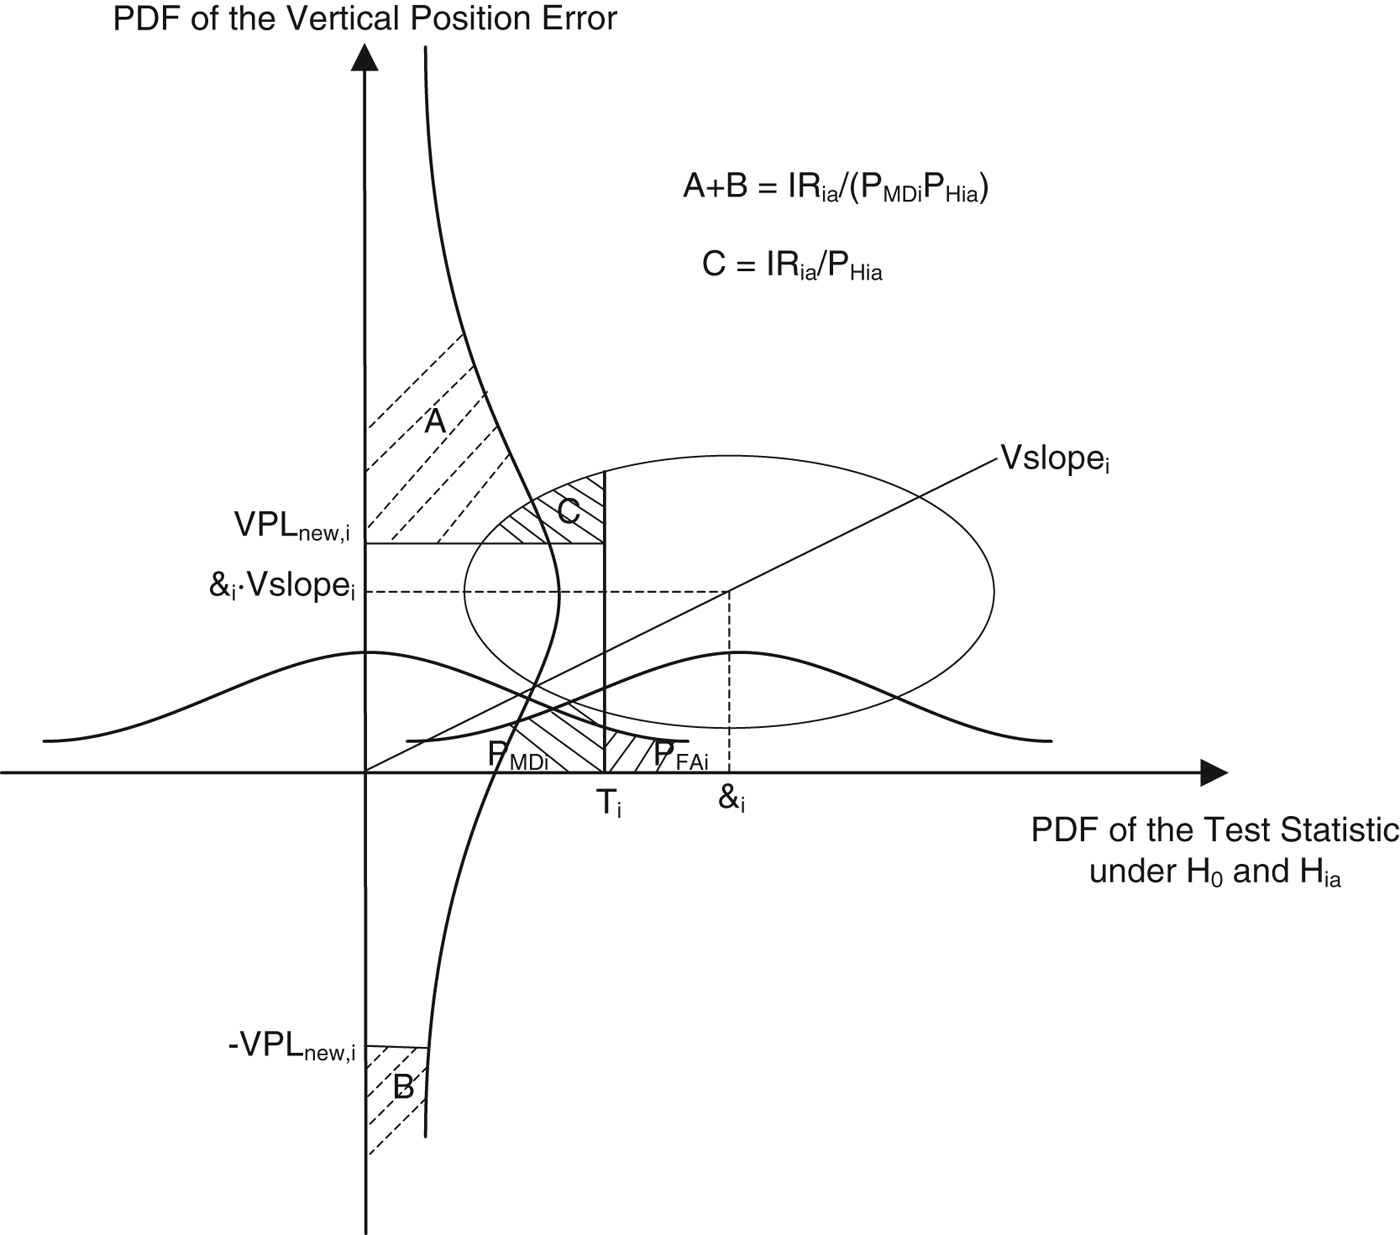
The exact VPL value that is able to protect the user against all possible bias, with a given integrity risk value, is illustrated in Figure 2. What is worth noting here is the different PMD in VPLBC and the exact VPL, where the first one has a fixed value as derived by the given integrity risk  ${\textstyle{{{\rm IR}_{{\rm ia}}} / {{\rm P}_{{\rm H}_{{\rm ia}}}}}} $, whereas the latter one needs to be searched for. A procedure was designed to calculate the ideal VPL in Milner and Ochieng (Reference Milner and Ochieng2010). In this section, the problems in the ideal VPL method are described, followed by the design process of the new procedure.
Illustration of the exact VPL.
5.1. The Design Process
Since VPL and bias size are unknown under the faulty case in Equation (7), it is impossible to get a unique solution without a search of the worst case bias. The calculation of VPLMO in Milner and Ochieng (Reference Milner and Ochieng2011) is designed with a worst case search: the WCB with maximized integrity risk is searched within the range of MHB and MDB. The ideal VPL that matches the exact required integrity risk is then calculated with the WCB. MHB is derived with  ${\rm P}\{ |\nabla x_v | \gt VPL|{\rm H}_{{\rm ia}} \} = {\textstyle{{{\rm IR}_{{\rm ia}}} / {{\rm P}_{{\rm H}_{{\rm ia}}}}}} $ with an arbitrary VPL input. MDB is derived with
 ${\rm P\{} |{\rm t}_{\rm i} | \lt {\rm T}_{\rm i} {\rm |H}_{{\rm ia}} {\rm \}} = {\textstyle{{{\rm IR}_{{\rm ia}}} / {{\rm P}_{{\rm H}_{{\rm ia}}}}}} $. This procedure induces a problem: the correct WCB relies on correct choice of the input VPL used to derive MHB. If not, the resulting VPL does not correspond to the given integrity risk, causing safety outages. To avoid this and obtain the right VPL value with the given integrity risk, another search loop within a VPL range is added. Thus, the computation process becomes complex, and several conditions are designed to simplify the procedure.
An example in Figure 3 is used to show the situation when the input VPL is not properly chosen. The black horizontal line represents the given integrity risk which was used to derive the MHB and MDB. The integrity risk on the vertical axis in Equation (7) is calculated with the bias on the horizontal axis and the VPLMO derived by the correct VPL input (red line) and the wrong VPL input (green line).
An Example of the wrong input VPL in VPLMO.
It is validated in Figure 3 with the red line that the maximum integrity risk within the bias range does correspond with the given integrity risk with the condition of a correct VPL input. Also the green line is an example when the given integrity risk is used to derive MHB and MDB, but with the wrong VPL input, the derived VPLMO resulted in an integrity risk which is larger than the given one. Therefore another search loop of VPL is needed in this method.
To overcome this limitation, the following new procedure is proposed. Firstly, PMD and the bias have a one-to-one relationship with the bias derived by PMD and PFA in Equations (8) and (9). When PMD is larger, the bias is smaller. Therefore, the search boundary is defined in the PMD domain to accommodate all possible bias size by using all possible PMD values. The boundary of the PMD values for the bias/fault in the ith measurement is defined as follows,
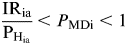 $$\displaystyle{{{\rm IR}_{{\rm ia}}} \over {{\rm P}_{{\rm H}_{{\rm ia}}}}} \lt P_{{\rm MDi}} \lt 1$$
where the left side of the boundary is derived as
 $${\rm P}_{{\rm MDi}} = {\displaystyle{{{\rm IR}_{{\rm ia}} /{\rm P}_{{\rm H}_{{\rm ia}}}} \over {{\rm P}\{ |\nabla x_v | \gt VPL|{\rm H}_{{\rm ia}} \}}}} \gt {\textstyle{{\rm IR_{ia}} \over {\rm P_{H_{ia}}}}} . $$
This is based on the fact that with Equation (7), 0<P{|∇x v|>VPL|Hia}<1, and at the same time,  ${\textstyle{{{\rm IR}_{{\rm ia}}} / {{\rm P}_{{\rm H}_{{\rm ia}}}}}} $ is constant when the integrity risk to the fault in the ith measurement is allocated.
Based on Equation (14), the bias should satisfy
 $$\delta _i \lt {\rm K}\left( {1 - \displaystyle{{{\rm P}_{{\rm FAi}}} \over 2}} \right) + {\rm K}\left( {1 - \displaystyle{{{\rm IR}_{{\rm ia}}} \over {{\rm P}_{{\rm H}_{{\rm ia}}}}}} \right)$$
The relationship between the PMD and VPL with a given integrity risk is shown in Figure 4, and the relationship between the PMD and the integrity risk with a given VPL is shown in Figure 5. PMD is changed to the bias, and a similar relationship is shown in Figures 6 and 7. The input integrity risk in Figures 4 and 6 is derived by the input VPL value in Figures 5 and 7. The maximum PMD depicted in Figures 4 and 5 and the maximum bias shown in Figures 6 and 7 are the same respectively. Therefore, the worst case is defined as the maximum VPL in the new procedure, which is equivalent with the maximum integrity risk in the original method. The integrity risk with the maximum VPL is guaranteed to be the same as the required one. In this way, the uncertainty of the input VPL is avoided.
VPL as a function of PMD.
Integrity Risk as a function of PMD.
VPL as a function of Bias.
Integrity Risk as a function of Bias.
There are two ways to calculate the new VPL (VPLnew). The first option is the search method. In this method, the PMD range is divided by pre-defined total search steps. Within each step, the PMD value is then determined, and the VPL values with given integrity risk are calculated. The maximum VPL is the desired result. The criterion is described as,
 $${ {\rm max}(VPL),\;{\rm subject}\,{\rm to}\mathop \int \nolimits_{ - \infty} ^{ - {\rm VPL}} \hskip-3pt {\rm f}({\rm x}){\rm dx} + \mathop \int \nolimits_{{\rm VPL}}^{ + \infty} \hskip-3pt{\rm f}({\rm x}){\rm dx} = \displaystyle{{{\rm IR}_{{\rm ia}}} \over {{\rm P}_{{\rm H}_{{\rm ia}}} {\rm P}_{{\rm MDi}}}} \;{\rm and}\;\displaystyle{{{\rm IR}_{{\rm ia}}} \over {{\rm P}_{{\rm H}_{{\rm ia}}}}} \lt P_{{\rm MDi}} \lt 1}$$
where f(x) is the probability density function of  $\tilde x_v $.
Although the search method is simplified with only one search loop, compared with the two loops of search for the VPLMO, the accuracy of the result is still not able to be controlled, depending on the total steps in the search loops. To gain results within the pre-defined accuracy, the analytical method is designed with an equivalent criterion to maximize the integrity risk as an inequality constrained maximization problem that can be solved by the optimization tool in MATLAB with the interior point method,
 $$\eqalign{ & {\max}_{\rm VPL} \left\{ {{\rm P}_{{\rm MDi}} \left[ {\mathop \int \nolimits_{ - \infty} ^{ - {\rm VPL}} {\rm f}({\rm x}){\rm dx} + \mathop \int \nolimits_{{\rm VPL}}^{ + \infty} {\rm f}({\rm x}){\rm dx}} \right]} \right\}, \cr & {\rm subject}\;{\rm to}\mathop \int \nolimits_{ - \infty} ^{ - {\rm VPL}} {\rm f}({\rm x}){\rm dx} + \mathop \int \nolimits_{{\rm VPL}}^{ + \infty} {\rm f}({\rm x}){\rm dx} = \displaystyle{{{\rm IR}_{{\rm ia}}} \over {{\rm P}_{{\rm H}_{{\rm ia}}} {\rm P}_{{\rm MDi}}}} \;{\rm and}\;\displaystyle{{{\rm IR}_{{\rm ia}}} \over {{\rm P}_{{\rm H}_{{\rm ia}}}}} \lt P_{{\rm MDi}} \lt 1} $$
If convergent, the result derived from the analytical method should be within the pre-defined accuracy. The computation efficiency of both methods will be shown later by an example.
5.2. Analysis of Conservativeness
VPLnew as the exact value is compared with other VPLs to analyse the conservativeness. VPLnew can be expressed as a combination of the non-centrality part ∇x i and the random part,
 $${\rm VPL}_{{\rm new},{\rm i}} = \nabla {\rm VPL_i} + {\rm Q}\left( {\nabla {\rm VPL_i}, \displaystyle{{{\rm IR}_{{\rm ia}}} \over {{\rm P}_{{\rm H}_{{\rm ia}}} {\rm P}_{{\rm MDi}}}}} \right)$$
where the second parameter is the random part as a function of ∇VPLi and  ${\textstyle{{{\rm IR}_{{\rm ia}}} / {{\rm P}_{{\rm H}_{{\rm ia}}} {\rm P}_{{\rm MDi}}}}} $ with Equations (16) or (17).
Based on Equation (14), the following inequality is derived,
 $$\nabla {\rm VPL_i} \lt \left[K\left( {1 - \displaystyle{{{\rm P}_{{\rm FAi}}} \over 2}} \right) + {\rm K}\left( {1 - \displaystyle{{{\rm IR}_{{\rm ia}}} \over {{\rm P}_{{\rm H}_{{\rm ia}}}}}} \right)\right]{\rm Vslope_i} $$
When ∇VPLi≠0, the following inequality is derived,
 $${\rm Q}\left( {\nabla {\rm VPL_i}, \displaystyle{{{\rm IR}_{{\rm ia}}} \over {{\rm P}_{{\rm H}_{{\rm ia}}} {\rm P}_{{\rm MDi}}}}} \right) \lt {\rm K}\left( {1 - \displaystyle{{{\rm IR}_{{\rm ia}}} \over {2{\rm P}_{{\rm H}_{{\rm ia}}} {\rm P}_{{\rm MDi}}}}} \right){\rm \sigma} _{\rm v} \lt {\rm K}\left( {1 - \displaystyle{{{\rm IR}_{{\rm ia}}} \over {2{\rm P}_{{\rm H}_{{\rm ia}}}}}} \right){\rm \sigma} _{\rm v} $$
Therefore, the conservativeness of the VPLBC is obtained,
 $${\rm VPL}_{{\rm new},{\rm i}} \lt {\rm VPL}_{{\rm BCi}} $$
The position error can be regarded as a sum of two parts: solution separation and subset solution error,
 $$|\nabla x_v | \lt |\hat x_v - \hat x_{vi} | + |\hat x_{vi} - x_v |$$
With the relationship of test statistic and solution separation in Equation (4), a given PMD can be concluded
 $${\rm P\{} |\hat x_v - \hat x_{vi} | \lt {\rm T}_{\rm i} {\rm \sigma} _{{\rm ss},{\rm i}} {\rm |H}_{{\rm ia}} {\rm \}} = {\rm P}_{{\rm MDi}} $$
With Equation (7),
 $${\rm P}\{ |\hat x_{vi} - x_v | \gt {\rm VPL}_{{\rm new},{\rm i}} - {\rm T}_{\rm i} {\rm \sigma} _{{\rm ss},{\rm i}} |{\rm H}_{{\rm ia}} \} \gt \displaystyle{{{\rm IR}_{{\rm ia}}} \over {{\rm P}_{{\rm H}_{{\rm ia}}} {\rm P}_{{\rm MDi}}}} $$
Therefore,
 $${\rm VPL}_{{\rm new},{\rm i}} \lt K\left( {1 - \displaystyle{{{\rm IR}_{{\rm ia}}} \over {2{\rm P}_{{\rm H}_{{\rm ia}}} {\rm P}_{{\rm MDi}}}}} \right){\rm \sigma} _{\rm i} + {\rm K}\left( {1 - \displaystyle{{{\rm P}_{{\rm FAi}}} \over 2}} \right){\rm \sigma} _{{\rm ss},{\rm i}} \lt {\rm VP}{\rm L}_{{\rm PBi}} $$
Consequently, VPLBC and VPLPB are always conservative irrespective of the size of the bias.
6. A NUMERICAL EXAMPLE
Results using measurements collected on UNSW campus within a 24-hour time span are shown in Figures 8 and 9. The mask angle of GPS was 5°. The prior probability for each local hypothesis is 1×10⁻⁵. The integrity risk under the fault free case is 4·35×10−8, and the same for the faulty case. The PFA of each hypothesis is 4×10⁻⁶. The measurements are assumed to follow standard normal distribution without correlation among each other. Two ways to calculate the new VPL, the search method given by Equation (16) and the analytical method given by Equation (17) where the accuracy of the integrity risk is set at 10−10, are compared in Figure 8.
Two ways to calculate the VPLnew.
VPLnew and other VPLs.
With the increase of the total number of the steps in the search method, the accuracy of the results increases. It was found that beyond around 150 steps there was no obvious accuracy increase so 150 steps were used. To ensure convergence in the analytical method, the initial value at epoch 1 was chosen by using the search method.
As demonstrated in Figure 8, the search method is not able to protect the user all the time, with the evidence that VPL from the search method is smaller than with the analytical one. This is caused by the accuracy problem within the search steps. Plus, the computation time for one epoch averages 5·26 s with 150 steps in the search method. Using the non-linear optimization tool in MATLAB, the analytical method can greatly improve the computation efficiency with an average of 0·35 s consumed for one epoch. Therefore, the analytical method should be used to determine VPLnew with higher computational efficiency and accuracy. The VPLnew determined by the analytical method together with other VPLs are shown in Figure 9.
VPLBC and VPLPB were always bigger than VPLnew with different levels of conservativeness, which is consistent with the proof in Section 5.2. There were situations where VPLWE was smaller than VPLnew in this experiment, which is evidence that VPLWE is not safe to be used. The computation time with the conventional methods (VPLPB and VPLBC) for one epoch averaged 1·21×10−3 s with the Intel Core 2 Duo Processor E8400. To gain the correct result of VPLMO with 150 steps in the PMD search and 500 steps in the VPL search within the range of 0∼50 m, it took an average of 9·32 s for one epoch.
7. A-RAIM PERFORMANCE
The simulation for A-RAIM was set up as follows to test the availability of LPV200. As the error model defined for this service, a bias term was added to gain more conservative results (GEAS, 2008; 2010). The values for the nominal bias and the maximum bias were 0·1 m and 0·75 m. The User Range Error (URE) and User Range Accuracy (URA) were 0·25 m and 0·5 m. The risk definition was defined as follows. The total integrity risk 2×10⁻⁷ was divided into the horizontal and vertical case evenly. Within the vertical case, the multiple fault modes were excluded, leaving the single fault and fault free hypotheses with the integrity risk as 8·7×10−8. The integrity risk was distributed evenly onto each hypothesis. The prior probability of each single fault mode was 1×10⁻⁵. The probability of the null hypothesis was approximated as one. The continuity risk under the fault free and single fault modes was 4×10⁻⁶ separately. Again, the continuity risk was distributed evenly onto each hypothesis.
The almanac data for the standard 24 GPS and 27 Galileo satellite constellation was used to determine the geometry at each location with a 5×5° grid on the world map at 50 m altitude. Results of VPL at each location were obtained every 6 minutes over the 24 hour duration. Mask angle of GPS and Galileo are 5° and 15° respectively. The availability was determined by comparing each VPL value with the VAL (35 m) for each location in one day. The percentage having over 99% availability over this time is shown worldwide. The simulation software is based on the MATLAB Algorithm Availability Simulation Tool (MAAST) provided by Stanford University. Simulation results are as follows.
99% Availability with VPL PB, 24GPS.
99% Availability with VPL BC, 24GPS.
99% Availability with New VPL, 24GPS.
99% Availability with VPL PB, 27Galileo.
99% Availability with VPL BC, 27Galileo.
99% Availability with New VPL, 27Galileo.
It has been shown that A-RAIM performance is greatly improved using the new VPL with both GPS and Galileo. Also, VPLPB showed worse results for A-RAIM performance than VPLBC with GPS, but better performance with Galileo. Therefore, the relationship between VPLPB and VPLBC is dependent on geometry. It is also noted that the new VPL took around 100 times longer to calculate than the other two methods.
8. CONCLUDING REMARKS
To gain the exact value with the required integrity risk, the new procedure is demonstrated to be simpler, more reliable and more computationally efficient than the current VPL methods. With conventional methods designed to gain the approximated values, A-RAIM performance is greatly improved with the new VPL method when compared with the conventional ones. While the computational burden is increased, the computation speed is sufficient for real-time applications. Also, two of the conventional methods, the classic method and the MHSS method, are proved to be safe regardless of the size of the bias, while the VPLWE is not. With the optimization method given in the MATLAB toolbox, further efforts can be made to customize the optimization method for this specific problem to maximise the computational efficiency. In addition, the more complicated problem of computing exactly Horizontal Protection Level (HPL) should be further investigated in a separate study.
ACKNOWLEDGEMENTS
The first author is sponsored by the Chinese Scholarship Council for her PhD studies at the University of New South Wales, Australia.