INTRODUCTION
Macrobenthic organisms have evolved different strategies for obtaining resources, eliminating wastes, and taking part in various biotic interactions within sedimentary habitats. One such strategy consists of establishing long term or semi-permanent burrows through which the transport of water, associated particles and solutes can be induced via the ventilation activities of the resident organism. Burrow formation and irrigation can alter sediment structure at different scales (Aller & Yingst, Reference Aller and Yingst1978; Mermillod-Blondin et al., Reference Mermillod-Blondin, Rosenberg, Francois-Carcaillet, Norling and Mauclaire2004; Zorn et al., Reference Zorn, Gingras and Pemberton2010) and can result in an enhancement or inhibition of nutrient and gas fluxes within the sediment column (Kristensen, Reference Kristensen1984, Reference Kristensen1985; Krantzberg, Reference Krantzberg1985; Gerino et al., Reference Gerino, Stora, François-Carcaillet, Gilbert, Poggiale, Mermillod-Blondin, Desrosiers and Vervier2003). Burrow walls form important microhabitats with specific microbial and meiofaunal communities (Reise, Reference Reise1981; Commito & Shrader, Reference Commito and Shrader1985; Mermillod-Blondin et al., Reference Mermillod-Blondin, Rosenberg, Francois-Carcaillet, Norling and Mauclaire2004) that can modify biogeochemical processes in adjacent sediments (Kristensen, Reference Kristensen1985; Papaspyrou et al., Reference Papaspyrou, Gregersen, Kristensen, Christensen and Cox2006).
Burrows can consist of complex structures with multiple branches (or shafts) and openings to the sediment surface (Miron et al., Reference Miron, Desrosiers, Retière and Lambert1991a, Reference Miron, Desrosiers, Retière and Lambertb; Davey, Reference Davey1994; Gingras et al., Reference Gingras, Pemberton, Dashtgard and Dafoe2008). Although there is no direct evidence that the three-dimensional (3D) organization of such structures can influence bioturbation or bioirrigation processes, changes observed during the establishment of burrows suggest a role for burrow form (Kristensen et al., Reference Kristensen, Penha-Lopes, Delefosse, Valdemarsen, Quintana and Banta2012). For example, the polychaete Alitta virens Sars, 1835 (synonyms Nereis virens, Neanthes virens, Bakken & Wilson, Reference Bakken and Wilson2005) constructs burrows of different shapes (I, U, J and Y) and complexity (from simple to multi-branched forms) (Reise, Reference Reise1981; Miron et al., Reference Miron, Desrosiers, Retière and Lambert1991b; Herringshaw et al., Reference Herringshaw, Sherwood and McIlroy2010). Studies of this species have shown that over the course of burrow formation and maintenance, the total sedimentary oxygen uptake (Kristensen, Reference Kristensen1984, Reference Kristensen1985; Michaud et al., Reference Michaud, Desrosiers, Mermillod-Blondin, Sundby and Stora2005) and levels of particle transport induced by the worm's activity will vary (Michaud et al., Reference Michaud, Desrosiers, Mermillod-Blondin, Sundby and Stora2005; Piot et al., Reference Piot, Rochon, Stora and Desrosiers2008; Kristensen et al., Reference Kristensen, Penha-Lopes, Delefosse, Valdemarsen, Quintana and Banta2012).
The role of burrow form is generally not taken into account when considering the functional role of burrowing organisms, mainly due to the difficulty in obtaining 3-D structure data in a sediment column. However, data regarding the shape, volume and surface area of burrows are likely to be important for the study and calibration of bioturbation models (François et al., Reference François, Dalègre, Gilbert and Stora1999, Reference François, Gerino, Stora, Durbec and Poggiale2002; De Montety et al., Reference De Montety, Long, Desrosiers, Crémer, Locat and Stora2003), for relating organism behaviour to flux rates, and for understanding the functioning of both current and past sedimentary ecosystems (Gingras et al., Reference Gingras, Pemberton, Dashtgard and Dafoe2008; Zorn et al., Reference Zorn, Gingras and Pemberton2010; Kristensen et al., Reference Kristensen, Penha-Lopes, Delefosse, Valdemarsen, Quintana and Banta2012). Further, burrow form can be affected by sediment grain size, elasticity, porosity and degree of compaction (Brenchley, Reference Brenchley1982; Miron & Desrosiers, Reference Miron and Desrosiers1990; Daschtgard et al., Reference Dashtgard, Gingras and Pemberton2008), so the consideration of both sedimentary and burrow characters is desirable when evaluating the functional role of burrow forming organisms.
Although researchers have described the three-dimensional structure of burrows formed in aquaria (Miron et al., Reference Miron, Desrosiers, Retière and Lambert1991b; Herringshaw et al., Reference Herringshaw, Sherwood and McIlroy2010), and in the field using resin casts (Risk et al., Reference Risk, Venter, Pemberton and Buckley1978; Dworschak, Reference Dworschak1983; Davey, Reference Davey1994; Butler & Bird, Reference Butler and Bird2007), we are not aware of any study of the spatial organization of multiple complex burrows in situ and within different types of sediments. Axial tomodensitometry (CT-scan) is a useful and rapid approach for the visualization and biovolume quantification of burrows and other biogenic structures within sediment cores (De Montety et al., Reference De Montety, Long, Desrosiers, Crémer, Locat and Stora2003; Mermillod-Blondin et al., Reference Mermillod-Blondin, Marie, Desrosiers, Long, de Montety, Michaud and Stora2003; Michaud et al., Reference Michaud, Desrosiers, Long, de Montety, Crémer, Pelletier, Locat, Gilbert and Stora2003; Rosenberg et al., Reference Rosenberg, Davey, Gunnarsson, Norling and Frank2007, Reference Rosenberg, Grémare, Duchêne, Davey and Frank2008); this technique could be used to investigate variability in the spatial organization and biovolume of burrows at different scales. Here, we use CT-scanning to describe and compare burrow assemblages within intertidal sediments dominated by A. virens. Burrow metrics (number, volume, diameter, degree of aggregation) are compared at two different scales: within and between intertidal mudflats separated by 20 km and experiencing different environmental conditions (exposed vs sheltered). We hypothesize that: (1) significant differences in burrow characteristics exist between sites, but that (2) there are no significant differences within a given site, suggesting that the functional importance of A. virens in different intertidal sites can vary. Also, we evaluate the usefulness of the CT-scan metric tomographic intensity (TI) as a predictive parameter, given that TI is influenced by several factors such as grain size, sediment compaction and composition, and biogenic occupation (Crémer et al., Reference Crémer, Long, Desrosiers, De Montety and Locat2002; De Montety et al., Reference De Montety, Long, Desrosiers, Crémer, Locat and Stora2003; Mermillod-Blondin et al., Reference Mermillod-Blondin, Marie, Desrosiers, Long, de Montety, Michaud and Stora2003; Michaud et al., Reference Michaud, Desrosiers, Long, de Montety, Crémer, Pelletier, Locat, Gilbert and Stora2003).
Alitta virens burrows are good models for such a study: they are long-term burrows, consolidated by mucus (Gingras et al., Reference Gingras, Pemberton, Dashtgard and Dafoe2008; Herringshaw et al., Reference Herringshaw, Sherwood and McIlroy2010; Zorn et al., Reference Zorn, Gingras and Pemberton2010), and of variable complexity (Miron et al., Reference Miron, Desrosiers, Retière and Lambert1991b; Gingras et al., Reference Gingras, Pemberton, Dashtgard and Dafoe2008; Herringshaw et al., Reference Herringshaw, Sherwood and McIlroy2010). Each A. virens individual establishes its own burrow, and there is no connection between the galleries of different individuals (Miron et al., Reference Miron, Desrosiers, Retière and Lambert1991b). Alitta virens are common and abundant members of boreal Macoma balthica Linnaeus, 1758 communities (Desrosiers et al., Reference Desrosiers, Brêthes and Coulombe1980; Desrosiers & Brêthes, Reference Desrosiers and Brêthes1984), with estimated abundances reaching close to 500 individuals m−2 in the intertidal zone of the St Lawrence Estuary (Miron & Desrosiers, Reference Miron and Desrosiers1990).
MATERIALS AND METHODS
Study sites
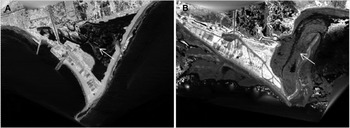
Sediment core sampling occurred in June 2005, on the northern shore of the Chaleur Bay, on the Gulf of St Lawrence, Canada (Figure 1). Two intertidal mudflats, adjacent to salt marshes and separated by approximately 20 km of coastline, were chosen: (1) the exposed site, in Paspébiac (P), was periodically connected to the bay by a narrow channel and submitted to tidal exchange and little riverine input; and (2) the sheltered site, at St-Siméon(S), was a non-vegetated patch within a salt marsh sheltered by a sand bar and receiving greater river effluents (Renaud, Reference Renaud2000). At both sites, the benthic macrofauna is dominated by the polychaete Alitta virens (personal observation during slicing of the cores), the only resident species that constructs long term burrows.
Location of the two sampling sites, on the southern shore of the Gaspé peninsula, Quebec, Canada. (A) Paspébiac (48°2′0.02″N, 65°15′0.02″W); (B) St-Siméon (48°4′0.02″N, 65°34′0.02″W). Arrows indicate sampling sites on Lidar images of the two salt marshes.

Core sampling and sediment analysis
At each site, four samples, separated from each other by approximately 1–3 m, were obtained haphazardly using aluminium push cores (diameter: 10 cm) from patches of mudflat that appeared homogeneous and had apparent burrow apertures. Cores were pushed by hand until a high degree of resistance was felt; as a result, core length varied between 20 and 30 cm between sites. Cores were sealed at the bottom with a rubber cap and duct tape and at the top with a rubber-rimmed aluminium screw-top seal. All cores were kept upright and refrigerated at 4°C until they were scanned (up to seven days after collection) and then extruded. We assume that burrow structures were not significantly altered between core collection and CT-scanning because of the partial drainage of water that resulted from the sampling approach (particularly in the burrow lumina; this probably led to individuals taking refuge at the bottom of their burrows), and because refrigeration likely limited worm activity (Ouellette et al., Reference Ouellette, Desrosiers, Gagné, Gilbert, Poggiale, Blier and Stora2004). We cannot confidently report on the number of organisms that were alive within the cores at the time of collection because of the delay between sampling and core extrusion following CT-scanning (due to transportation between sampling site and the CT-scanning facility, and availability of the instrument).
After scanning, sediment grain size was determined for samples obtained at the surface, middle, and bottom of each core, using a Beckman LS 13 320 Coulter counter (size range: 0.04–2000 µm) and Gradistat software in Excel®. Sediment grain sizes were divided into three categories: gravel (>500 µm), sand (63–500 µm) and mud (<63 µm).
The percentage organic matter (OM) content in sediments was determined by loss of dry mass following ignition (48 h at 450°C) as in Heiri et al. (Reference Heiri, Lotter and Lemcke2001). Sediment samples for organic matter determinations were taken from the sediment surface and at 2 cm intervals for the entire length of each core.
CT-scanning and 3-D reconstructions
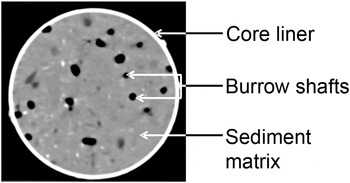
Cores were scanned along their entire length at 140 kV using a Siemens Somatom Volume Access scanner at the Institut National de la Recherche Scientifique, Eau Terre Environnement, Quebec City, Canada. The Siemens scanner uses 26,000 spatial projections to reconstruct a series of consecutive 2D sections of the scanned object with a spatial resolution of at least 0.1 mm. For each scanned volume unit (voxel), the tomographic intensity (TI) is measured and given in Hounsfield units (Hounsfield, Reference Hounsfield1973), where the TI represents the absorption coefficient of X-rays within the voxel relative to the absorption coefficient of water, and is related to the density, atomic number and radiation–matter principles of all particles contained in the voxel (Duliu, Reference Duliu1999). The TI of each voxel is then represented by a grey scale of 4096 values on a 2-D matrix of 512 × 512 pixels (Figure 2). In scanned sediment cores, the TI depends mostly on the density of particles and the presence of air or water filled spaces within each voxel (Michaud et al., Reference Michaud, Desrosiers, Long, de Montety, Crémer, Pelletier, Locat, Gilbert and Stora2003). Grain size, mineral composition and compaction of sediments also influence TI values (Boespflug et al., Reference Boespflug, Long and Occhietti1995; Michaud et al., Reference Michaud, Desrosiers, Long, de Montety, Crémer, Pelletier, Locat, Gilbert and Stora2003).
Transverse CT-section of a sediment core (10 cm in diameter). Tomographic intensity, number and diameter of burrow shafts, percentage biogenic space, and spatial coordinates were determined or calculated from such images using ImageJ.

Consecutive transverse sections were scanned at a thickness of 1 mm for each core. From this series, 3-D reconstructions of biogenic structures were made using the Siemens software and the freeware OsiriX v.3.6, as in Dufour et al. (Reference Dufour, Desrosiers, Long, Lajeunesse, Gagnoud, Labrie, Archambault and Stora2005).
CT-scan image analysis
For every fifth transverse section, the number of all air or water filled structures (with TI values <0 HU) measuring >2 mm in diameter (to exclude meiofauna and juveniles) and appearing on more than three consecutive sections was determined. These structures are hereafter referred to as burrow shafts: because of the complex form of Alitta virens burrows, an individual burrow can have more than one shaft on a 2-D core section (Figure 2). Their mean diameter and central spatial coordinates were recorded, and the average TI of all materials within the core liner was determined by selecting the core area as a region of interest in ImageJ® (http://rsbweb.nih.gov/ij/; Abramoff et al., Reference Abramoff, Magalhaes and Ram2004). From this region of interest, the surface area was obtained, and the percentage of space occupied by biogenic structures was calculated, as in Dufour et al. (Reference Dufour, Desrosiers, Long, Lajeunesse, Gagnoud, Labrie, Archambault and Stora2005). Measurements began 5–10 mm below the sediment surface because surface irregularities would have led to biases in the uppermost sections.
For each fifth section, the number of burrow shafts, their central coordinates and the section area were used to calculate the R index (Clark & Evans, Reference Clark and Evans1954). This index, generally used to determine the level of spatial organization of individuals of a single species (such as trees in a quadrate), has previously been used to determine the spatial structure of burrow apertures of polychaetes and terebellids (Anderson & Kendziorek, Reference Anderson and Kendziorek1982; Miron et al., Reference Miron, Desrosiers, Retière and Lambert1991b). The R index is a nearest-neighbour based estimation of the spatial distribution of points along a horizontal plane, on a scale from 0 (maximal aggregation) to 2.14 (maximal spacing), with values of 1 representing random distributions (Clark & Evans, Reference Clark and Evans1954). We treated burrow shafts as points instead of circles; this should not influence the results since shaft diameters (average: 3.5 mm) were less than half the expected mean nearest-neighbour distance (Simberloff, Reference Simberloff1979). The R index was determined only for sections where the number of burrow shafts was >7, as recommended by Andrew & Mapstone (Reference Andrew and Mapstone1987); this represented 72 measurements in total. Significant departures from spatial randomness were tested for each R determination as in Clark & Evans (Reference Clark and Evans1954).
Two burrow volume determinations were made for each core: (1) the total volume of all biogenic space; and (2) the volume of those structures connected to the sediment surface (that is, excluding relict structures, as defined by Rosenberg et al. (Reference Rosenberg, Davey, Gunnarsson, Norling and Frank2007)). Using ImageJ® and the plug-in Object counter 3-D, all biogenic structures were identified, and their volumes were determined independently and then combined to represent the total burrow volume (TBV). To quantify surface-linked burrow volume (SLBV), only the structures that reached the sediment surface were considered, and their volumes were summed for each core. t-tests were performed for site comparisons after verifying homogeneity of variance using Levene tests.
Statistical analyses
Given that all variables (number of shafts, diameter of shafts, percentage biogenic space, percentage organic matter, TI), with the exception of R, varied with depth, analyses of covariance (ANCOVAs) were used to test the effect of the site (fixed factor, P and S) and cores nested within sites (random factor, four cores per site) with depth as the covariate. To account for differences in total core length, all ANCOVAs were run to an equivalent depth (115 mm). Normality was tested on the residuals using the Shapiro–Wilk test, and was observed for only two variables (diameter of shafts and TI). When a transformation was possible and met the normality assumption, it was applied. However, ANCOVAs are robust to small departures from normality when sample size is high and the design is balanced (Underwood, Reference Underwood1997). Plotting residuals against adjusted group means was used to check the assumption of homogeneity of variances (Quinn & Keough, Reference Quinn and Keough2002). Outliers (one for % biogenic space, one for % organic matter, one for tomographic intensity, three for diameter of shafts and four for % biogenic space) were removed to reach the assumption.
To investigate any relationships between variables (number of shafts, diameter of shafts, percentage biogenic space, percentage organic matter, TI, and R), Pearson correlations were calculated, for the top 115 mm, with data from all cores combined. Also, site-specific Pearson correlations were calculated for TI and OM, because the site effect was significant.
RESULTS
Sediment characteristics
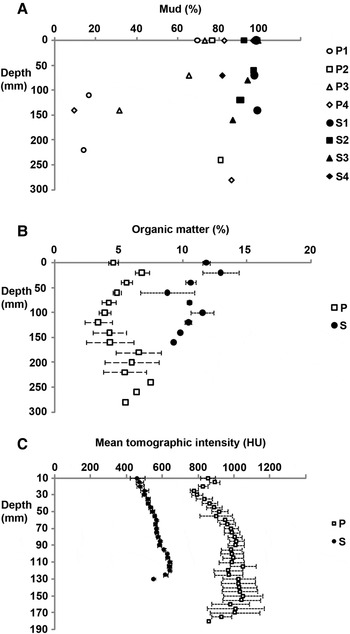
We obtained longer cores from Paspébiac (140–280 mm) than from St-Siméon (120–160 mm). Sediments from both mudflats lacked gravel, and contained proportions of sand and mud that varied within and between cores (Figure 3A). On average, there was a greater proportion of mud in cores from St-Siméon (94%) than in cores from Paspébiac (58%); at the latter site, sand tended to be more prevalent in deeper parts of the core. The shorter cores from St-Siméon were more homogeneous, containing mostly mud at all stations and depths.
Vertical distribution of (A) mud content; (B) sediment organic matter content; (C) mean tomographic intensity in cores sampled from Paspébiac (P) and St-Siméon (S). Values in (B) and (C) are averages ± SE of data from four cores per site.

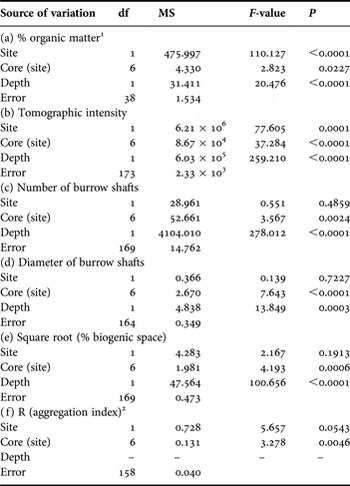
Sediment organic matter content covaried with depth at both sites (Table 1). Organic matter content was greater in cores from St-Siméon (mean ± SE: 10.84 ± 0.61%) than in cores from Paspébiac (mean ± SE: 5.09 ± 0.62%); ANCOVA results show significant intra- and inter-site variability (Figure 3B; Table 1).
Summary of analyses of covariance with depth as covariates showing the effect of (a) % organic matter, (b) tomographic intensity, (c) number of burrow shafts, (d), diameter of burrow shafts (e) % biogenic space, and (f) R (aggregation index).

1 the interaction between depth and site was significant; all sources of variation involving depth were removed because they were not significant.
The average TI of CT sections increased (and covaried significantly) with depth at both sites (Figure 3C; Table 1). Depth-specific TI values were higher and more variable on sections from the Paspébiac cores (mean ± SE: 947 ± 53 HU) than on those from St-Siméon (mean ± SE: 560 ± 18 HU); despite high intra-site variability, the site effect was significant (Table 1).
Burrow shape and volume
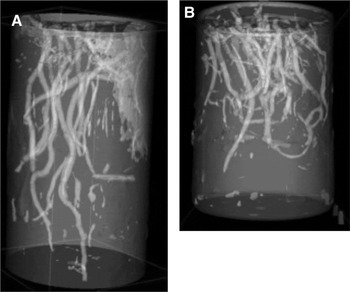
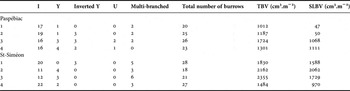
Entire burrows were revealed through CT-scan reconstructions of each core (Figure 4). We saw no evidence of burrow collapse. Despite variable core lengths, most burrows did not extend deeper than the length of the core. Burrows took various shapes: I, Y, inverted Y, U, and multi-branched forms (Table 2). At each site, I-shaped burrows were the most common. Multi-branched burrows were more frequent at St-Siméon than at Paspébiac, and U forms were absent in St-Siméon. The number of entire burrows per core ranged between 18 and 28.
Three-dimensional reconstruction of burrows in cores from (A) Paspébiac and (B) St-Siméon produced using OsiriX v.3.6.

Number of burrows of each shape (I, Y, inverted Y, U and multi-branched) within the four sediment cores from each site, and calculated total biogenic volume (TBV) and surface-linked biogenic volume (SLBV).

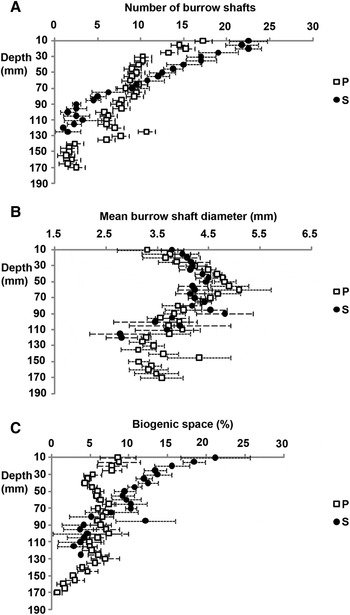
Considering all depths and core replicates, the total number of burrow shafts visible on a 2-D section was greater in cores from St-Siméon (mean ± SE: 10.1 ± 1.2) than in those from Paspébiac (mean ± SE: 8.4 ± 1.3), but values were highly variable throughout (Figure 5A). At both sites, the number of shafts covaried with depth (Table 1), with the greatest number of shafts found close to the sediment surface. The relationship between burrow shafts and depth differed between sites: the slope was more pronounced for St-Siméon data, and the curves intersected at 70 mm depth (Figure 5A). The ANCOVA results showed significant intra-site variability but no site effect (Table 1).
Vertical distribution of (A) number of burrow shafts; (B) mean structure diameter; (C) percentage space occupied by structures, in cores sampled from Paspébiac (P) and St-Siméon. Values are averages ± SE of data from four cores per site.

The average diameter of shafts covaried with depth and varied significantly between cores (Table 1; Figure 5B). Average shaft diameter throughout the cores was 3.92 ± 0.07 mm at Paspébiac and 3.75 ± 0.61 mm at St-Siméon; the difference between sites was not significant (Table 1).
The percentage of space occupied by biogenic structures per CT section, when averaged throughout the length of the core, was greater and more variable at St-Siméon (mean ± SE: 9.84 ± 1.50%) than at Paspébiac (mean ± SE: 5.83 ± 0.33%). At St-Siméon, the percentage spatial occupation decreased with depth, whereas it appeared relatively constant with depth at Paspébiac (Figure 5C); the ANCOVA revealed a significant depth effect with a high variability among cores, but no significant difference between sites (Table 1).
Burrow volumes were highly variable and significantly different between sites (t-tests: TBV, P < 0.05; SLBV, P < 0.05). Average TBV was were slightly larger at St-Siméon (1957 ± 383 cm3.m−2) than at Paspébiac (1306 ± 151 cm3.m−2). Inter-site differences in SLBVs were more pronounced (St-Siméon: 1587 ± 457 cm3.m−2; Paspébiac 569 ± 300 cm3.m−2; Table 2).
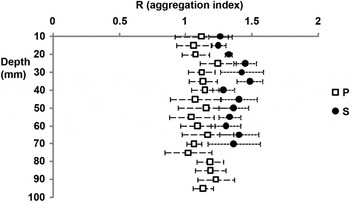
The nearest-neighbour distance between burrow shafts ranged from 3.2 to 49.7 mm in the Paspébiac cores (mean ± SE: 19.06 ± 0.31 mm), and from 3.4 to 54.5 mm in the St-Siméon cores (mean ± SE: 20.06 ± 4.20 mm). The Clark & Evans index of aggregation is on average slightly lower at Paspébiac (mean ± SE: 1.06 ± 0.11) than at St-Siméon (mean ± SE: 1.36 ± 0.16) (Figure 6) with the difference between sites being nearly significant (Table 1). At Paspébiac, 11 out of 34 R measurements (32%) showed a significant departure from randomness at P < 0.05, compared to 23 out of 38 R measurements at St-Siméon (60%).
Aggregation index (R) determined for burrow shafts along a horizontal plane, according to depth in the core. Values are averages ± SE of data from four cores per site. P, Paspébiac; S, St-Siméon.

Relationships between variables
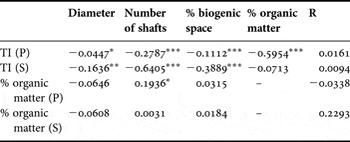
Several correlations between parameters were significant (Table 3), but coefficients were weak. TI values were highly negatively correlated to OM content and, to a lesser extent, with the percentage biogenic space and number of shafts. Also, the number of shafts and percentage biogenic space were positively correlated. When sites were considered separately, significant Pearson coefficients were greater between TI and OM in Paspébiac and between TI and number of shafts and percentage biogenic space in St-Siméon (Table 4).
Pearson correlations (R2 values) between pairs of variables using all replicates of both sampling sites, combined. *, P < 0.05; **, P < 0.01; ***, P < 0.001.

Pearson correlations (R2 values) between pairs of variables using all replicates within each sampling site, treated separately: Paspébiac (P) and St-Siméon (S). *, P < 0.05; **, P < 0.01; ***, P < 0.001.

DISCUSSION
Sediment-related characters at the study sites
As expected, sediment characteristics differed between study sites, likely as a result of different topographies and hydrodynamic conditions. Grain size, although determined at different depths (and lithofacies) in each core, showed certain site-specific trends. Grain size was more variable within the Paspébiac cores, and St-Siméon cores contained a greater proportion of mud and a higher organic matter content, suggesting that low energy conditions, vegetation and riverine input enhance sedimentation of finer particles at St-Siméon (Renaud, Reference Renaud2000). Site-specific differences in corer penetration (and resulting core length) were likely due to the relative position of a layer of dense, postglacial marine mud (Gagnoud et al., Reference Gagnoud, Lajeunesse, Desrosiers, Long, Dufour, Labrie, Mermillod-Blondin and Stora2009), reflecting differences in the intensity and frequency of accretionary and erosionary (storm or ice-related) events in these intertidal areas. Dense postglacial mud limits the penetration of organisms of the Macoma balthica community such as Alitta virens (Gagnoud et al., Reference Gagnoud, Lajeunesse, Desrosiers, Long, Dufour, Labrie, Mermillod-Blondin and Stora2009). It appears, therefore, that the relative thickness of habitable space in the upper sediment was greater at the Paspébiac site.
In CT-scanned sediment cores, the average TI usually increases with depth due to sediment compaction (Boespflug et al., Reference Boespflug, Long and Occhietti1995; Crémer et al., Reference Crémer, Long, Desrosiers, De Montety and Locat2002; De Montety et al., Reference De Montety, Long, Desrosiers, Crémer, Locat and Stora2003; Dufour et al., Reference Dufour, Desrosiers, Long, Lajeunesse, Gagnoud, Labrie, Archambault and Stora2005); the same trend was observed in all cores studied here. The average TI in a core section is affected by biogenic space, with core sections having a high proportion of (low TI) water-filled biogenic space having lower average TI values (Boespflug et al., Reference Boespflug, Long and Occhietti1995; Duliu, Reference Duliu1999; Pralle et al., Reference Pralle, Bahner and Benkler2001; De Montety et al., Reference De Montety, Long, Desrosiers, Crémer, Locat and Stora2003). Boespflug et al. (Reference Boespflug, Long and Occhietti1995) also found negative correlations between average TI values and both organic matter content and grain size. In our study, the average, depth-specific TI per section clearly differed in both study sites, and values are significantly, negatively correlated with organic matter content and to a weaker extent with the number of burrow shafts and the biogenic space occupied (Table 3). Average TI values of sediments from St-Siméon, the site with a greater proportion of mud and organic matter, were significantly lower than those from Paspébiac; this may be partly explained by differences in mineral composition between mud and sand (Crémer et al., Reference Crémer, Long, Desrosiers, De Montety and Locat2002). Small-scale (intra-site) differences in TI values may be more reflective of the relative number and spatial coverage of biogenic structures, particularly at St-Siméon (Table 4).
Burrow structure and distribution—general observations
Based on 3-D reconstructions, all burrow forms previously ascribed to A. virens (Miron et al., Reference Miron, Desrosiers, Retière and Lambert1991b; Gingras et al., Reference Gingras, Pemberton, Dashtgard and Dafoe2008; Herringshaw et al., Reference Herringshaw, Sherwood and McIlroy2010) were observed in the cores collected, with the exception of the L-forms of Miron et al. (Reference Miron, Desrosiers, Retière and Lambert1991b)—the latter may be artefacts of aquarium maintenance. At both sites, I-forms were most common. Different functions have been ascribed to those burrow forms: Y-shaped burrows may be associated with surface feeding activities and enhanced protection from predators (Herringshaw et al., Reference Herringshaw, Sherwood and McIlroy2010), while U-shaped burrows may be optimized for filter feeding (Gingras et al., Reference Gingras, Pemberton, Dashtgard and Dafoe2008). Form is also influenced by density: at low A. virens density (five individuals per m−2), burrows are mostly U- or Y- shaped, while at high density (20 individuals per m−2) I- and L-forms are dominant (Miron et al., Reference Miron, Desrosiers, Retière and Lambert1991b).
From the 2-D images obtained, we determined the number, diameter and space occupied by individual burrow shafts, as well as their spatial coordinates, at different depths within the cores. The total abundance and average diameter of burrow shafts were similar between sites. Overall, both the number of burrow shafts and percentage biogenic space decreased significantly with depth (Figure 5; Table 1), as observed previously (Mermillod-Blondin et al., Reference Mermillod-Blondin, Marie, Desrosiers, Long, de Montety, Michaud and Stora2003; Michaud et al., Reference Michaud, Desrosiers, Long, de Montety, Crémer, Pelletier, Locat, Gilbert and Stora2003; Rosenberg et al., Reference Rosenberg, Davey, Gunnarsson, Norling and Frank2007, Reference Rosenberg, Grémare, Duchêne, Davey and Frank2008); this is caused by both branching pattern (most forms have more shafts near the surface than at depth) and the presence of numerous short burrows. The average diameter of burrow shafts peaked at roughly 70 mm depth, likely due to the junction between branches in Y or multi-branched structures being larger in cross-section.
The 2-D images obtained by CT-scanning also allowed us to investigate the spatial distribution of burrow shafts at different depths within the sediment. At both sites, R values were relatively constant with depth (Figure 6), suggesting that the mechanisms leading to spatial patterning operate not only at the surface, but also within the sediment. Recent studies have documented pore-water pressure changes induced by the burrowing and irrigation activities of infaunal organisms; the sensing of characteristic pressure signals has been suggested as a potential mechanism for detecting competitors within the sediment (Wethey & Woodin, Reference Wethey and Woodin2005). Alitta virens is sensitive to vibrations in water (Andzhon & Popov, Reference Andzhon and Popov1979); similarly, pore-water pressure detection may drive spatial patterns within sediments.
The R index used here has certain weaknesses: the spatial scale chosen can influence the discrimination between random and aggregated distributions, and is more appropriate when comparing large numbers of points (Andrew & Mapstone, Reference Andrew and Mapstone1987). Nonetheless, this index revealed differences in small-scale spatial patterns in burrow distributions between the study sites. The development of more complex indices for CT-scan, defining spatial distribution patterns in three dimensions, would be useful.
Burrow volume, both total (TBV) and considering only surface-linked structures (SLBV) could readily be determined from the CT-scanning data. However, determining SLBV was more challenging (and likely underestimated) because: (1) some burrows were seen to continue beyond the edge of the core, and therefore incomplete burrows were sampled (and likewise, some of the burrows assumed to be relict may have been be linked to the surface, beyond the core boundary); and (2) several burrows seemed to be obstructed near the sediment surface, possibly due to the activity of other bioturbating organisms, or related to sampling protocol. Nonetheless, biogenic volumes (or estimations thereof) can easily be obtained, and compared, using CT-scan data. Rosenberg et al. (Reference Rosenberg, Grémare, Duchêne, Davey and Frank2008) estimated a SLBV of 560 cm3.m−2 for a subtidal benthic community dominated by Amphiura filiformis Müller 1776. This value is similar to the mean SLBV in Paspébiac and is one-third of the mean in St-Siméon (1729 cm3.m−2), reflecting how A. virens can greatly (and variably) impact and structure intertidal sediments.
Differences in Alitta virens burrows within and between sites
We had hypothesized that burrow characteristics would not differ significantly within a site. However, the number and diameter of shafts, percentage biogenic space, and R varied significantly among cores within a site, indicating significant patchiness at a decimetre to metre scale. For those same variables, ANCOVA results indicated that site effects were not significant; however, depth relationships of each of these variables, as seen in Figures 5 and 6, clearly show site-specific patterns (except for shaft diameter). Most likely, the ANCOVAs could not uncover inter-site differences because the curves intersected and crossed over at approximately 70 mm depth. Regardless (at least in the upper sediment column), burrow shafts were clearly more abundant and occupied more space at the more sheltered site, St-Siméon. We argue, therefore, that there were large-scale (site-specific) differences in most burrow characters, with the exception of shaft diameter. The relative thickness of habitable space, sediment characters, and possible differences in Alitta virens populations may have led to the observed differences.
The Clark & Evans R values indicated that burrow shafts were more randomly distributed at Paspébiac, and were more evenly distributed (i.e. maximally spaced) at St-Siméon, at all depths considered. The degree of spacing of burrow shafts within sediments may be influenced by how readily those sediments can transmit or propagate pore-water pressure signals. Additionally, the abundance of burrowing organisms on a small spatial scale (cm–dm) could impact distribution patterns through competitive or other interactions.
The discrepancy between TBV and SLBV was, in most cases, greater at Paspébiac (Table 2). The greater similarity between TBV and SLBV values in St-Siméon may be the result of greater sediment stability (and a better preservation of burrow orifices) at this site, possibly due to finer sediments increasing sediment cohesion. Alternatively, or additionally, a greater relative amount of SLBV in St-Siméon might be due to a greater number of burrow orifices at this site, as well as differences in burrow shape, size and distribution.
Usefulness of CT-scanning for studies of burrow structure
In this study, CT-scanning was successfully used to visualize the 3-D distribution of A. virens burrows and to study both sediment (i.e. TI) and burrow parameters in sediment cores. The TI of sediments was correlated with the number of burrow shafts, the biogenic space occupied, and sediment organic matter content. TI could, therefore, be a good descriptor of sediment characteristics of importance for biological processes. We also showed that CT-scanning is useful to investigate spatial patterns in biogenic spatial organization within sediments (in our case, using the R index), as well as to determine the biovolume and surface area occupied by biogenic structures. Beyond the usefulness of those measures in comparative studies, such metrics can (and should) be used to calibrate bioturbation models.
The small-scale variability observed here reinforces the need for replication in CT-scan studies, as suggested by Michaud et al. (Reference Michaud, Desrosiers, Long, de Montety, Crémer, Pelletier, Locat, Gilbert and Stora2003). Ideally, larger cores should be collected for CT-scan analyses, particularly for studies of spatial patterns in relatively large organisms such as Alitta virens. Investigating further sites could also help us better understand the factors that drive spatial patterning in A. virens.
ACKNOWLEDGEMENTS
The authors thank B. Long, Institut National de la Recherche Scientifique–Eau Terre Environnement in Québec City for access to the CT-scanner and LIDAR images. J.C. Brêthes, A. Medina and J.C. Boudouresque provided comments and assistance.
FINANCIAL SUPPORT
This work was supported by a grant from the Natural Sciences and Engineering Research Council of Canada (G.D.). F.S. was supported through a CREPUQ exchange programme in collaboration with Université Aix-Marseille II.