





Introduction
Hallucinatory phenomena are involuntary sensory experiences occurring without external stimuli (Nazimek, Hunter, & Woodruff, Reference Nazimek, Hunter and Woodruff2012). Auditory verbal hallucinations (AVHs), the perceptual experience of hearing speech in the absence of an external source (Moseley, Fernyhough, & Ellison, Reference Moseley, Fernyhough and Ellison2013), affect 60%–80% of people with schizophrenia (Waters et al., Reference Waters, Allen, Aleman, Fernyhough, Woodward, Badcock, Barkus, Johns, Varese, Menon, Vercammen and Larøi2012). However, hallucinatory experiences (HEs) are transdiagnostic (Rollins et al., Reference Rollins, Garrison, Simons, Rowe, O’Callaghan, Murray and Suckling2019; Waters & Fernyhough, Reference Waters and Fernyhough2017), occurring in a minority of the general population without psychiatric diagnosis (Hill & Linden, Reference Hill, Linden, Jardri, Cachia, Thomas and Pins2013; Linszen et al., Reference Linszen, de Boer, Schutte, Begemann, de Vries, Koops, Blom, Bohlken, Heringa, Blom and Sommer2022), of whom 39% require no intervention (Romme & Escher, Reference Romme and Escher1989). A dimensional model has been proposed, positioning hallucinations along a continuum (Os et al., Reference Os, Linscott, Myin-Germeys, Delespaul and Krabbendam2009; van Os, Hanssen, Bijl, & Ravelli, Reference van Os, Hanssen, Bijl and Ravelli2000) from clinical to nonclinical experiences, differing in severity, distress, and impairment (Waters & Fernyhough, Reference Waters and Fernyhough2019).
Perception and top-down processes
Contemporary cognitive models argue perception does not reflect reality; rather it is shaped by top-down processes, modulated by arousal, attention, and prior beliefs (Montemayor & Haladjian, Reference Montemayor and Haladjian2017; Powers, Kelley, & Corlett, Reference Powers, Kelley and Corlett2016). Reliance on top-down processes may increase the likelihood perceptual judgments are driven by cognitive biases rather than environmental evidence (Stokes, Reference Stokes2012; Vetter & Newen, Reference Vetter and Newen2014). Overreliance on these processes, especially when influenced by preexisting cognitive biases, increases susceptibility to perceptual errors, such as hallucinations (Rodriguez-Sanchez, Oloye, Martin, & Hauke, Reference Rodriguez-Sanchez, Oloye, Martin and Hauke2023). Observing responses to ambiguous auditory environments is one way to study such susceptibility, and auditory-verbal signal detection tasks (AV-SDTs) provide a controlled, well-established method for examining perceptual decision making.
In AV-SDTs, participants judge whether a near-auditory-threshold voice is present within background noise, producing four key parameters: hit rate – proportion of voice-present trials correctly detected; false alarm rate – proportion of noise-only trials incorrectly judged as containing a voice; these parameters are then used to calculate perceptual sensitivity – the ability to distinguish between voice-present and voice-absent trials; and response bias – the propensity to say ‘voice present’. These standardized metrics are a strength of the AV-SDT paradigm, allowing direct comparability of outcomes across studies.
AV-SDTs have been widely used to investigate mechanisms underlying hallucinations; researchers suggest these tasks varyingly measure reality discrimination, source monitoring, inner speech, or externalizing bias (Anderson, Hartley, & Bucci, Reference Anderson, Hartley and Bucci2021; Barkus et al., Reference Barkus, Stirling, Hopkins, McKie and Lewis2007; Bentall & Slade, Reference Bentall and Slade1985a; Li et al., Reference Li, Chen, Yang, Chen and Tsay2002). Despite variation in interpretation, these all fall within top-down perceptual processing frameworks, with higher-order cognitive mechanisms shaping the integration of sensory input.
Hallucinations research using AV-SDTs suggests clinical hallucinations are associated with a liberal response bias (i.e. an increased likelihood for patients to indicate they hear a voice in task trials, regardless of whether a voice signal is presented) (Bentall & Slade, Reference Bentall and Slade1985a; Chhabra et al., Reference Chhabra, Sowmya, Sreeraj, Kalmady, Shivakumar, Amaresha, Narayanaswamy and Venkatasubramanian2016). In contrast, findings for nonclinical samples, and perceptual sensitivity, remain mixed (Laloyaux et al., Reference Laloyaux, Hirnstein, Specht, Giersch and Larøi2022; Li et al., Reference Li, Yang, Chen, Chen and Liu2003; Vercammen, de Haan, & Aleman, Reference Vercammen, de Haan and Aleman2008). A decade-old meta-analysis has previously examined the link between hallucinations and AV-SDTs (Brookwell, Bentall, & Varese, Reference Brookwell, Bentall and Varese2013); however, it considered associations between externalizing bias and performance across multiple tasks, including an AV-SDT and two additional paradigms. Consequently, its focus and comparisons differ from the present meta-analysis. Since then, numerous additional studies have been conducted, including one based on a large dataset (Moseley et al., Reference Moseley, Aleman, Allen, Bell, Bless, Bortolon, Cella, Garrison, Hugdahl, Kozáková, Larøi, Moffatt, Say, Smailes, Suzuki, Toh, Woodward, Zaytseva and Fernyhough2021), warranting an updated synthesis. The present meta-analysis provides a contemporary, quantitative review specifically to synthesize the findings from AV-SDTs for all hallucination research since 1985.
Focusing specifically on AV-SDTs allows for rigorous assessment of consistency and reliability across studies, clarifying whether observed effects reflect robust phenomena rather than task-specific variability. This is particularly important given reported differences between clinical and nonclinical hallucination-prone populations (Barkus et al., Reference Barkus, Stirling, Hopkins, McKie and Lewis2007; Bentall & Slade, Reference Bentall and Slade1985a; Bristow et al., Reference Bristow, Tabraham, Smedley, Ward and Peters2014; Moseley et al., Reference Moseley, Alderson-Day, Common, Dodgson, Lee, Mitrenga, Moffatt and Fernyhough2022; Rankin & O’Carroll, Reference Rankin and O’Carroll1995), contributing to the debates surrounding dimensional versus categorical views of psychosis. Accordingly, subgroup analyses for clinical and nonclinical populations will be conducted. Note, here, we use the terms ‘hallucination-prone’ or ‘nonclinical hallucinations’ to refer to nonclinical studies assessing hallucinations using self-report questionnaires such as the Launay–Slade hallucination scale (LSHS) (Launay & Slade, Reference Launay and Slade1981), and the phrase ‘hallucinating versus non-hallucinating’ participants for clinical populations. This meta-analysis has two main aims: (i) to investigate whether there is an association between the presence of hallucinations in people with a psychiatric diagnosis and performance on AV-SDTs; and (ii) to investigate whether there is an association between reports of HEs in nonclinical populations and performance on AV-SDTs. While previous literature suggests liberal response biases are associated with hallucinations, due to the anticipated heterogeneity of existing findings and limited prior synthesis within this area, this meta-analysis has an exploratory aim. No specific a priori hypotheses were formulated.
Method
Open science/preregistration
The current review followed Moher et al.’s (Reference Moher, Liberati, Tetzlaff and Altman2009) Preferred Reporting Items for Systematic Reviews and Meta-Analyses (PRISMA) guidelines. The study protocol was registered in June 2022 (PROSPERO: CRD 42022342694). The supporting documents and Supplementary Materials were accessed via the Open Science Framework: https://osf.io/mt9vu/overview.
Search criteria
A database search was conducted on SCOPUS, Web of Science, and PubMed for reports available between January 1985 and April 2025. For a summary see Figure 1 (see Supplementary Materials for full search strategy). Follow-up searches in SCOPUS identified additional studies through author searches and reference screening. Further, first and last authors of all included studies were contacted to identify any relevant published or unpublished work for inclusion.
PRISMA flow diagram of database and other methods searches. Note: The following eight studies met initial inclusion criteria but were omitted from synthesis after full texts were screened due to lack of an appropriate control group (e.g. comparison between clinical hallucinators and healthy nonclinical, non–voice-hearing controls) (Chhabra et al., Reference Chhabra, Sowmya, Sreeraj, Kalmady, Shivakumar, Amaresha, Narayanaswamy and Venkatasubramanian2016, Reference Chhabra, Selvaraj, Sreeraj, Damodharan, Shivakumar, Kumar, Narayanaswamy and Venkatasubramanian2022; Moseley et al., Reference Moseley, Alderson-Day, Common, Dodgson, Lee, Mitrenga, Moffatt and Fernyhough2022 [study 1]); the inclusion of other confounding variables within the signal detection analysis (i.e. hallucinations and intrusive thoughts (Smailes, Meins, & Fernyhough, Reference Smailes, Meins and Fernyhough2014); multiple differences in AV-SDT design (e.g. where tasks required word recognition) (Moseley, Smailes, Ellison, & Fernyhough, Reference Moseley, Smailes, Ellison and Fernyhough2016; Vercammen et al., Reference Vercammen, de Haan and Aleman2008); and studies did not report specific signal detection outcomes (Horga, Schatz, Abi-Dargham, & Peterson, Reference Horga, Schatz, Abi-Dargham and Peterson2014; Li et al., Reference Li, Yang, Chen, Chen and Liu2003).

Figure 1. Long description
The flowchart is organized into three vertical phases: Identification, Screening, and Included.
1. Identification Phase:
* Left Column (Databases): Records identified from Primary Database Search (n = 4135) and Secondary Database Searches (April 2024 n = 589; April 2025 n = 214). A box to the right lists search terms including ‘hallucinat*’, ‘voice-hearing’, and ‘signal detection’. Below this, 550 duplicate records were removed (491 from primary, 59 from secondary).
* Right Column (Other Methods): Records identified from Citation searching (n = 296), Secondary author searches (n = 3274), and Contacting authors (n = 2).
2. Screening Phase:
* Left Column: 4388 records screened, leading to 4376 exclusions (4354 titles, 22 abstracts). 12 reports were sought for retrieval and all 12 were assessed for eligibility. 5 reports were excluded due to group differences (n = 1), no pure A V - S D T (n = 2), or missing S D data (n = 2).
* Right Column: 3571 reports screened, leading to 3562 exclusions (3528 titles, 34 abstracts). 10 reports were assessed for eligibility, with 3 excluded for the same reasons as the left column.
3. Included Phase:
* Arrows from both columns converge at the bottom into a final box: Published reports (n = 12), Unpublished data sets (n = 2), and Studies included in review (n = 15).
Studies were eligible if they:
-
• were written in English;
-
• examined the relationship between hallucinations or hallucination-proneness and signal detection using AV-SDTs;
-
• used between-group or correlational designs; and,
-
• in the case of between-group designs, clearly compared hallucination-prone and appropriate nonprone groups (e.g. comparisons of psychosis patients with versus without hallucinations were eligible, but comparisons of patients with hallucinations versus nonpatients without hallucinations were not eligible).
AV-SDTs were defined as tasks assessing signal detection accuracy, discriminating the presence or absence of a signal within auditory noise, via (i) perceptual sensitivity (i.e. d′ or P(A)), (ii) response bias (i.e. β, β” or C), and, where available, (iii) false alarm and hit rates.
Studies were excluded if they (i) were not pure AV-SDTs (e.g. included additional task demands); (ii) lacked essential data (i.e. none of the following parameters were reported: false alarm and/or hit rates, perceptual sensitivity (d′ or P(A)), or response bias (β, β” or C); (iii) did not explicitly assess hallucinations; (iv) were qualitative, descriptive, non–peer reviewed, conference abstracts, reviews, reanalyses, case studies, or theoretical/philosophical papers; or (iv) were duplicates. Two deviations from preregistration were applied: studies were excluded if (i) hallucinations were not ‘organic’ in nature (i.e. drug, sleep deprivation or illness induced); and (ii) if the signal was not verbal (i.e. not spoken voice).
Titles and abstracts were screened in Rayyan (Ouzzani, Hammady, Fedorowicz, & Elmagarmid, Reference Ouzzani, Hammady, Fedorowicz and Elmagarmid2016) by blinded reviewers (RMB, EB), with full texts retrieved for eligible or uncertain studies. Disagreements were resolved with a third reviewer (PM). Data extraction was performed independently and in duplicate (RMB all studies; EB and PM splitting duplicates). A standardized form recorded study/participant characteristics, hallucinatory measures, AV-SDT design, and statistics for effect size calculation.
Effect size computation and integration method
Analyses were conducted in R (Meta v7.0–0; Metafor v4.6–0). Generative AI (ChatGPT; OpenAI, San Francisco, CA) was used solely to assist with debugging R scripts and was not used to generate analytic decisions, interpret findings, or to write or revise the manuscript. Hedges’ g (Lin & Aloe, Reference Lin and Aloe2021) was used for effect sizes, computed with the effsize package v0.8.1 from sample sizes, means and SDs (group studies), or correlation coefficients (correlational studies). Interpretation followed Cohen’s (Reference Cohen1992) thresholds (small ≤0.20; medium ≤0.50; large ≤0.80). Prediction intervals (PIs) were calculated using the t-distribution (Higgins, Thompson, & Spiegelhalter, Reference Higgins, Thompson and Spiegelhalter2009). Significance was set at p < .05. For group designs, only hallucinating versus nonhallucinating contrasts were analyzed in clinical samples, and low versus high hallucination-prone contrasts in nonclinical samples.
Given expected heterogeneity, random-effects models were applied, with Hartung–Knapp adjustments for pooled confidence intervals (Hartung & Knapp, Reference Hartung and Knapp2001). Separate summary effects were estimated for hit rate, false alarm rate, perceptual sensitivity (d′ or P(A)), and response bias (β or c), followed by subgroup analyses for clinical versus nonclinical samples.
Heterogeneity was assessed using the Q-test, I 2 (Higgins, Thompson, Deeks, & Altman, Reference Higgins, Thompson, Deeks and Altman2003), and τ 2 via restricted maximum likelihood. Publication bias was evaluated using funnel plots and Egger’s test (Egger, Davey Smith, Schneider, & Minder, Reference Egger, Davey Smith, Schneider and Minder1997), with Duval–Tweedie Trim and Fill (Duval & Tweedie, Reference Duval and Tweedie2000) applied where bias was evident. Influence was examined by influence diagnostics and, if warranted, ‘leave-one-out’ analyses were used.
Quality assessment
Study quality was assessed using the appraisal tool for cross-sectional studies (AXIS) (Downes, Brennan, Williams, & Dean, Reference Downes, Brennan, Williams and Dean2016), which was selected for its suitability in addressing the methodological diversity of observational designs (Losilla, Oliveras, Marin-Garcia, & Vives, Reference Losilla, Oliveras, Marin-Garcia and Vives2018; Ma et al., Reference Ma, Wang, Yang, Huang, Weng and Zeng2020). AXIS comprises 20 items across reporting quality (7), study design (7), and risk of bias (6). All included studies were appraised by RMB (see Supplementary Materials).
Results
Initial database searches were conducted on July 19, 2022 and updated on April 24, 2024 and April 15, 2025 to capture newly published studies. Figure 1 summarizes the search and selection process. Corresponding authors were contacted to request unpublished data, clarify methods, or supply missing information essential for this meta-analysis. This yielded two unpublished datasets (Alderson-Day (Reference Alderson-Day2019); Bell et al., (Reference Bell, Toh, Moseley, Smailes and Rossellunpublished)) and additional details for two previously identified studies (Barkus et al. (Reference Barkus, Stirling, Hopkins, McKie and Lewis2007) (In the original study participants were subdivided into three groups based on high, around the mean or low for both ‘positive’ schizotypy scores (measured by Oxford Liverpool Inventory of Feelings and Experiences (Mason, Claridge, & Jackson, Reference Mason, Claridge and Jackson1995)) and reported HEs (measured by LSHS (Launay & Slade, Reference Launay and Slade1981)). Study data were requested to perform correlational analysis. The decision to treat data as correlational (as opposed to group) was based on the value of retaining all data from the original study (i.e. retaining the mean group). Only results derived from the LSHS were included, to capture hallucination-proneness and be consistent with other studies in the review); and Smailes, Meins, and Fernyhough (Reference Smailes, Meins and Fernyhough2015) (In the original study, effect sizes for the association between HEs and AV-SDT performance were not reported)). Abstract screening agreement between the two reviewers was almost perfect, κ = .92 (99.96% agreement).
Following full-text screening, 22 records met the initial inclusion criteria outlined above. However, several records were omitted from data synthesis. The reasons for the exclusions are detailed in Figure 1. Following these exclusions, a final total of 15 studies were identified for inclusion in this review. Where included studies followed repeated-measure designs, only results taken from the initial run of the task were included. For results using unpublished data, Spearman’s ρ was calculated to assess the association between HEs and AV-SDT performance. No data transformations for signal detection outcomes (hit rate, false alarm rate, perceptual sensitivity, and response bias) were applied (all signal detection outcomes were calculated by the corresponding authors (Barkus et al., Reference Barkus, Stirling, Hopkins, McKie and Lewis2007; Smailes et al., Reference Smailes, Meins and Fernyhough2015; Alderson-Day, (Reference Alderson-Day2019))). Table 1 summarizes the key features of the study design, location, and sample characteristics of included studies. All included studies were in English. Individual study effect sizes are detailed in the Supplementary Materials.
Characteristics of included studies within the meta-analytical models

Table 1. Long description
The table contains nine columns: Author, Year; Country; Study design; Sample; N; M age (S D); Gender (% female); Hallucinatory measure; and Reported theoretical paradigm.
Key entries include:
* Alderson-day (unpublished), UK, Correlation, Nonclinical, N=95, M age 21.37.
* Alganami et al. (2017), UK, Group High vs low H E, Nonclinical, N=62, M age 21.06, Source-monitoring paradigm.
* Barkus et al. (2007), UK, Correlation, Nonclinical, N=62, M age 23.95, Inner speech paradigm.
* Barkus et al. (2011), UK, Group High vs Low U E, Nonclinical, N=55, Responding biases paradigm.
* Bell et al. (unpublished), Australia, Group A V H vs no A V H, Clinical, N=39.
* Bentall and Slade (1985a), UK, two groups: Clinical (N=20, M age 38.71) and Nonclinical (N=20, M age 19.13), Reality testing paradigm.
* Bristow et al. (Reference Bristow, Tabraham, Smedley, Ward and Peters2014), UK, Group A V H vs no A V H, Clinical, N=98, M age 36.83, Reality discrimination paradigm.
* Moseley et al. (2021), Multi-country, Correlation, Nonclinical, N=583, M age 29.40, Top-down processing paradigm.
* Moseley et al. (2022), UK, Group A V H vs no A V H, Nonclinical, N=54, M age 58.70.
* Rankin and O’Carroll (1995), UK, Group High vs low H E, Nonclinical, N=30, M age 25.4.
* Smailes et al. (2015), UK, Correlation, Nonclinical, N=153, M age 21.09, Reality discrimination paradigm.
* Strawson et al. (2022), UK, Correlation, Clinical, N=22, M age 33, Externalising biases paradigm.
* Varese et al. (2011), UK, Group High vs low H E, Nonclinical, N=67, M age 21.63.
* Varese et al. (2012), UK, Group A V H vs no A V H, Clinical, N=31, M age 46.99.
Hallucinatory measures include L S H S, L S H S dash R, O dash Life, M H S, S A P S, C A P S, B S I S dash V, and S C I dash P A N S S.
Note: HE, hallucinatory experiences; UE, unusual experiences; AVH, auditory verbal hallucination; BSIS-V, brief symptom impact scale-voices (Strawson et al., Reference Strawson, Wang, Quadt, Sherman, Larsson, Davies, Mckeown, Silva, Fielding-Smith, Jones, Hayward, Smallwood, Critchley and Garfinkel2022); CAPS, The Cardiff anomalous perceptions scale (Bell, Halligan, & Ellis, Reference Bell, Halligan and Ellis2006); LSHS, Launay–Slade hallucinations scale (Launay & Slade, Reference Launay and Slade1981; LSHS-A, Launay–Slade hallucinations scale-A Bentall & Slade, Reference Bentall and Slade1985b); LSHS-R (Morrison, Wells, & Nothard, Reference Morrison, Wells and Nothard2000); Modified LSHS-R (McCarthy-Jones & Fernyhough, Reference McCarthy-Jones and Fernyhough2011); MHS, multimodal hallucinations schedule (Bell et al., Reference Bell, Toh, Moseley, Smailes and Rossellunpublished)); O-Life, Oxford Liverpool inventory of feelings and experiences (Mason et al., Reference Mason, Claridge and Jackson1995; SAPS, scale for the assessment of positive symptoms (Andreasen, Reference Andreasen1984); SCI-PANSS, positive and negative symptom scale (Kay, Opler, & Lindenmayer, Reference Kay, Opler and Lindenmayer1989).
a This is the measure used within studies to either group participants or provide an overall score of hallucination in correlational studies. It is noted that some studies also include secondary measures of hallucination, but these are not reported here.
b 9-item scale, 5-item auditory subscale only.
Demographic characteristics
Eligible studies comprised a total of 1,391 participants. Based on the available data, 688 were women and 489 were men (these totals do not sum the full sample size as some papers did not specify sex). Mean age, calculated from the available data, was 29.49 years (SD = 8.80). Two studies did not contribute age data (Barkus et al., Reference Barkus, Smallman, Royle, Barkus, Lewis and Rushe2011; Bell et al., (Reference Bell, Toh, Moseley, Smailes and Rossellunpublished)), and three studies did not contribute sex data (Barkus et al., Reference Barkus, Smallman, Royle, Barkus, Lewis and Rushe2011; Rankin & O’Carroll, Reference Rankin and O’Carroll1995; Bell et al., (Reference Bell, Toh, Moseley, Smailes and Rossellunpublished)). It should be noted that Barkus et al. (Reference Barkus, Smallman, Royle, Barkus, Lewis and Rushe2011) reported demographic characteristics for the full original sample, the present study included only a subset of participants from that dataset, and corresponding age and sex for that subset could not be determined. In total, 10 studies presented data from nonclinical populations (n = 1,181) and 5 studies from patient groups (n = 210).
Auditory-verbal hallucination status
HEs were evaluated using several measures across studies (see Table 1). While the included nonclinical studies used a version of the Launay–Slade hallucination scale (LSHS; Bentall & Slade, Reference Bentall and Slade1985b; Launay & Slade, Reference Launay and Slade1981; Morrison et al., Reference Morrison, Wells and Nothard2000; n = 8); the Oxford–Liverpool Inventory of Feelings and Experiences (O-Life; Mason et al., Reference Mason, Claridge and Jackson1995; n = 1); or the Cardiff anomalous perceptions scale (CAPS) (Bell et al., Reference Bell, Halligan and Ellis2006) (n = 2), no two clinical studies used the same methodology of assessing HEs. Furthermore, defining cutoffs for high versus low hallucinators varies across studies; for example, general population studies comparing performance across groups used the LSHS to group participants: either by an arbitrary selection of either the highest versus lowest scorers (Bentall & Slade, Reference Bentall and Slade1985a; Rankin & O’Carroll, Reference Rankin and O’Carroll1995); an upper and lower tertile split (Alganami et al., Reference Alganami, Varese, Wagstaff and Bentall2017; Barkus et al., Reference Barkus, Smallman, Royle, Barkus, Lewis and Rushe2011; Varese et al., Reference Varese, Barkus and Bentall2011); or, simply to quantify participants HEs, after the study cohort had already been screened and grouped by the study researchers (Moseley et al., Reference Moseley, Alderson-Day, Common, Dodgson, Lee, Mitrenga, Moffatt and Fernyhough2022).
AV-SDT design
See the Supplementary Materials for details of individual study AV-SDT designs. Notably, several published studies omit details of the task administration and instruction. Several studies incompletely report AV-SDT procedures, including participant instructions, practice trials, and signal frequency information. Furthermore, reporting details of the task design also varied across studies, and details such as the language of the spoken voice and voice duration were underreported. All published studies reported the number of trials included per run (mean = 66.83), ratio of noise to noise-and-signal trials (mean ratio = 44:56), and duration of the noise presentation for each trial (mean duration = 4.46secs).
HEs and AV-SDT performance
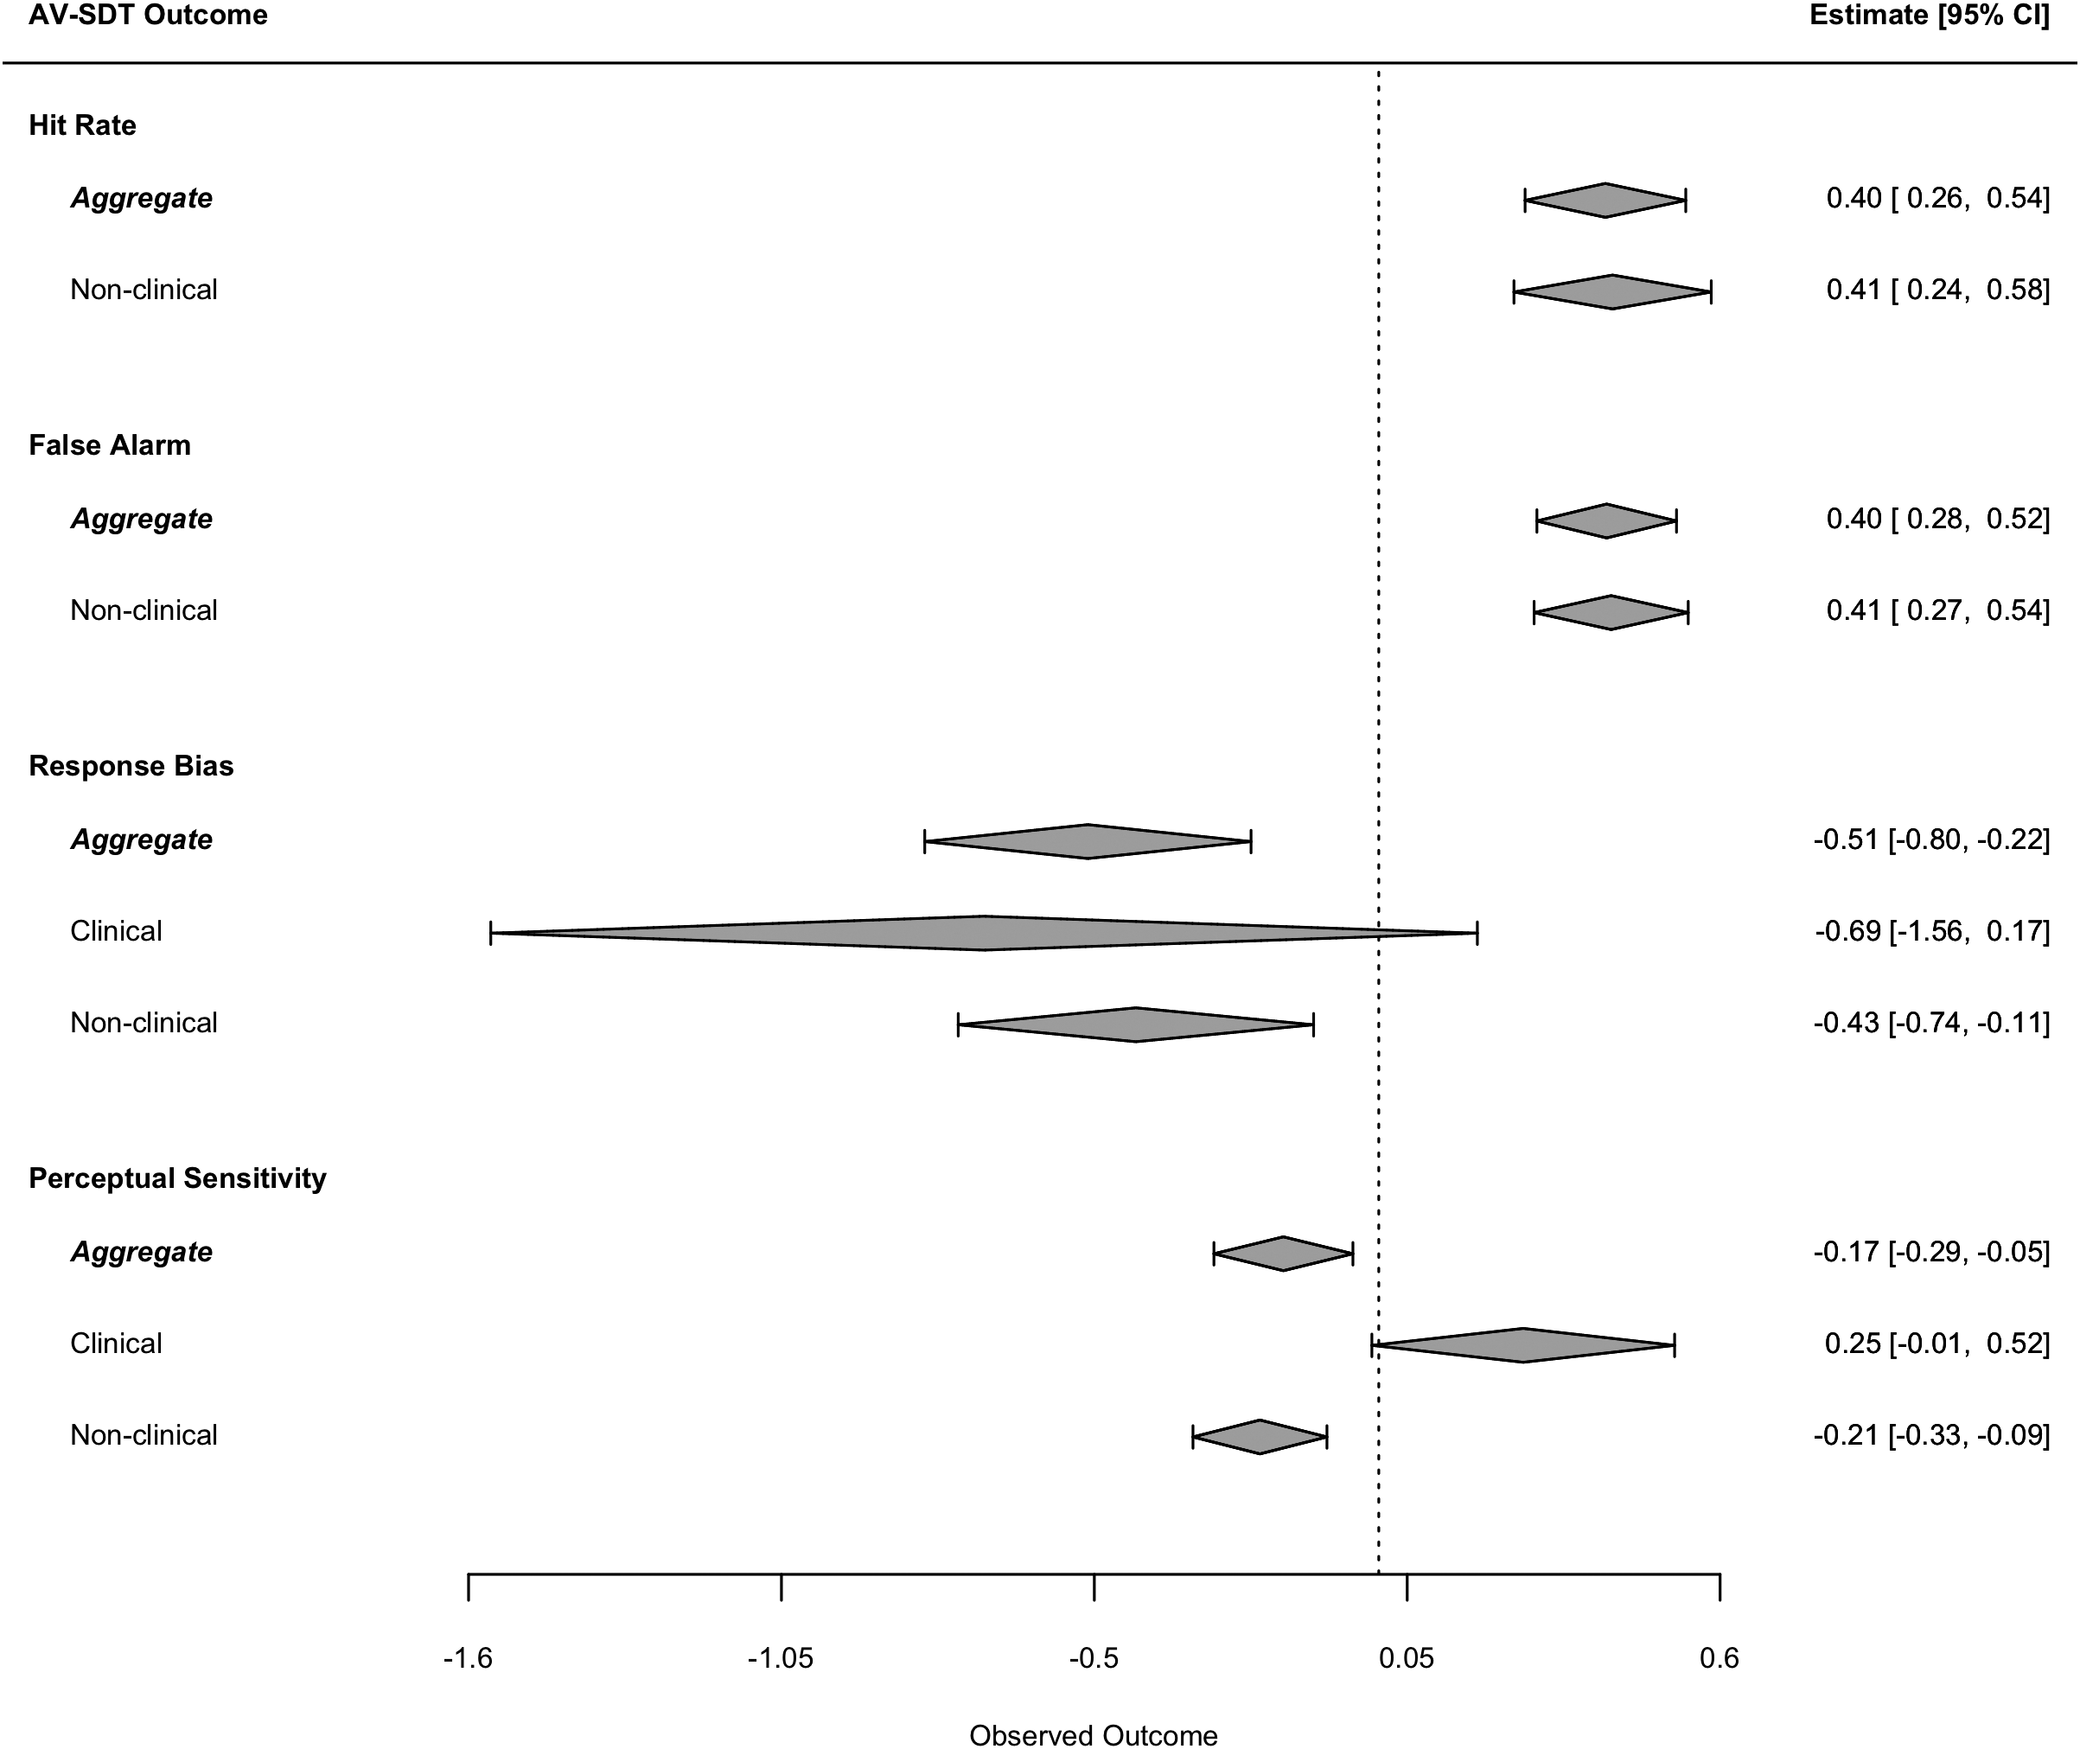
A summary of all analyses for both main and within subgroup associations between HEs and AV-SDT performance is presented in Table 2. Summary forest plots of all study main and subgroups effects are displayed in Figure 2.
Effect sizes for the aggregated and subgroup (clinical versus nonclinical) analyses, stratified by AV-SDT parameter (hit rate, false alarm rate, perceptual sensitivity, or response bias)

Table 2. Long description
The table consists of seven columns: Outcome, Model, k, g (95% C I, p) [Meta-analysis], tau super 2 (L L, U L) [Meta-analysis], I super 2 (L L, U L) [Meta-analysis], and beta sub 0 (95% C I), t(d f), p [Publication bias].
* False alarm rate: Aggregate (k=8, g=0.40, p < .001); Clinical (k=1, no data); Nonclinical (k=7, g=0.41, p < .001).
* Hit rate: Aggregate (k=6, g=0.40, p < .001); Clinical (k=1, no data); Nonclinical (k=5, g=0.41, p = .003).
* Perceptual sensitivity: Aggregate (k=13, g=-0.16, p = .038); Clinical (k=4, g=0.37, p = .050); Nonclinical (k=9, g=-0.17, p = .004).
* Response bias: Aggregate (k=15, g=-0.56, p = .001); Clinical (k=5, g=-0.88, p = .026); Nonclinical (k=10, g=-0.43, p = .013).
Publication bias for Response bias Aggregate shows beta sub 0 = -1.21, t(14) = -1.96, p = .073. Heterogeneity (I super 2) is highest for Response bias at 62.7% for the aggregate model.
Note: CI, confidence interval; LL, lower limit; UL, upper limit; and df, degrees of freedom.
Summary forest plot of the pooled random effects aggregate and subgroup (clinical and nonclinical) analyses for the association between hallucinatory experiences and AV-SDT outcomes. CI, Confidence interval. Note: Only aggregate and nonclinical subgroup effects are reported for false alarm and hit rate because, to date, only one clinical study has published these specific findings.

Figure 2. Long description
The forest plot displays observed outcomes on an x-axis ranging from negative 1.6 to 0.6, with a vertical dashed line at zero.
1. Hit Rate section.
- Aggregate: Diamond centered at 0.40 with a 95% C I of 0.26 to 0.54.
- Non-clinical: Diamond centered at 0.41 with a 95% C I of 0.24 to 0.58.
2. False Alarm section.
- Aggregate: Diamond centered at 0.40 with a 95% C I of 0.28 to 0.52.
- Non-clinical: Diamond centered at 0.41 with a 95% C I of 0.27 to 0.54.
3. Response Bias section.
- Aggregate: Diamond centered at negative 0.51 with a 95% C I of negative 0.80 to negative 0.22.
- Clinical: Wide diamond centered at negative 0.69 with a 95% C I of negative 1.56 to 0.17, crossing the zero line.
- Non-clinical: Diamond centered at negative 0.43 with a 95% C I of negative 0.74 to negative 0.11.
4. Perceptual Sensitivity section.
- Aggregate: Diamond centered at negative 0.17 with a 95% C I of negative 0.29 to negative 0.05.
- Clinical: Diamond centered at 0.25 with a 95% C I of negative 0.01 to 0.52, touching the zero line.
- Non-clinical: Diamond centered at negative 0.21 with a 95% C I of negative 0.33 to negative 0.09.
Aggregate analyses revealed a significant, positive association between HEs and rates of responding (i.e. hit rate and false alarm rate) during AV-SDT trials. The PI indicates future single studies are unlikely to show negative associations (HEs and false alarm rate g = 0.13 to 0.67; HEs and hit rate g = 0.25 to 0.55).
To date, only one study of clinical populations has detailed participant AV-SDT hit and false alarm rates. Consequently, only subgroup analyses of nonclinical associations are reported for these parameters. These analyses revealed a significant, positive association between nonclinical HEs and both hit rate and false alarm rate during AV-SDT trials. Between-study heterogeneity was low, and the PIs suggest future single studies are unlikely to show negative associations for either outcome (false alarm rate g = 0.11 to 0.70; hit rate g = 0.20 to 0.62).
Due to convergence issues within the data set, τ 2 was estimated using the DerSimonian–Laird method for the following associations.
HEs and perceptual sensitivity
The results show a significant negative association between HEs and perceptual sensitivity in aggregate and nonclinical models, but not in the clinical subgroup. Subgroup effects differed significantly (Q(1) = 18.94, p < .001). Between-study heterogeneity was low. The PIs indicate considerable heterogeneity across future studies. For both the aggregate (g = −0.41 to 0.10) and clinical models (g = −0.29 to 1.03), the intervals include both positive and negative values, implying future studies may plausibly yield effects in either direction. In contrast, the PI for nonclinical studies (g = −0.28 to −0.07) lies entirely below zero, suggesting consistently negative effects.
HEs and response bias
Results show HEs were negatively associated with response bias in aggregate and subgroup models. Subgroup differences were nonsignificant (Q(1) = 2.43, p = 0.119). Between study heterogeneity was high and PIs indicate substantial heterogeneity across future studies. For all study models (aggregate [g = −1.40 to 0.27], clinical [g = −2.29 to 0.53], and nonclinical [g = −1.13 to 0.27]), the intervals spanned both negative and positive values, suggesting future studies could plausibly observe effects in either direction.
Influence and sensitivity assessment
Outliers were revealed in both the aggregate (n = 2) and nonclinical subgroup (n = 1) models for HEs and response bias. Excluding the study outliers did not significantly influence the aggregate model (omitting Strawson et al. (Reference Strawson, Wang, Quadt, Sherman, Larsson, Davies, Mckeown, Silva, Fielding-Smith, Jones, Hayward, Smallwood, Critchley and Garfinkel2022) and Barkus et al. (Reference Barkus, Stirling, Hopkins, McKie and Lewis2007): k = 13, g = −0.46 (95% CI: −0.60, −0.31), p < .001; τ 2 = 0.01(95% CI: 0.00, 0.35), and I 2 = 18.9% (95% CI: 0.0%, 57.1%); but it did substantially influence the observed probability of the nonclinical subgroup model (k = 9, g = −0.44 (95% CI: −0.61, −0.27), p < .001; τ 2 = 0.01(95% CI: 0.00, 0.69), and I 2 = 31.4% (95% CI = 0.0%, 68.3%). No other outliers were found in any other model.
An additional sensitivity analysis was conducted which examined the potential influence of small-sample effects. Studies with hallucinating-group sample sizes ≤20 were excluded from between-group analyses of HEs and response bias, while correlational studies were retained. Exclusion of these studies, alongside identified outliers (Strawson et al., Reference Strawson, Wang, Quadt, Sherman, Larsson, Davies, Mckeown, Silva, Fielding-Smith, Jones, Hayward, Smallwood, Critchley and Garfinkel2022 and Barkus et al., Reference Barkus, Stirling, Hopkins, McKie and Lewis2007), substantially influenced the aggregate model (k = 8, g = −0.39 [95% CI: −0.47, −0.31], p < .001; τ 2 = 0.00 [95% CI: 0.00, 0.02], I 2 = 0.0% [95% CI: 0.0%, 67.6%)]. The PIs suggest future individual studies are unlikely to demonstrate positive effects. Together, these findings indicate smaller cell size studies contribute to variability in the observed response bias effects although the overall direction of effects remains consistent with the primary analyses.
The results of leave-one-out sensitivity analysis where the omission of a study substantially increased study effects (>10% change) and reduced observed heterogeneity are listed in Supplementary Materials.
Quality assessment
See the Supplementary Materials for AXIS quality ratings for individual studies. Quality assessment followed recent reporting of AXIS ratings (studies which had a frequency of ‘Yes’ responses of ≥80% were rated as high quality; 60%–80% as moderate quality; and <60% as low quality). Most studies were rated moderate quality (n = 7), one was rated high quality, and the remaining studies were rated low quality (n = 5). Mean subscale scores across studies showed moderate quality rating of study design (mean score = 5.54) and reporting quality (mean score = 4.31), and low reporting quality of possible biases (mean score = 2.15). Several methodological aspects were consistently underreported across studies. Common weaknesses included inadequate reporting of sample justification, nonresponders, and response-rate bias, which substantially reduced AXIS ratings.
Discussion
Critically, this meta-analysis shows a liberal response bias during AV-SDTs associated with hallucinations, in both clinical and nonclinical groups. Nonclinical hallucinators also showed increased false alarm and hit rates, although underreporting of response frequencies in clinical studies limits generalization of this effect. Additionally, wide PIs indicate effect size estimates should be interpreted with caution. Additionally, HEs were linked to reduced perceptual sensitivity, but this association was negligible in clinical subgroups.
These results align with research demonstrating an association between overreporting of voices in noise and hallucinations (Barkus et al., Reference Barkus, Smallman, Royle, Barkus, Lewis and Rushe2011; Bentall & Slade, Reference Bentall and Slade1985a; Moseley et al., Reference Moseley, Aleman, Allen, Bell, Bless, Bortolon, Cella, Garrison, Hugdahl, Kozáková, Larøi, Moffatt, Say, Smailes, Suzuki, Toh, Woodward, Zaytseva and Fernyhough2021; Varese et al., Reference Varese, Barkus and Bentall2012). Although consistent with a previous meta-analysis by Brookwell et al. (Reference Brookwell, Bentall and Varese2013), in demonstrating an association between hallucinations or a tendency to hallucinate and response bias, the effect observed here is smaller, likely reflecting more recent datasets with larger sample sizes. Brookwell et al. (Reference Brookwell, Bentall and Varese2013) interpreted this effect as evidence for an externalizing bias (i.e. hallucinations result from a bias toward misattributing internally generated mental events to an external source), but our review highlights different authors interpreted findings from AV-SDTs as supporting inner speech, reality discrimination, or source monitoring difficulties. While biased AV-SDT performance likely broadly relates to the extent to which an individual relies on top-down processing in response to ambiguous stimuli, further studies are now needed to elucidate precisely if and how this relates to other cognitive processes.
Since findings for response bias were evident in both clinical and nonclinical groups, it suggests a shared perceptual bias, rather than discrete cognitive differences associated with pathological processes (Alderson-Day et al., Reference Alderson-Day, Lima, Evans, Krishnan, Shanmugalingam, Fernyhough and Scott2017; de Boer et al., Reference de Boer, Linszen, de Vries, Schutte, Begemann, Heringa, Bohlken, Hugdahl, Aleman, Wijnen and Sommer2019). This result challenges theories proposing psychiatric symptoms impair perceptual judgements beyond that experienced by nonclinical hallucinators (Powers, Mathys, & Corlett, Reference Powers, Mathys and Corlett2017).
The finding of reduced sensitivity in hallucinators implies for diminished discrimination for speech signals, contrasting earlier studies reporting no differences (Alganami et al., Reference Alganami, Varese, Wagstaff and Bentall2017; Barkus et al., Reference Barkus, Stirling, Hopkins, McKie and Lewis2007; Bentall & Slade, Reference Bentall and Slade1985a). Yet, this effect was not significant within clinical samples, contrasting Vercammen et al. (Reference Vercammen, de Haan and Aleman2008) who proposed atypical auditory verbal processing common to hallucinators regardless of psychopathology. Furthermore, subgroup differences were significant, potentially indicating different mechanisms of misperception in clinical and nonclinical hallucinators. However, the small number of clinical studies and wide PIs warrant cautious interpretation (Riley, Higgins, & Deeks, Reference Riley, Higgins and Deeks2011; Turner, Bird, & Higgins, Reference Turner, Bird and Higgins2013). Alternative explanations should be considered, including differences in medication status, particularly antipsychotic treatments, or underlying pathophysiology, which may influence attentional processes and perceptual sensitivity. Consequently, more research, with larger, well-characterized clinical cohorts is needed to disentangle these factors and determine whether reduced perceptual sensitivity is consistently associated with hallucinations in those cohorts.
Unlike previous meta-analyses primarily focusing on response bias and including AV-SDTs with other paradigms, this study compared perceptual sensitivity, response bias, and hit and false alarm rates specifically for AV-SDTs. No evidence of publication or selection bias was found, though large-sample studies (e.g. (Moseley et al., Reference Moseley, Aleman, Allen, Bell, Bless, Bortolon, Cella, Garrison, Hugdahl, Kozáková, Larøi, Moffatt, Say, Smailes, Suzuki, Toh, Woodward, Zaytseva and Fernyhough2021, n = 594) disproportionately influenced results, particularly in the non-clinical model (N = 1,192).
This review highlights variability and underreporting in both experimental design and results. Notably, between study heterogeneity was moderate to high (Higgins & Thompson, Reference Higgins and Thompson2002) for the association between hallucinations and AV-SDT response bias (e.g. I 2 = 62.7%), suggesting observed effects may be attributable to methodological differences, including task design and administration, and variability in participant groups such as hallucination classification, medication status, and illness chronicity.
Quality assessment using AXIS rated most studies as moderate-to-high quality, with approximately 40% rated low mainly due to insufficient reporting of cohort characteristics, nonresponder identification, and measure reliability. Encouragingly, virtually all studies conducted within the last decade show improved reporting standards. This could reflect changes in attitudes from the publishing community to permit more generous word counts, Supplementary Materials being more common, and recognition that higher levels of detail are required in methods sections.
Limitations
A major limitation of this literature analysis is the way hallucinations are measured, classified, defined (i.e. modality), and cutoffs applied varies across studies. Such variability raises concerns about comparability of ‘hallucinators’, as studies may capture fundamentally different experiences and constructs (Longden et al., Reference Longden, Branitsky, Moskowitz, Berry, Bucci and Varese2020). Two specific limitations are as follows: (i) no analyses have examined the influence of measurement choice on outcomes, and (ii) this review only distinguishes between clinical and nonclinical populations when examining signal detection performance and HEs, without further subgrouping within those categories. This focus overlooks important heterogeneity within samples, including symptom levels, and definitions of ‘hallucination-prone’ individuals. Consequently, group-level contrasts may obscure meaningful gradations in hallucinatory experience. These methodological differences may partly account for the heterogeneity observed in associations between reported hallucinatory experiences and both response bias and perceptual sensitivity in the current synthesis. Further research is required to determine how variation in hallucination assessment methods shapes these findings.
Demographic variability may also influence outcomes. Clinical samples were, on average, older (M = 38.40, SD = 11.75) than nonclinical samples (M = 27.49, SD = 11.89), an expected pattern given the reliance of some nonclinical studies (Alganami et al., Reference Alganami, Varese, Wagstaff and Bentall2017; Barkus et al., Reference Barkus, Smallman, Royle, Barkus, Lewis and Rushe2011; Bentall & Slade, Reference Bentall and Slade1985a; Smailes et al., Reference Smailes, Meins and Fernyhough2015; Varese et al., Reference Varese, Barkus and Bentall2011) on student populations. These age differences could contribute to variation between cohorts, as hallucinatory predisposition tends to decline over the lifespan (Shenyan et al., Reference Shenyan, Haye, Milne, Lisi, Greenwood, Skipper and Dekker2025). If perceptual-cognitive characteristics differ systematically across groups, age-related effects could represent a key moderating or distinguishing factor. However, this possibility could not be examined because several included studies did not report participant age, resulting in insufficient data across studies to permit a reliable analysis. Future studies should consider greater demographic matching and consistent reporting to improve comparability across AV-SDT research.
Another limitation of this meta-analysis is the potential for analyses to be underpowered due to the small number of studies and their relatively small sample sizes, which may induce ‘small study effects’ and moderate heterogeneity (Turner et al., Reference Turner, Bird and Higgins2013). For perceptual sensitivity and response bias, the PIs for model effects cross zero indicating effects in the opposite direction cannot be ruled out (IntHout, Ioannidis, Rovers, & Goeman, Reference IntHout, Ioannidis, Rovers and Goeman2016). This issue is particularly pronounced in clinical subsamples, where only five studies were available, several of which had small sample sizes (e.g. n ≤30 (Bentall & Slade, Reference Bentall and Slade1985a,Reference Bentall and Slade1985b; Varese et al., Reference Varese, Barkus and Bentall2012)). Accordingly, these findings should be interpreted with caution, particularly with respect to their generalizability. More meta-analytical comparisons are needed to distinguish methodological from perceptual differences.
Lastly, limiting inclusion to English-language publications may have excluded relevant studies and introduced potential language bias limiting generalizability across populations.
Future directions
Thorough reporting of AV-SDT design and outcomes is essential for future development of the task paradigm. Many studies included here lack detail on task parameters (trial numbers, noise-to-signal ratios, stimulus properties), participant instructions, and response frequencies (hit/false alarm rates), hindering replication and interpretation. Reporting these data is important, as optimal decision making (criterion) is affected by task demands (Lynn & Barrett, Reference Lynn and Barrett2014). Moreover, inconsistent reporting of effect sizes for nonsignificant outcomes risks publication bias (Nair, Reference Nair2019). Table 3 provides detailed reporting recommendations to improve transparency.
Recommendations for future reporting of AV-SDTs

Table 3. Long description
The table is organized into two columns. The left column lists the category, and the right column lists the specific recommendations.
* Identifying AV-SDT s. Recommendations include the inclusion of signal detection in study identifying information such as title or keywords. It also suggests the explicit use of terminology for AV-SDT s, specifying they are signal detection tasks and the theoretical framework applied, such as reality monitoring or externalizing bias.
* Task parameters. Recommendations include specifying instructions given to participants, such as awareness of noise to signal frequency. It identifies features of trials including total number, ratio of noise to noise-and-signal, duration of trials, and sound presentation details. It also requires identifying study sounds, including noise type, voice content, frequencies, and volumes.
* Testing environment. Recommendations include identifying the equipment used and the physical location of the testing environment.
* Task outcomes. Recommendations focus on reporting signal detection outcomes, specifically including frequencies of hit rate, false alarm rate, perceptual sensitivity, and bias.
The details of design differences across studies are provided in the Supplementary Materials. While such variations (e.g. stimulus type, number of trials, testing environment) may confound findings by influencing participants’ expectations and decision making (Ghiani, Mann, & Brenner, Reference Ghiani, Mann and Brenner2024), assessing their impact is beyond the scope of this review. Future research should examine these factors, perhaps incorporating distractor or practice tasks to reduce demand characteristics.
Overall, AV-SDTs offer a valuable paradigm to objectively study hallucination-related misperceptions and their cognitive underpinnings. Confidence in perceptual decisions, noted in previous research (Bentall & Slade, Reference Bentall and Slade1985a), was rarely reported here and warrants inclusion in future work to better understand subgroup differences. Simple additions, such as the inclusion of confidence ratings, could enrich study designs and illuminate underlying mechanisms.
Conclusions
These meta-analyses present evidence for an association between HEs and response bias, revealing a pattern of liberal response behavior observable in both clinical and nonclinical groups, and consistent with a role for overweighted top-down processes in hallucinations. In contrast to previous research, results show that hallucinatory phenomena are associated with a decrease in perceptual sensitivity. This finding seems primarily influenced by data from nonclinical studies, likely reflecting limited clinical studies reporting on perceptual sensitivity (and other signal detection parameters). Consequently, generalizability of this effect to clinical populations remains unclear. Synthesis of the included literature highlights several gaps in reporting, including the possible influence of variation in study designs and differences in the assessment of hallucinations.
Supplementary material
The supplementary material for this article can be found at http://doi.org/10.1017/S0033291726105339.
Funding statement
This research received no specific grant from any funding agency, commercial, or not-for-profit sectors. RMB was supported by a doctoral fellowship from Northumbria University, UK.
Competing interests
The authors declare none.
AI usage disclosure
R code for the analysis contained within this document, Hallucinations and auditory-verbal signal detection studies: a meta-analytic review, was written by RMB and refined with assistance from ChatGPT 4.0 (e.g. to troubleshoot errors). The content can be viewed here: https://osf.io/mt9vu/overview and has been reviewed and edited by RMB.




 Open access

