Implications
This study shows that partial dissection using computed tomography (CT) gives accurate predictions of beef carcass composition. In combination with the use of CT scanning to assess the complete carcass composition, it provides a reliable and feasible alternative to partial and full dissection. Accurate and cost-effective data obtained by CT scanning may be useful for breeding programmes using progeny tests and research studies in different fields, including the validation and calibration of other important indirect methods, such as in vivo video image analysis (VIA), carcass VIA and ultrasound measurements, which are relevant for genetic improvement and commercial carcass classification.
Introduction
The composition of a carcass in terms of the weights of its fat, muscle and bone is one of the attributes that defines its value (Kempster, Reference Kempster1986). The availability of accurate methods to assess carcass composition has been very important for the marketing and commercialization of cattle and carcasses, and for research on and genetic improvement of carcass quality.
Although it is very accurate, full carcass dissection is an expensive and very time-consuming procedure, and therefore only suitable for a limited number of applications such as research trials involving a relatively small number of animals (Kempster, Reference Kempster1986). Both in vivo (i.e. ultrasound, computed tomography) and post-mortem methods (i.e. partial dissection, computed tomography, specific gravity) have been investigated in livestock species with the objective of finding accurate and cost-effective alternatives to full dissection.
Within the post-mortem methods, the partial dissection of a sample joint was one of the first to be considered to reduce costs and increase the number of carcasses that could be assessed (Johnson and Charles, Reference Johnson and Charles1981). This method is based on the dissection of only one part of the carcass that is used to predict the composition of the whole carcass (Kempster et al., Reference Kempster, Cuthbertson and Harrington1982). Hankins and Howe (Reference Hankins and Howe1946) proposed the use of the 9th, 10th and 11th rib cut out as a predictor of the carcass composition. The accuracy of this method was validated by other studies (Crouse and Dikeman, Reference Crouse and Dikeman1974; Jorge et al., Reference Jorge, Fontes, Paulino and Gomes Júnior2000), although bias among breed groups was reported. Nevertheless, the complete dissection of a sub-sample of carcasses may provide the data to avoid a possible bias due to factors such as breed and sex, if the sample is chosen correctly. According to Kempster and Jones (Reference Kempster and Jones1977), the dissection of sample joints could be used to predict carcass lean content with high precision, offering a useful compromise between precision and the cost of a complete dissection of the carcasses. Partial dissection has been applied in studies in different livestock species such as beef cattle (Johnson and Charles, Reference Johnson and Charles1981; Renand and Fisher, Reference Renand and Fisher1997; Neill et al., Reference Neill, Unruh, Marston, Jaeger, Hunt and Higgins2009), lambs (van Heelsum et al., Reference van Heelsum, Lewis, Davies and Haresign2003; Navajas et al., Reference Navajas, Lambe, McLean, Glasbey, Fisher, Charteris, Bünger and Simm2007) and pigs (Heyer and Lebret, Reference Heyer and Lebret2007).
X-ray computed tomography (CT) is a technique that has been used in vivo in sheep and pigs to predict carcass composition (Jopson et al., Reference Jopson, Kolstad, Sehested and Vangen1995; Macfarlane et al., Reference Macfarlane, Emmans, Lewis, Young and Simm2006) and muscularity (Jones et al., Reference Jones, Lewis, Young and Wolf2002; Navajas et al., Reference Navajas, Lambe, McLean, Glasbey, Fisher, Charteris, Bünger and Simm2007). Navajas et al. (Reference Navajas, Glasbey, Fisher, Ross, Hyslop, Richardson, Simm and Roehe2009) showed that CT scanning of beef primal cuts also provides very accurate measurements of total carcass composition. The CT tissue thresholds estimated allow assessments of fat, muscle and bone weights with R 2 values above 0.90. The availability of automatic image analysis procedures, such as that described by Navajas et al. (Reference Navajas, Glasbey, Fisher, Ross, Hyslop, Richardson, Simm and Roehe2009), enables the delivery of information faster and with lower costs than physical dissection, which has been the traditional reference method to assess carcass composition. It also makes possible the assessment of traits after jointing the carcasses, but without further damage to them, which allows the sale at normal market prices. Therefore, CT scanning provides valuable information on economically important traits for research, breeding programmes and the beef industry in general. Due to its high accuracy, CT scanning could be used as a gold standard to develop a value-based marketing system using new technologies such as VIA, as discussed by Kongsro et al. (Reference Kongsro, Røe, Aastveit, Kvaal and Egelandsdal2008). However, time and cost could be reduced even further by obtaining accurate carcass composition information based on the CT predictions of one part of the carcass.
The objective of this paper was to investigate the potential of the forerib composition assessed by CT as a predictor of the total carcass composition, compared with partial dissection. Prediction equations were derived based on the sample of carcasses that were fully dissected and that had all primal cuts CT scanned.
Material and methods
Animals and management
This study was carried out as part of a larger trial in which a total of 87 Aberdeen Angus (AA) and 105 Limousin (LIM) crossbred heifers and steers were slaughtered in the autumn/winter months of 2006, 2007 and 2008 with average (s.d.) age and hot carcass weight of 584 (26.2) days and 342 (30.0) kg, respectively.
The 142 animals slaughtered in 2006 and 2007 were produced within a two-breed reciprocal crossbreeding rotation using AA and LIM breeds at the SAC Beef Research Centre. The remaining 50 animals slaughtered in 2008 were from different commercial farms and were sired by either AA or LIM sires, but the breed of the dam was unknown. These 50 animals were selected in the commercial abattoir where all slaughtering took place on the basis of sire breed, sex and the fact that both farm of origin was known and the individual sire identity was recorded on the animal passport.
Slaughter and dissection data
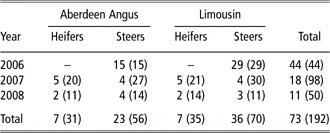
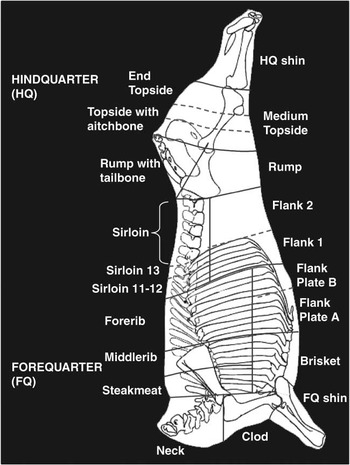
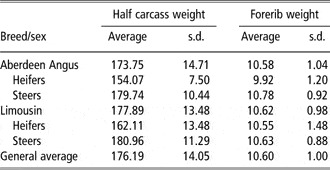
In the first year, all animals were fully dissected (three batches; 44 steers of both breeds). Four carcasses for full dissection were sampled randomly within breed and sex in the eight batches that were slaughtered between September 2007 and February 2008. Numbers sampled by year, breed and sex are presented in Table 1, as well as the total number of carcasses of the larger experiment described above. Only the foreribs were kept to be used as predictor of carcass composition of the carcasses that were not fully dissected. A line was marked from the end of the last rib forwards to the end of the first rib and parallel to the backbone; cuts were then made between the 5th and 6th rib and the 10th and 11th rib along this mark to produce the 5-rib forerib to be used as the sample joint. The forerib is shown in Figure 1. Average and standard deviations of carcass side and forerib weights of the 73 carcasses selected for full dissection included in this study are presented in Table 2.
Number of carcasses fully dissected per year, sire breed and sex

The total numbers of carcasses of the entire experiment are presented in brackets.
Diagram showing the beef primal cuts used in this study. Full and dotted lines indicate division between primal cuts and the subdivisions, respectively.

Average and s.d. of carcass side and forerib weights (kg) of carcasses selected for full dissection by sire breed and sex (n = 73)

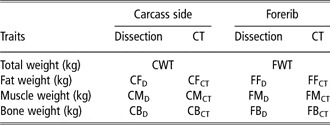
At 48 h after slaughter, the left carcass sides (CS) were split into 20 primal cuts in the abattoir, as illustrated in Figure 1, each small enough to pass through the CT scanner. Each of these primal cuts were vacuum packed and transported to the SAC-BioSS CT unit in Edinburgh where they were CT scanned and then to the University of Bristol for dissection. Both storage of the primal cuts during CT scanning and transport to the different locations were at 1°C to 2°C. Primal cuts were dissected into fat, muscle and bone. The total weights of the tissues of the carcass side were calculated by adding the absolute values of all cuts. Abbreviations used for the carcass and forerib tissue weights, assessed by CT or dissection, are presented in Table 3.
Carcass and primal cut composition traits and their abbreviations

CT = computed tomography.
CT scanning and image analysis
Primal cuts were CT scanned using a Siemens Somatom Esprit scanner (X-ray tube operated at 130 kV and 100 mAs, pitch 2, CT images diameter of 450 mm). Spiral CT scans (SCTS) were collected of each cut as described by Navajas et al. (Reference Navajas, Glasbey, Fisher, Ross, Hyslop, Richardson, Simm and Roehe2009). The SCTS provide very detailed information from a continuous volume of contiguous slices of a constant thickness (8 mm in this study). These are captured when the X-ray tube rotates continuously in one direction while the table, on which the object being scanned is lying, is mechanically moved through the X-ray beam. In the case of a few primal cuts, such as the flank, two contiguous SCTS were collected because the length of these primals was larger than 60 cm (maximum length of the SCTS for the specifications given above).
Tissue composition of the primal cuts was computed from the tissue areas and CT densities of all cross-sectional images of each SCTS, which were computed using STAR 4.8 (Mann et al., Reference Mann, Glasbey, Navajas, McLean and Bünger2008) with the tissue thresholds estimated by Navajas et al. (Reference Navajas, Glasbey, Fisher, Ross, Hyslop, Richardson, Simm and Roehe2009).
The weights of fat, muscle and bone of each primal cut were then calculated as:
Tissue weight = Σ tissue areas × cross-sectional thickness × weighted average density of tissue, where
(a) tissue areas were calculated by counting the number of pixels which have CT values in the range corresponding to each of the tissues (see, e.g. Glasbey and Horgan, Reference Glasbey and Horgan1995, pp. 156–157);
(b) cross-sectional thickness (8 mm); and
(c) weighted average density was the Σ (area × tissue density)/Σ area.
Tissue densities were calculated for fat and muscle using the regression equation of Fullerton (Reference Fullerton1980). In the case of the bone, the CT density is not a good indicator of its gravimetric density and Fullerton (Reference Fullerton1980) is inapplicable. Therefore, the density of bone was assumed as a fixed value of 1.55 g/cm3 that reflects the average density of bone (Jopson, Reference Jopson1993).
Tissue weights for the total carcass side by CT were also calculated by adding together the composition of the cuts measured by CT (traits and their abbreviations are in Table 3).
Data analysis
The prediction equations for tissue absolute weights in the CS were estimated from the composition of the foreribs using general linear models in Genstat (Payne et al., Reference Payne, Murray, Harding, Baird and Soutar2008). Different models were fitted as described as follows.
First, the accuracy of CT scanning in the estimation of the forerib and carcass composition was determined by using simple regression models, with the intercept being zero because the CT image analysis procedure was developed assuming a 1 : 1 association between weights assessed by CT and dissection (Navajas et al., Reference Navajas, Glasbey, Fisher, Ross, Hyslop, Richardson, Simm and Roehe2009):

where y = tissue weight of the carcass side (or forerib) by dissection; b = the regression slope (kg dissection/kg CT); x = tissue weight of the carcass side or (forerib) by CT and e = residual error.
Second, different prediction equations were investigated for both CT and dissection data. Simple regression models were used to analyse the association between the composition of the forerib and the carcass side for both dissection and CT methods.

where y = tissue weight in the carcass side by dissection (or CT); a = intercept; b = the regression slope; x = weight of the same tissue in the forerib by dissection (or CT) and e = residual error.
Because of the data structure, it was not possible to test the association between the composition of carcass side and forerib within breed and/or sex. Multiple linear regression models were used to evaluate the change in accuracy due to additionally fitting the effects of breed and sex to the Model (2). Preliminary analysis included an interaction between the breed and sex effects. As the interaction was not significant (P > 0.05) for any of the carcass tissue weights assessed by CT or dissection, it was not included in the model.

where y = tissue weight in the carcass side by dissection (or CT); a = intercept; B = breed (AA, LIM); S = sex (H, S); b = the regression slope; x = weight of the same tissue in the forerib by dissection (or CT) and e = residual error.
A second group of predictor traits was also evaluated using multiple linear regression models. The independent traits included in this case, in addition to the effect of breed, sex and tissue weight in the forerib, were other variables associated with carcass composition that were also available: hot carcass side weight, forerib weight and the weights of the other tissues in the forerib, as suggested by Fisher (Reference Fisher1990). For example, for the analysis of carcass fat weight by dissection (CFD), the model was:

where CFD = dependent trait; B, S, CWT, FWT, FFD, FMD and FBD, = independent variables previously defined; a = intercept; b, c, d, f, g are the regression coefficients associated with CWT, FWT, FFD, FMD and FBD, respectively, and e = residual error.
For each carcass tissue weight measured by dissection or CT, all possible combinations of predictors were fitted using backward stepwise regression. Final model terms were chosen within each of these options. Models were compared using adjusted coefficient of determination (adj-R 2) and root mean square error (RMSE).
Results
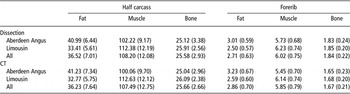
The averages and standard deviations of tissue weights of carcasses and foreribs by breed are presented in Table 4. Both CT and dissection methods showed that LIM carcasses were leaner with higher muscle weights than AA carcasses and similar bone weights. The same trends were observed in the composition of the foreribs.
Averages (s.d.) of weights of fat, muscle and bone in the half carcass and forerib assessed by dissection and CT of carcasses that were fully dissected (n = 73) by sire breed

CT = computed tomography.
The variations in carcass composition of all animals in the sample, measured as the coefficient of variation (CV = standard deviation/average, using values in Table 4), were 19%, 11% and 11% for CFD, CMD and CBD, respectively. Slightly larger values were found for carcass composition by CT (CFCT, 21%; CMCT, 12%; CBCT, 10%). Differences in CV between breeds for carcass side compositions ranged between –3.9% (CBD) and 1.9% (CMD).
The variation in tissue weights in the foreribs, measured after dissection, were 23%, 13% and 12% for FFD, FMD and FBD, respectively. The CV values were 1% higher for the weights of the three tissues assessed by CT. Differences in variation between breeds were 3.4%, 0.1% and −2.3% for FFD, FMD and FBD, and 2.4%, −0.8% and 2.5% for FFCT, FMCT and FBCT, respectively.
Accuracy of CT scanning as a predictor of tissue weights
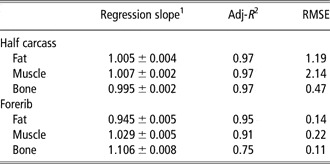
Carcass side and forerib composition assessed by dissection and CT were similar (Table 4) because of the strong relationships between CT and dissection tissue weights. Table 5 presents the estimated regression slopes between CT and dissection tissue weight and the accuracy of the prediction (adj-R 2 and RMSE). Carcass composition was predicted with high accuracy by CT. The adj-R 2 values were 0.97 for the three tissues and regression slopes were very close to one. For forerib composition, high accuracies were also obtained in the predictions of FFD and FMD, with adj-R 2 of 0.95 and 0.91, respectively. However, a weaker association (adj-R 2 = 0.75) was found for bone. The regression slopes for the three tissues were significantly different from one (P < 0.05).
Associations between carcass and forerib tissue weights by dissection and CT (n = 73 animals)

CT = computed tomography; Adj-R 2 = adjusted coefficient of determination; RMSE = root mean square error.
1± s.e. of the estimate.
Prediction of carcass composition
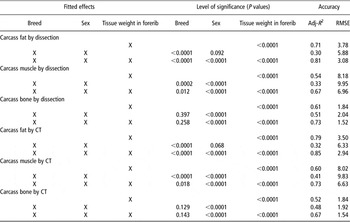
The associations between forerib and carcass composition assessed by dissection or CT and the effects of breed and sex on accuracy (Models (2) and (3)) are presented in Table 6. Tissue weights of foreribs explained a moderate to high proportion of the variation of carcass composition (range of adj-R 2: 0.52 to 0.79). The largest adj-R 2 values were observed for fat weight for both dissection and CT methods. Predictions of carcass muscle and bone weights had lower accuracies with adj-R 2 values between 0.52 and 0.61. Comparing the methods, the results in Table 6 show that higher accuracies were obtained by CT for fat (0.79, CT v. 0.71, dissection) and muscle (0.60, CT v. 0.54, dissection). The opposite was observed for carcass bone weight (0.52, CT v. 0.61, dissection).
Prediction of carcass tissue weights using breed, sex and forerib composition assessed by dissection or CTFootnote 1: significance of predictors and accuracies

CT = computed tomography; RMSE = root mean square error; Adj-R 2 = adjusted coefficient of determination.
1 Only forerib tissue weights by dissection (or CT) were fitted when the dependent trait was assessed by dissection (or CT).
In general, breed and sex effects had a significant effect on the carcass composition assessed by CT or dissection. Nevertheless, they explained a lower proportion than the forerib composition, independently of the method used to assess tissue weights.
Fitting breed and sex, in addition to the forerib information, resulted in an important improvement of the accuracy (larger adj-R 2, lower RMSE) in the three tissues and both methods, compared to simple regression models with forerib composition as the only predictor. Although only sex had a significant effect (P < 0.05) on CBD and CBCT, the improvement in accuracies in these traits measured by dissection and CT were 0.12 and 0.15, respectively (CBD, 0.73 v. 0.61; CBCT, 0.67 v. 0.52). Both breed and sex effects were significant (P < 0.05) in the prediction of carcass fat and muscle weights by dissection and CT. The smallest improvement was for CFCT, which already showed the best accuracy (0.79 v. 0.85). The increase in adj-R 2 was 0.13 in both CMD and CMCT.
The models including CT information had higher adj-R 2 compared to those based on dissection data for both fat (0.85, CT v. 0.81, dissection) and muscle (0.73, CT v. 0.67, dissection). However, it was lower for bone (0.67, CT v. 0.73, dissection).
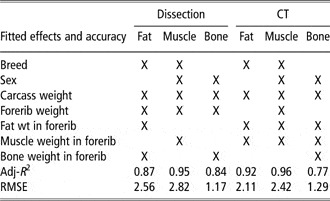
The regression models with the best accuracies for fat, muscle and bone weights and both methods are presented in Table 7. These models were those that resulted from fitting all relevant and available predictors, which included not only the effect of breed, sex and tissue weight in the forerib but also hot carcass side weight, forerib weight and the weights of the other tissues in the forerib, as suggested by Fisher (Reference Fisher1990). The relevant effects for each of the dependent traits are indicated, as well as the adj-R 2 and RMSE values. The effects of breed and/or sex were relevant, as seen before when using Model (3) (Table 6). Carcass weight was also significant but in all prediction equations. The prediction with better accuracy included the weight of the forerib for the three tissues by dissection, but only for the prediction of muscle by CT. As indicated previously, the composition of the forerib was also shown to be relevant when predicting carcass composition (Tables 6 and 7).
Fitted effects and accuracy (adj-R 2, RMSE) of the best models for each carcass tissue measured by dissection or predicted by CTFootnote 1

Adj-R 2 = adjusted coefficient of determination; RMSE = root mean square error; CT = computed tomography.
1 Only forerib tissue weights by dissection (or CT) were fitted when the dependent trait was assessed by dissection (or CT).
The comparison of adj-R 2 and RMSE obtained by using Models (3) (Table 6) and (4) (Table 7) indicated that the inclusion of the additional predictors improved accuracy. The largest increases in adj-R 2 were observed in CMD and CMCT, which achieved the highest and similar values of adj-R 2 (0.95, dissection; 0.96, CT). The accuracies for carcass bone and fat weights were lower and differed depending on the method used. The adj-R 2 was larger for CFCT (0.92) than for CFD (0.87), while the opposite was observed for carcass bone weight (0.77 v. 0.84, by CT and dissection, respectively).
Discussion
Accuracy of CT predictions
Carcass composition was assessed very accurately by CT scanning of the primal cuts (adj-R 2 = 0.97 for the three tissues, Table 5), in agreement with the results presented by Navajas et al. (Reference Navajas, Glasbey, Fisher, Ross, Hyslop, Richardson, Simm and Roehe2009). Regression slopes were very close to one, indicating that the CT data can be used as direct predictors of carcass composition.
In the case of the forerib composition, CT scanning predicted with high accuracy the weights of fat and muscle (adj-R 2 of 0.95 and 0.91, respectively). These values were higher than the accuracies reported by Hollo et al. (Reference Hollo, Szues, Tozser, Hollo and Repa2007) between CT parameters such as CT tissue volume or number of pixels and dissection data of 11th to 13th rib samples of beef carcasses (range of R 2 values: 0.72 to 0.88, fat; 0.55 to 0.94, muscle). However, forerib bone weight was predicted with an adj-R 2 value of 0.75. Poorer accuracies in the predictions of carcass bone weights by CT compared to other tissues were also reported for CT scanning of pig carcasses (Jopson et al., Reference Jopson, Kolstad, Sehested and Vangen1995), in vivo predictions of carcass composition in sheep (Young et al., Reference Young, Simm and Glasbey2001; Macfarlane et al., Reference Macfarlane, Emmans, Lewis, Young and Simm2006) and predictions of primal cut composition in sheep (Kvame et al., Reference Kvame, McEwan, Amer and Jopson2004).
The estimations of tissue weights by CT are based on the measurement of their volume and density. In the case of the bone, a fixed value of density, which reflects the average density of bone, was assumed for the calculation because CT bone density is not a good indicator of gravimetric density of this tissue (Jopson, Reference Jopson1993). Although the error of using a standard value rather than the CT measured bone density is thought to be small on average, lower accuracies can be expected in the prediction of bone weight due to the high variability and complexity of bone density and shape along the skeleton. Nevertheless, this effect may be even more pronounced when considering one specific region of the carcass, which may be one reason for the lower accuracy of the prediction of bone weight in the forerib.
The regression slopes for the tissue weights in the forerib indicated that if the objective were to estimate the composition of this primal cut, fitting the intercept in the model could have increased the accuracy. In addition, regression slopes close to one were expected only for the prediction of carcass tissue weights according to the image analysis developed by Navajas et al. (Reference Navajas, Glasbey, Fisher, Ross, Hyslop, Richardson, Simm and Roehe2009). However, in this study the objective was to use the forerib data provided by CT to predict carcass composition, and therefore the actual values obtained using CT were used in the prediction equations for carcass composition.
Prediction of carcass composition by using primal cut composition
Partial dissection is an indirect method to evaluate carcass composition based on the dissection of wholesale cuts, retail joints or specific anatomic regions to predict the composition to the entire carcass (Kempster et al., Reference Kempster, Cuthbertson and Harrington1982). One example widely used in several studies including nutrition (Heyer and Lebret, Reference Heyer and Lebret2007; Neill et al., Reference Neill, Unruh, Marston, Jaeger, Hunt and Higgins2009) and genetics (Bergen et al., Reference Bergen, Miller, Wilton, Crews and Mandell2006) and breed comparisons (Gregory et al., Reference Gregory, Cundiff, Koch, Dikeman and Koohmaraie1994) was the 9th, 10th and 11th rib cut proposed by Hankins and Howe (Reference Hankins and Howe1946), who found the chemical composition and separable physical components of the 9th, 10th and 11th rib cut of slaughter steers to be highly associated with the composition of the entire carcass and developed equations for predicting carcass composition based on rib composition. Correlations of 0.92 and 0.82 between separable fat and lean content of the 9th, 10th and 11th rib and the ether extract and protein content of the carcass were reported (Hedrick, Reference Hedrick1983). Later, Crouse and Dikeman (Reference Crouse and Dikeman1974) developed similar equations for steers of different breeds and reported correlation coefficients of 0.94 and 0.97 for fat and protein content. Although the associations were of similar magnitude, Crouse and Dikeman (Reference Crouse and Dikeman1974) found an effect of bias due to the breed effect, when comparing their results with those obtained using Hankins and Howe’s equations. More recently, Jorge et al. (Reference Jorge, Fontes, Paulino and Gomes Júnior2000) concluded that the prediction equations based on chemical composition from the 9th, 10th and 11th rib cut were reliable for comparative studies of body composition of zebu cattle (protein percentage, R 2 = 0.84; fat percentage, R 2 = 0.88).
The relationships between carcass composition and the composition of different parts of the carcass (i.e. 6th, 10th and 12th ribs, wholesale joints) were broadly investigated. Kempster and Jones (Reference Kempster and Jones1977) studied the prediction of the carcass lean content using the lean content of wholesale joints, concluding that the rib joints showed a useful compromise between the main factors to be considered when selecting a sample joint: cost and accuracy. Cook et al. (Reference Cook, Jones and Kempster1983) calculated which cut was the best to use as a predictor of carcass lean content taking into account not only the correlation between the cuts and the carcass lean content but also the cost of dissecting each sample cut as a proportion of the total cost of dissecting a complete half carcass. They concluded that the best primal cuts were the brisket, forerib and thin flank.
In our study, the forerib tissue weights by dissection were very reliable predictors of carcass composition with maximum values of adj-R 2 of 0.87, 0.95 and 0.84 (Table 7) for fat, muscle and bone weights of the carcass side, respectively. The comparisons of these results with those presented in the literature are not straightforward because most of the authors focused on the percentage of the different tissues in the carcass, whereas our study investigated the prediction of the absolute tissue weights. Nevertheless, the levels of accuracies are similar or better than those reported in other studies for other rib joints widely used in research. The correlation coefficients reported by Hollo et al. (Reference Hollo, Szues, Tozser, Hollo and Repa2007) were 0.92, 0.84 and 0.76 for carcass fat, muscle and bone weights in beef. The ranges of R 2 values reported for fat and muscle weights in other species were 0.81 to 0.96 and 0.79 to 0.97, respectively (goats, Arguello et al., Reference Arguello, Capote, Gines and Lopez2001; sheep, van Heelsum et al., Reference van Heelsum, Lewis, Davies and Haresign2003, Navajas et al., Reference Navajas, Lambe, McLean, Glasbey, Fisher, Charteris, Bünger and Simm2007).
The inclusion of other predictors such as carcass weight and weight of the joint were also relevant to achieve more reliable predictions, as previously suggested by Kempster and Jones (Reference Kempster and Jones1977) and Fisher (Reference Fisher1990). The significant contribution of the breed and sex effect indicated that the estimation of equations specific for breeds (or groups of breeds) and sexes could be important to maximize accuracy, by reducing the possible bias among breeds or sexes that had differences in the tissue distribution (Crouse and Dikeman, Reference Crouse and Dikeman1974).
The accuracies of carcass composition obtained when the forerib composition was assessed by CT scanning were similar or better than the gold standard method of dissection for fat and muscle weights. The adj-R 2 value was lower for bone (CT, 0.77; dissection, 0.84), but was still sufficiently high to warrant consideration. The relevance of including the carcass and primal weights to improve the accuracy of the prediction of carcass composition is also valid in the case of the forerib composition by CT.
Possible uses and practical implications of ‘partial CT dissection’
Complete carcass dissection appears to be an ideal approach to determine composition, given that it provides detailed information about the different tissues, and therefore it is used as the gold standard. However, the limitations of using this method in commercial conditions, as well as in breeding programmes or research studies with large numbers of animals, prompted the development of indirect methods of predicting composition (Kempster et al., Reference Kempster, Cuthbertson and Harrington1982). The availability and implementation of cost-effective methods for estimating body composition, which are applicable in the different circumstance mentioned above, have been important for meat industries.
In this study, and in the literature, partial dissection has been shown to be an accurate indirect method. It allows the prediction of the carcass composition, reducing the costs and time needed for the full dissection. The usefulness of partial dissection was evaluated in this study using data provided by CT scanning than by using dissection. Similar accuracies were obtained by using CT composition data of the forerib, but without damaging the primal cut or reducing its market value.
Although partial dissection is very accurate, prediction equations obtained by this method may not be applicable among ranges of nutritional treatments or types of animals. Being able to construct the best equations for the different treatments, breeds or sexes requires some baseline dissection, thus reducing the benefits in terms of cost and time of the partial dissection.
The results of this study suggested that the problems of bias and stability of the prediction equations are also present when the carcass composition is predicted with ‘partial CT dissection’. However, Navajas et al. (Reference Navajas, Glasbey, Fisher, Ross, Hyslop, Richardson, Simm and Roehe2009) showed that the CT scanning of the primal cuts of the beef carcasses gives a very accurate estimation of carcass composition, with the additional advantages of faster delivery of data, due to the automatic image analysis, and lower costs. These lower costs can be explained by the possibility of using the primal cuts for additional measurements or sale.
In summary, the forerib composition obtained by CT gives accurate predictions of carcass composition. In combination with the use of CT scanning to assess the complete carcass composition, it provides a reliable and feasible alternative to partial and full dissection. Accurate and cost-effective data obtained by CT scanning may be useful for breeding programmes using progeny tests and research studies in different fields, including the validation and calibration of other important indirect methods such as in vivo VIA, carcass VIA and ultrasound measurements, which are relevant for genetic improvement and commercial carcass classification.
Acknowledgements
The financial support of the Scottish Government is gratefully acknowledged. We are grateful to SAC colleagues Cameron Craigie, Kirsty McLean, Elizabeth Goodenough, John Gordon, Laura Nicoll, Claire Anderson and Mhairi Jack and the University of Bristol dissection team of Dave Brock, Jackie Bayntun, Carol Ebdon, Ann Laws and Sally Osborne for their help in the experimental work. The authors thank Scotbeef Ltd for their cooperation. The authors gratefully acknowledge the partnership with Biomathematics and Statistics Scotland at the CT Unit and in particular the collaboration and input of Chris Glasbey and Alex Mann.