Introduction
Humic substances are one of the most widely distributed classes of natural organic compounds on earth and are found in water, soils and sediments such as lignite, leonardite and peat (Doskočil et al., Reference Doskočil, Grasset, Enev, Kalina and Pekař2015, Reference Doskočil, Enev, Grasset and Wasserbauer2017, Reference Doskočil, Burdíková-Szewieczková, Enev, Kalina and Wasserbauer2018). Humic substances are heterogeneous mixtures of substances formed by the chemical and biological transformation of the plant, animal and microbial materials and have not yet been properly chemically defined. They are operationally divided into three classes (fulvic acid, humic acid (HA) and humin) on the basis of their alkaline and acid solubility. Humic acids are soluble at pH > 2, fulvic acids are soluble under all pH conditions and humin is insoluble at all pHs.
Humic acids play an important role in soils, as can be seen from the literature. For example, soil HAs represent an important source of macro and micronutrients for plants and microorganisms (Schulten and Schnitzer, Reference Schulten and Schnitzer1997; Pedra et al., Reference Pedra, Plaza, Fernández, García-Gil and Polo2008), contribute significantly to the acid-base buffering capacity of soils (Chen et al., Reference Chen, Magen, Riov, Senesi and Miano1994), play an important role in metal speciation in soil (Senesi, Reference Senesi1992), interact with organic xenobiotics (Swift et al., Reference Swift, Rate, McLaren, Huang, Berthelin, Bollag, McGill and Page1995), affect soil biological activity (García and Hernández, Reference García and Hernández1997) and are able to bind mineral particles together, promoting a good soil structure and thereby improving aeration and moisture retention (Piccolo and Mbagwu, Reference Piccolo and Mbagwu1994).
Soils with small contents of organic matter exhibit limited fertility and low production levels and greater exposure to degradation, erosion and desertification (Albaladejo et al., Reference Albaladejo, Stocking, Diaz and Castillo1994; Brunetti et al., Reference Brunetti, Plaza, Clapp and Senesi2007). However, soil organic matter content is influenced strongly by agricultural management practices, with intensive cropping often leading to the loss of soil organic matter (Duong et al., Reference Duong, Penfold and Marschner2012).
Consequently, the use of organic amendments such as composts, manures, or crop residues has become a well-established management practice to improve and/or restore soil organic matter in agricultural ecosystems (García-Gil et al., Reference García-Gil, Plaza, Senesi, Brunetti and Polo2004a, Reference García-Gil, Ceppi, Velasco, Polo and Senesi2004b; Serramiá et al., Reference Serramiá, Sánchez-Monedero, Roig, Contin and De Nobili2013). It has also been reported that municipal solid waste compost promotes microbiological activity (de Araújo et al., Reference de Araújo, de Melo and Singh2010).
The effects of compost on soil are expected to depend on several parameters, e.g. compost quality, soil type, the method used to apply compost to the soil, application rate and environmental conditions. Compost quality itself depends on a multiplicity of factors, the main ones being the nature of the composted matter, availability of oxygen in the composting pile and composting time (Bernal et al., Reference Bernal, Navarro, Sánchez-Monedero, Roig and Cegarra1998; Adani et al., Reference Adani, Genevini, Ricca, Tambone and Montoneri2007).
The composition of soil organic matter after compost amendment is changed mainly by increases in lignin and alkyl/aromatic carbon of composts (hydrophobic carbon); also compost-derived polysaccharides are mineralized preferentially (Leifeld et al., Reference Leifeld, Siebert and Kögel-Knabner2002; Aguiar et al., Reference Aguiar, Olivares, Novotny, Dobbss, Balmori, Santos-Júnior, Chagas, Façanha and Canellas2013). However, lignin may also be substantially degraded during the composting of grass straw (Horwath et al., Reference Horwath, Elliott and Churchill1995). A few studies have also shown increases in soil carbon, nitrogen and cation exchange capacity after compost application (González-Vila et al., Reference González-Vila, Almendros, del Rio, Martín, Gutiérrez and Romero1999; Ouédraogo et al., Reference Ouédraogo, Mando and Zombré2001; Leifeld et al., Reference Leifeld, Siebert and Kögel-Knabner2002; Adani et al., Reference Adani, Genevini, Tambone and Montoneri2006). Compost HAs are known to be different from typical soil HAs (Montoneri et al., Reference Montoneri, Savarino, Adani, Genevini, Ricca, Zanetti and Paoletti2003; Adani et al., Reference Adani, Genevini, Tambone and Montoneri2006; Enev et al., Reference Enev, Pospíšilová, Klučáková, Liptaj and Doskočil2014). Compost HAs have higher carbon and nitrogen contents and lower oxygen contents than soil HAs. Humic acids from soils are commonly accompanied by higher total acidity (Adani et al., Reference Adani, Genevini, Tambone and Montoneri2006). Nuclear magnetic resonance spectra indicate that most carboxyl groups in compost HAs are in amide form, whereas free carboxylic groups prevail in soil HA (Adani et al., Reference Adani, Genevini, Tambone and Montoneri2006).
The amount and quality of HAs in composts are considered important indicators of their biological maturity and chemical stability and a guarantee of their safety and performance in soil (Benítez et al., Reference Benítez, Nogales, Masciandaro and Ceccanti2000; Romero et al., Reference Romero, Plaza, Senesi, Nogales and Polo2007; Senesi et al., Reference Senesi, Plaza, Brunetti and Polo2007).
Among the various analytical methods which can be used to characterize HAs from organic materials, ultra-violet/visible (UV-Vis) and fluorescence spectrometry are particularly valuable approaches (Fuentes et al., Reference Fuentes, González-Gaitano and García-Mina2006). Numerical indices derived from these analytical methods have proven to be useful for evaluating the degree of humification of HAs extracted from organic materials of diverse origin (Brunetti et al., Reference Brunetti, Plaza, Clapp and Senesi2007).
The objective of the current work was to examine the impact of compost application on the nature and content of HAs in soil from the Czech Republic. To better understand the effect of compost in amending the soil, experiments were performed over the medium-term (3 years) and isolated HAs were characterized by means of elemental analysis and spectrometric methods. Information on the modification of soil organic matter induced over time by the addition of compost addition over the time is still quite limited, especially in the case of soils in Central Europe, where composting conditions (precipitation, temperature, etc.) may differ from other parts of the world.
Materials and methods
Compost, soil and experimental design
Natural compost (NC) was obtained from the Crop Research Institute (CRI) in Prague, Czech Republic. The field experiment was conducted on a dark brown soil with low organic C content classified as a Luvic Chernozem (FAO 2006) in an experimental plot located at CRI Prague-Ruzyně, Czech Republic. The experimental design included non-irrigated 3 × 3 m2 plots of cropped grassland and plots amended with NC at the rates of 124 (NC124), 239 (NC239) and 478 (NC478) t/ha in the first year (2008) of the experiment. One plot was not amended and represented the control soil (NC0). The main constituents of the compost were freshly cut grass, leaves, wood chips and a limited amount of straw. Three replicates were performed for each treatment. After the first year of compost application and then subsequently in late March of each year from 2009 to 2011, surface soil sub-samples (Ap horizon, 0–15 cm depth) were collected using soil probes of 53 mm internal diameter. A composite soil sample was then obtained for each treatment by mixing equal amounts of three corresponding soil sub-samples.
Soil and compost analysis
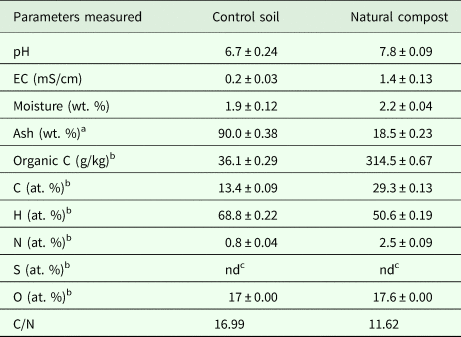
The pH and electrical conductivity (EC) were measured on a 1:5 sample/ultra-pure water (weight/weight) extract after shaking for 60 min (García-Gil et al., Reference García-Gil, Plaza, Senesi, Brunetti and Polo2004a, Reference García-Gil, Ceppi, Velasco, Polo and Senesi2004b). The elemental composition of control soil and compost was determined using an EA 3000 CHNS/O analyser (Euro Vector, Pavia, Italy). Samples (12–15 mg) were packed in tin capsules and placed in an oven for combustion at 980 °C using pure oxygen as the combustion gas and pure helium as the carrier gas. Calibration curves for carbon (C), hydrogen (H), nitrogen (N) and sulphur (S) were obtained using sulphanilamide as a reference standard sample. The moisture and ash content were determined using a Q50 TGA analyser (TA Instruments, New Castel, Delaware, USA). Organic C content was determined as the weight loss from 200 to 430 °C (Pallasser et al., Reference Pallasser, Minasny and McBratney2013). The samples were heated at a rate of 10 °C/min to an end temperature of 950 °C under a flow of atmospheric air. The results are presented in Table 1.
pH values; electrical conductivities (EC); organic C, moisture, ash content and elemental compositions of control soil and natural compost

a Moisture-free basis.
b Moisture-free and ash-free basis.
c None detected.
Isolation of humic acids
One, 2 and 3 years after compost application using the modified procedure recommended by the International Humic Substances Society (Swift, Reference Swift, Sparks, Page, Helmke and Loeppert1996), HAs were extracted from compost, unamended control soil and soils amended with 124, 239 and 478 t/ha and sampled. Briefly, air-dried samples were decalcified with 0.1 mol/l hydrogen chloride (HCl) in the ratio of 1:10 (sample/solution) and the suspensions were then washed with distilled water until almost neutral pH was achieved. All samples were shaken overnight with 0.1 mol/l NaOH and 0.1 mol/l pyrophosphate solution under N2 using a sample/extractant ratio of 1:10. After centrifugation at 2700 × g for 30 min, HAs were precipitated from the supernatant by means of acidification to pH <2 with 6 mol/l HCl and further separated by centrifugation at 2700 × g for 20 min. Precipitated HAs were treated (twice) with a mixture of 0.5 vol. % HCl-HF over a period of 24 h and subsequently separated in the centrifuge. Humic acids were purified and dialyzed using a Spectrapore membrane (MWCO 1000) until free Cl− ions were washed out and finally freeze-dried.
Humic acids analysis
All samples were incinerated at a heating rate of 10 °C/min from room temperature to 900 °C under air atmosphere. The weight loss occurring at 105 °C was measured and taken as the moisture content. The final residue, after heating to 900 °C, was measured and taken as the ash content. The elemental composition was determined by a CHNSO Flash 1112 Microanalyser (Carlo Erba, Milano, Italy). The oxygen content was calculated according to the relationship % oxygen = 100 − (C + H + N + S) % and the data obtained were corrected for moisture and ash content.
The UV/V is spectra of aqueous solutions were measured by a Hitachi U-3900 spectrophotometer (Hitachi, Tokyo, Japan) in the wavelength range of 200–900 nm. The absorption coefficients of HAs were calculated from the absorbance (Chen et al., Reference Chen, Senesi and Schnitzer1977; Kumada, Reference Kumada and Kumada1987; Korshin et al., Reference Korshin, Li and Benjamin1997; Peuravuori and Pihlaja, Reference Peuravuori and Pihlaja1997).
Fourier-transform infrared (FTIR) spectra of powdered samples of HAs were recorded on a Nicolet iS50 spectrometer equipped with a deuterated lanthanum α alanine doped triglycine sulphate (DLaTGS) detector (Thermo Fisher Scientific, Waltham, USA). Infrared spectra obtained in Attenuated Total Reflection (ATR) mode were chosen as it required no sample or potassium bromide (KBr) preparation and therefore presented less opportunity for analyst-induced variation between samples. A disadvantage of the transmission technique with KBr is that, under certain conditions, the deprotonation and/or decarboxylation of carboxylic functional groups in humic substances may be catalyzed (Davis et al., Reference Davis, Erickson, Johnston, Delfino and Porter1999). For these reasons, ATR infrared spectroscopy was used. All spectra were recorded over the range 4000–400/cm at 4/cm resolutions and were the average of 128 scans (Fernandes et al., Reference Fernandes, Giovanela, Esteves and de Souza Sierra2010; Vergnoux et al., Reference Vergnoux, Guiliano, Di Rocco, Domeizel, Théraulaz and Doumenq2011). The spectrum of air on clean dry ATR diamond crystal was used as the background for infrared measurement. Thermo Scientific Omnic spectroscopy software was used to obtain the spectra and the Advanced ATR algorithm was used to correct for band intensity distortion, peak shifts and non-polarization effects.
Fluorescence spectra were recorded in aqueous solutions of 10 mg/l HAs using a FluoroLog luminescence spectrophotometer (Horiba Scientific, New Jersey, USA). The pH-value of samples was adjusted to seven using standard phosphate buffer. Emission spectra were recorded over the range 380–600 nm at a constant excitation wavelength of 360 nm. The excitation spectra were recorded over the range 300–500 nm at a fixed emission wavelength of 520 nm (Senesi et al., Reference Senesi, Miano, Provenzano and Brunetti1991). Total luminescence spectra were obtained in the form of an excitation/emission matrix (EEM) by scanning the emission over the wavelength range 300–600 nm, with the excitation wavelength increasing in 5 nm steps from 240 to 550 nm (Alberts and Takács, Reference Alberts and Takács2004; Valencia et al., Reference Valencia, Marín, Restrepo and Frimmel2013). The EEM spectrum of ultra-pure water (Mili-Q) was obtained and subtracted from the EEM spectra of all samples examined to decrease the influence of 1st- and 2nd- order Raman scattering (Chai et al., Reference Chai, Liu, Zhao, Hao and Zhao2012). The emission spectra of samples were scanned from 460 to 650 nm with an excitation wavelength of 440 nm and the total area under these fluorescence spectra was calculated as the Milori index (Milori et al., Reference Milori, Martin-Neto, Bayer, Mielniczuk and Bagnato2002).
Inner filter effect correction method
The fluorescence intensity values (in counts/second – CPS) of samples were corrected using the method devised by Lakowicz (Reference Lakowicz and Lakowicz2006). This method uses the relationship:
 $$F_{{\rm corr}} = F_{{\rm obs}} \times 10^{\left[ {\left( {\textstyle{{A_{{\rm ex}} + A_{{\rm em}}} \over 2}} \right)} \right]}$$
where F corr and F obs are the corrected and uncorrected fluorescence intensities and A ex and A em are the absorbance values at the excitation and emission wavelengths. The path of the exciting light is assumed to be equal to the path of the emitted light. Primary inner filter effects are corrected as well as secondary inner filter effects.
Results
Soil and compost
Several chemical and physical properties of soil and compost, including pH, EC, moisture, organic C and ash content, elemental composition and C/N ratio are shown in Table 1. The compost exhibited a slightly alkaline pH, higher EC and organic C values, higher amounts of C, H, N and O and a C/N ratio (Giusquiani et al., Reference Giusquiani, Pagliai, Gigliotti, Businelli and Benetti1995). The control soil exhibited a slightly acidic to neutral pH, lower EC, lower contents of biogenic elements (C, N) and a higher C/N ratio.
Humic acids
Extraction yield, elemental composition, atomic ratios
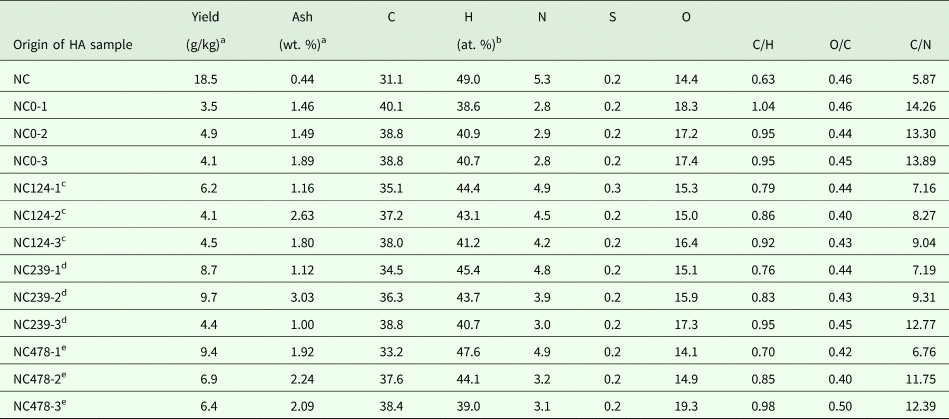
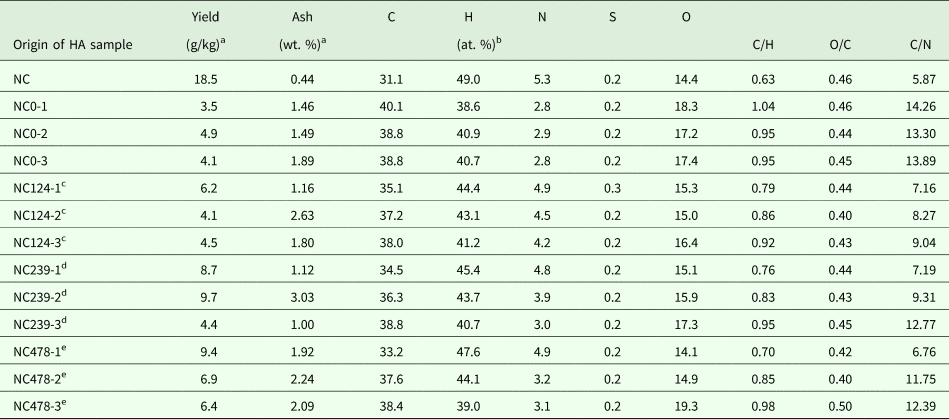
The extraction yields, elemental composition, ash contents and atomic ratios of HAs isolated from compost, control soil and amended soils are listed in Table 2. The elemental composition of NC-HA is markedly different from that of any soil HAs where there are higher H, N contents and lower C, O contents, lower amounts of ash and lower C/H, C/N and O/C ratios. These properties suggest that NC-HA is freshly and quickly formed and possibly incorporates protein-like and aliphatic materials. With respect to NC0-HA, the HAs isolated after 1 year from the amended soil had larger H and N contents and smaller C and O contents and C/H, C/N and O/C ratios. The HAs isolated after 2 and 3 years from the amended soil had similar and/or larger C and N contents and a smaller C/N ratio when compared with HAs from control soil.
Extraction yields, ash content, elemental composition and atomic ratios of humic acids (HAs) isolated from the control soil (NC0), NC and NC-amended soils
a Moisture-free basis.
b Moisture-free and ash-free basis.
c Soils amended with NC at a rate of 124 t/ha sampled 1, 2 and 3 years after compost application, respectively.
d Soils amended with NC at a rate of 239 t/ha sampled 1, 2 and 3 years after compost application, respectively.
e Soils amended with NC at a rate of 478 t/ha sampled 1, 2 and 3 years after compost application, respectively.
Ultra-violet/visible spectrometry
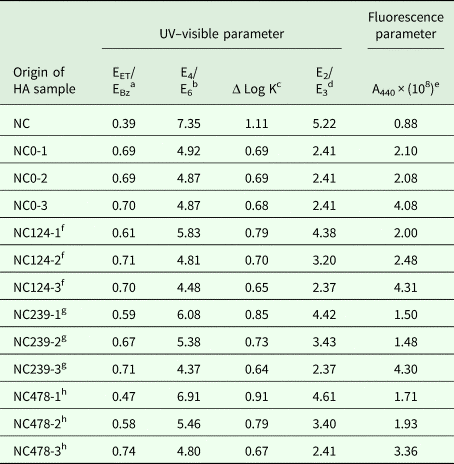
The UV/Vis absorbance spectra of HAs isolated from compost and unamended and amended soils were featureless and characterized by the absence of identifiable maxima and/or minima with decreasing absorbance at increasing acquisition wavelength (not shown). Samples of different HAs absorbed light at wavelengths ranging between 200 and 700 nm. The values of different indexes calculated from the UV/Vis spectra are presented in Table 3. As can be seen, parameters obtained for NC differ from the values determined for HAs isolated from unamended and amended soils. The lowest EET/EBz ratio was determined for NC-HA, the highest for NC487-3-HA. This means that this ratio increases with NC amendment and for years after compost application. The E4/E6 ratio for NC-HA was larger than that for any soil HAs, whereas the values for amended soil HAs were higher 1 and 2 years after compost application than the corresponding values for NC0-HA. The E4/E6 ratios for HAs isolated 3 years after soil amendment were smaller than those for NC0-HA. These results suggest the humification of organic matter in the soil. The optical parameter Δ Log K for NC-HA was larger than that for unamended and amended soils, whereas Δ Log K values for amended soil HAs were larger 1–2 years after compost incorporation than those for HAs isolated from control soils. The highest value of the E4/E6 ratio was obtained for NC-HA. The E4/E6, E2/E3 and Δ Log K ratios were constant in over time for NC0-HA and decreased gradually for HAs isolated from all studied amended soils.
Spectroscopic properties of HAs isolated from the control soil (NC0), NC and NC-amended soil
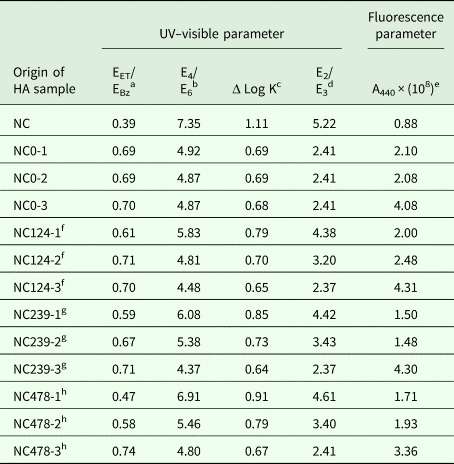
a Ratio of absorbances at 253 and 203 nm in the UV spectrum.
b Ratio of absorbances at 465 and 665 nm in the Vis spectrum.
c Difference of Log absorbances at 400 and 600 nm in the Vis spectrum.
d Ratio of absorbances at 250 and 365 nm in the UV spectrum.
e Milori index: area under fluorescence emission spectra with λ exc = 440 nm.
f Soils amended with NC at a rate of 124 t/ha sampled 1, 2 and 3 years after compost application, respectively.
g Soils amended with NC at a rate of 239 t/ha sampled 1, 2 and 3 years after compost application, respectively.
h Soils amended with NC at a rate of 478 t/ha sampled 1, 2 and 3 years after compost application, respectively.
Fourier-transform infrared spectroscopy
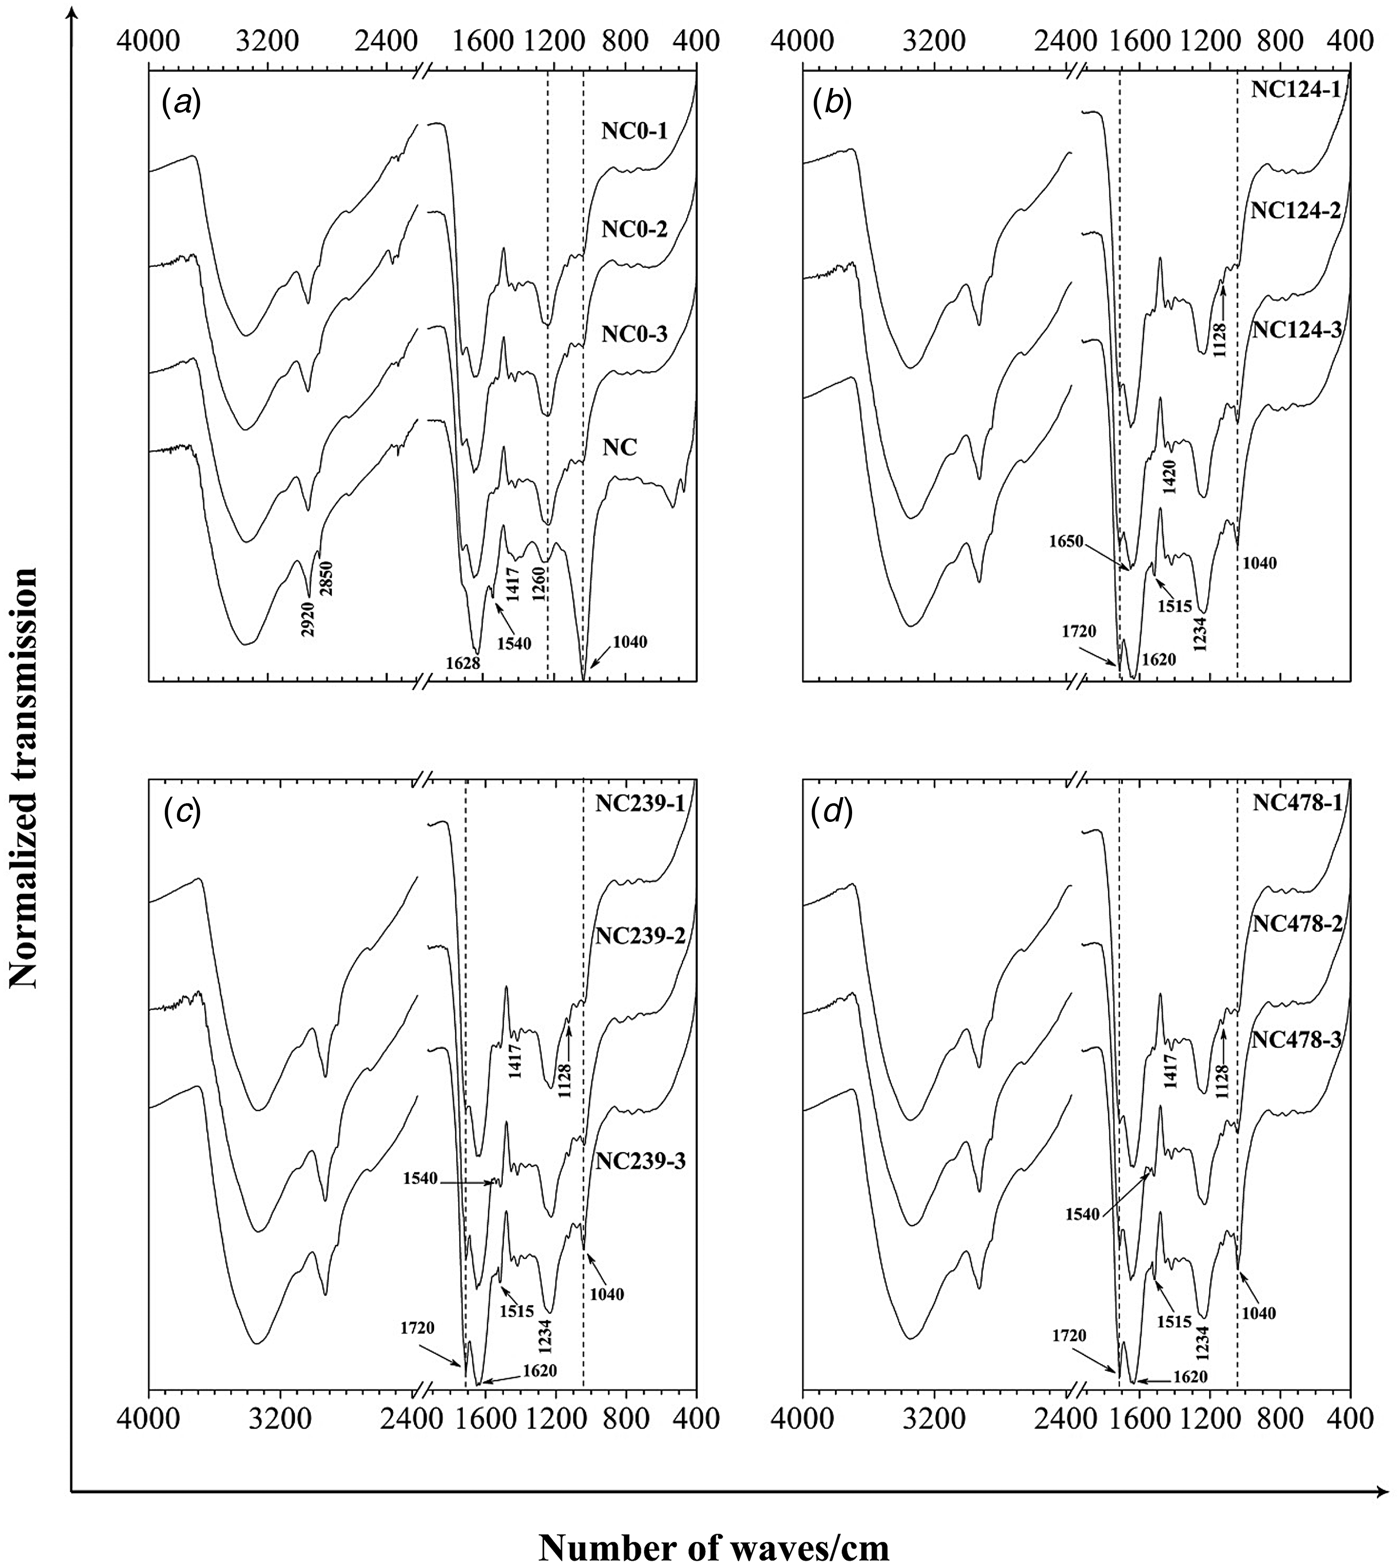
The ATR-FTIR spectra of HAs isolated from soils amended with 124, 239 and 478 t/ha of compost are shown in Fig. 1(b)–(d), together with those of NC-HA and NC0-HA Fig. 1(a). The main features of these spectra can be described as follows: an intensive broad band at about 3400–3300/cm is present in all spectra and is attributed to H-bonded OH groups and, secondarily, to the N–H stretching of various functional groups. The band and the shoulder occurring at about 2935–2925 and 2850/cm are ascribed to the asymmetric and symmetric C–H stretching of CH2 groups and are more intensive in NC-HA than in soil HAs. An intensive band is apparent at 1715–1710/cm, due to the C = O stretching of COOH, the relative intensity of which increases with years after compost application. An intensive broadband with two peaks occurs in the region between 1650 and 1620/cm and is the result of aromatic C = C skeletal vibrations, the C = O stretching of quinone and amide groups (amide I band) and the C = O stretching of H-bonded conjugated ketones, which is relatively less intensive in NC-HA than in soil HAs. A band or shoulder is present at around 1540/cm, which is ascribed to N–H deformation and the C = N stretching of amides (amide II band), which is more intensive in NC-HA than in soil HAs. A band is apparent at 1520–1515/cm, due to the aromatic C = C stretching of lignin residues, the relative intensity of which increases with years after compost application. A band at about 1460/cm, attributed to aliphatic C–H, is evident exclusively in sample NC-HA and appears as a weaker band in soil HAs. A band at about 1420/cm, preferentially ascribed to O–H deformation and C–O stretching of phenolic OH, is apparent in all samples. A band at about 1376–1373/cm, is possibly the result of the C–H deformation of CH2 and CH3 groups and/or to the asymmetric stretching of COO − groups, which is relatively more intensive in NC0-HA. An intensive broad band at about 1280–1220/cm is generally ascribed to the C–O stretching and O–H deformation of COOH groups and the C–O stretching of aryl ethers and phenols, which is more intensive in soil HAs than in NC-HA. A faint band or shoulder at 1129–1127/cm, attributed to the C–O stretching of various alcoholic and ether groups, is present in all spectra. Further, a band appearing at 1080/cm is assigned to the silicate impurities (Si–O stretching vibration). Finally, a variable absorption band at about 1040/cm, which is generally attributed to the C–O stretching of polysaccharides and polysaccharide-like substances and/or Si–O silicate impurities, which is relatively more intensive in NC-HA than in soil HAs. The ATR-FTIR spectra of HAs isolated from NC-amended soils are similar to one another and to those of NC0-HA.
ATR-FTIR spectra of humic acids isolated from: (a) control soil after 1, 2 and 3 years (NC0-1, NC0-2 and NC0-3) and compost (NC); (b) soils amended with 124 t/ha of compost for 1, 2 and 3 years (NC124-1, NC124-2 and NC124-3); (c) soils amended with 239 t/ha of compost for 1, 2 and 3 years (NC239-1, NC239-2 and NC239-3); and (d) soils amended with 478 t/ha of compost for 1, 2 and 3 years (NC478-1, NC478-2 and NC478-3).

Fluorescence spectroscopy
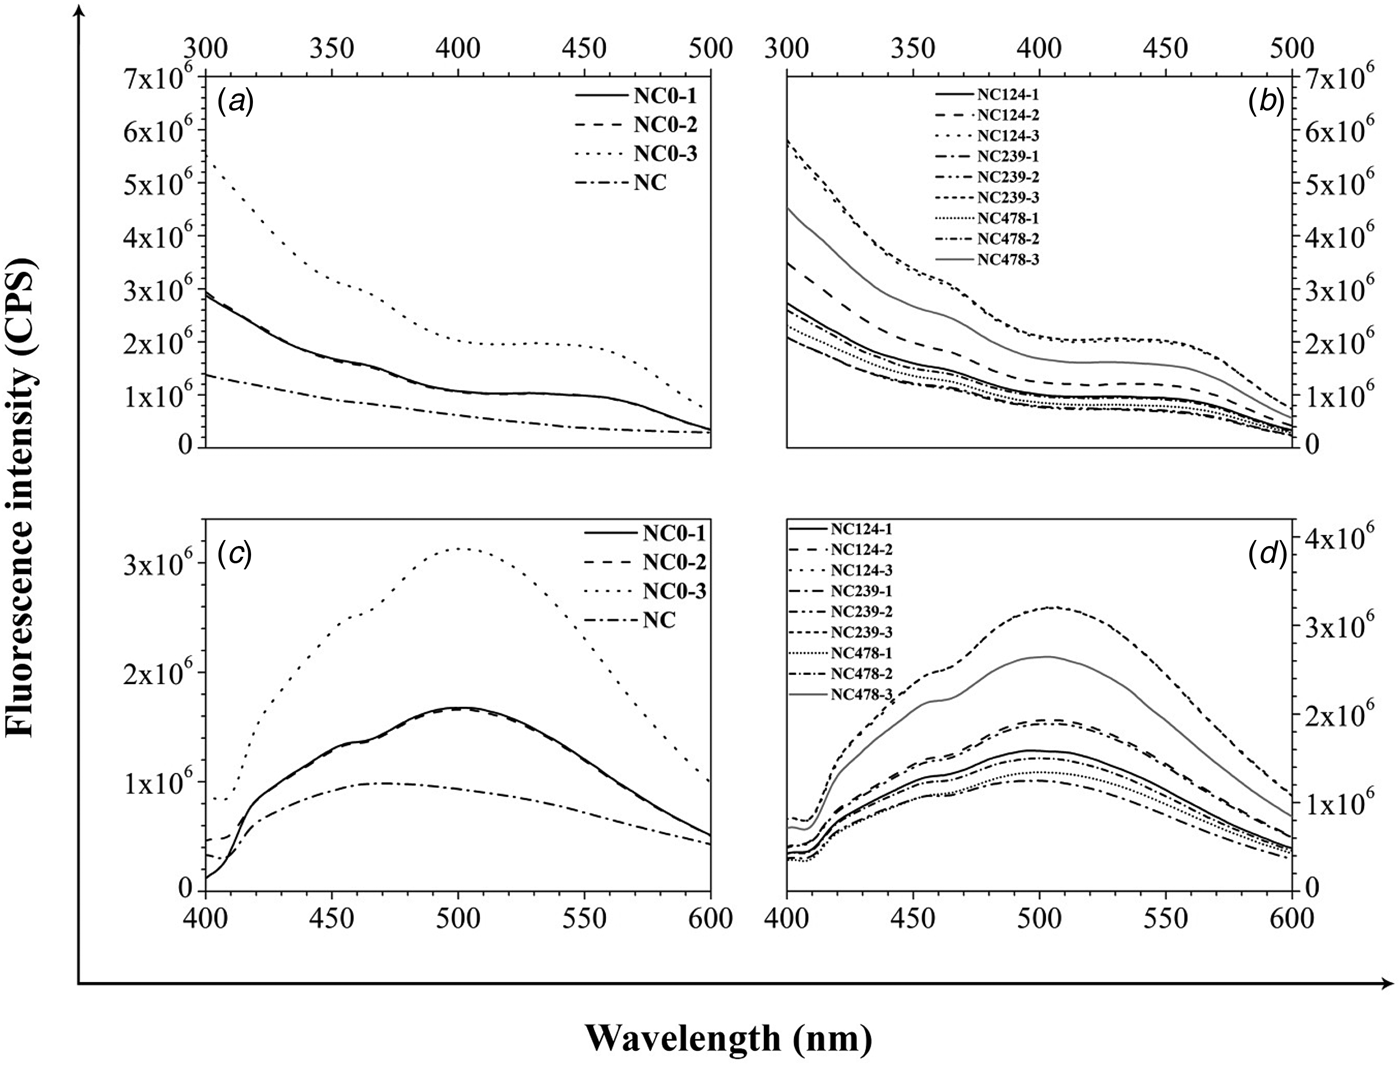
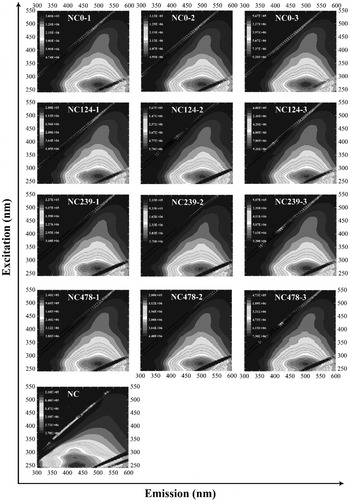
The value of the corrected fluorescence intensity (CFI) of NC-HA is much lower than that of NC0-HAs, whereas the CFI values of HAs isolated from NC-amended soils are larger and decrease with increasing amounts of compost added to the soil. The fluorescence emission, excitation and EEM spectra of the examined HAs are shown, respectively, in Figs 2 and 3. Representative fluorescence emission spectra of control soil HAs, NC-HA (Fig. 2(c)) and NC-amended soil HAs (Fig. 2(d)) are shown in Fig. 2. The main feature of the emission spectra is a unique, typical, broadband with its maximum centred at a wavelength that is shorter for NC-HA (470 nm) than for any soil HAs (496–507 nm). Natural compost-amended soil HAs feature an emission maximum at a slightly longer wavelength than that of the emission maximum for NC0-HA.
Fluorescence excitation and emission spectra of HAs isolated from (a, c) control soil after 1, 2 and 3 years and compost (NC); (b, d) soils amended with compost at the rates of 124, 239 and 478 t/ha sampled 1, 2 and 3 years after compost application.

Fluorescence excitation-emission matrices (EEMs) of HA samples isolated from compost (NC); control soil after 1, 2 and 3 years (NC0-1, NC0-2 and NC0-3); soils amended with 124 t/ha of compost for 1, 2 and 3 years (NC124-1, NC124-2 and NC124-3); soils amended with 239 t/ha of compost for 1, 2 and 3 years (NC239-1, NC239-2 and NC239-3); and soils amended with 478 t/ha of compost for 1, 2 and 3 years (NC478-1, NC478-2 and NC478-3).

The fluorescence excitation spectra of control soil HAs, NC-HA (Fig. 2(a)) and NC-amended soil HAs (Fig. 2(b)) are shown in Fig. 2. The fluorescence excitation spectrum of NC-HA is featureless and characterized by the absence of identifiable maxima with decreasing fluorescence intensity at increasing acquisition excitation wavelength. The excitation spectra of NC0-HA feature one prominent band at a longer wavelength (363–364 nm) and a less intensive peak at 428–431 nm. The excitation spectra of NC-amended soil HAs are similar to one another and to those of NC0-HAs. However, with respect to NC0-HAs, NC-amended soil HAs exhibit a less intensive major band in the intermediate-wavelength region (357–365 nm) and a minor band at 420–437 nm.
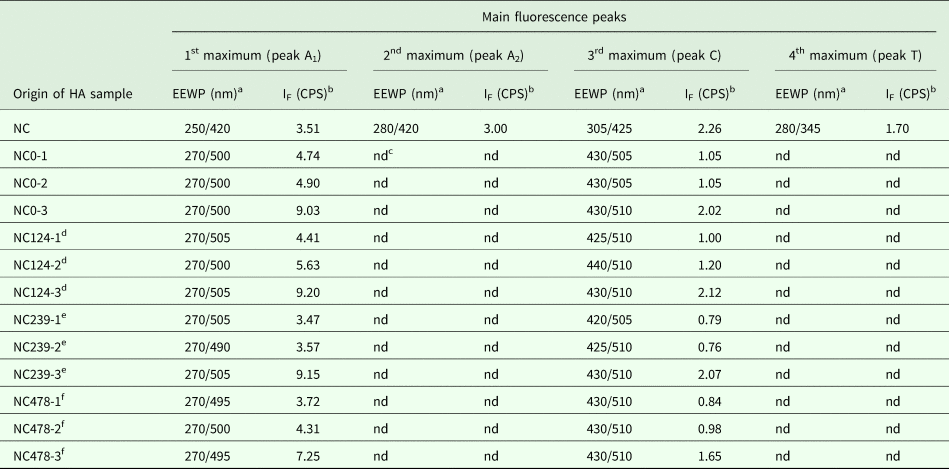
Figure 3 shows the fluorescence spectra (EEM contour maps) of the HAs in the current study. The fluorescence EEM spectrum of NC-HA is characterized by four unique fluorophores centred at excitation/emission wavelength pairs (EEWP) of 250/420, 280/420, 305/425 and approximately 270/350 nm, the last appearing as a less intensive peak. The presence of peak C (humic-like organic compounds) centred at the EEWP of 305/425 nm indicates the formation of HAs in compost. The fluorescence EEM spectra of NC0-HAs are characterized by two prominent fluorescence maxima at the excitation/emission wavelength pairs of 270/500 nm and 430/505–510 nm. The EEM spectra of NC-amended soil HAs feature EEWPs with similar excitation/emission wavelengths as those of the EEWPs of NC0-HAs. The values of the fluorescence intensities and excitation/emission wavelength pairs of the main peaks in the EEM spectra are presented in Table 4. The Milori index is capable of reflecting very accurately the humic features of the different HAs considered; this is evident from Table 3. The smallest degree of humification was observed in NC-HA. The Milori index values for NC-amended soil HAs increased with increasing years after compost application.
Position of the excitation-emission wavelength pairs of the main peaks and values of fluorescence intensities of HAs isolated from the control soil (NC0), NC and NC-amended soil
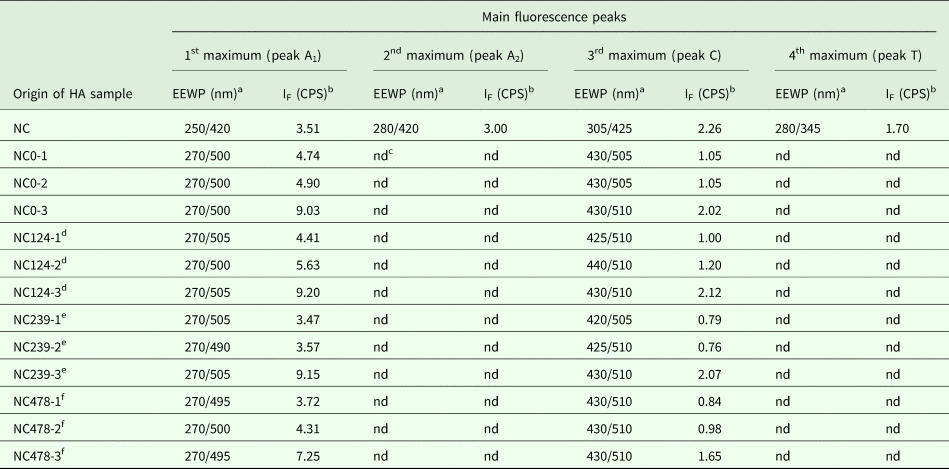
a Excitation/emission wavelength pair (λ ex/λ em) at the maximum fluorescence intensity.
b IF × 106 CPS (counts per second) of main fluorescence peaks.
c Not detected.
d Soils amended with NC at a rate of 124 t/ha sampled 1, 2 and 3 years after compost application, respectively.
e Soils amended with NC at a rate of 239 t/ha sampled 1, 2 and 3 years after compost application, respectively.
f Soils amended with NC at a rate of 478 t/ha sampled 1, 2 and 3 years after compost application, respectively.
Discussion
It was found that the extraction yield for the NC-HA sample was much higher than that for the NC0-HA sample, whereas the yields of NC-amended soil HAs were higher than those of HAs isolated from control soil. These results are in general agreement with previous studies of compost HAs and unamended and amended soil HAs (Plaza et al., Reference Plaza, Senesi, Polo, Brunetti, García-Gil and D'Orazio2003; García-Gil et al., Reference García-Gil, Plaza, Fernández, Senesi and Polo2008).
The application of compost resulted in an increase in H and N contents and a decrease in C and O contents in NC-amended soil HAs, especially 1 year after soil amendment, which resulted in a diminution of the C/H, C/N and O/C ratios. The increase in N contents may feasibly be attributed to the incorporation of N-containing functional groups of a proteinaceous nature into native soil humic molecules (Campitelli et al., Reference Campitelli, Velasco and Ceppi2006; Pedra et al., Reference Pedra, Plaza, Fernández, García-Gil and Polo2008). In agreement with data published previously on similar types of soil HAs (Senesi et al., Reference Senesi, Plaza, Brunetti and Polo2007), these results suggest a decrease in C/H, C/N and O/C ratios with the organic amendment.
The UV/Vis absorbance spectra of HAs isolated from all studied samples were featureless and characterized by the absence of identifiable maxima and/or minima with decreasing absorbance at increasing acquisition wavelength. The same trend may be observed in humic substances isolated from soils and composts of different origin (Chen et al., Reference Chen, Gu, LeBoeuf, Pan and Dai2002; Fuentes et al., Reference Fuentes, González-Gaitano and García-Mina2006; Aranda et al., Reference Aranda, Ayora-Cañada, Domínguez-Vidal, Martín-García, Calero, Delgado, Verdejo and González-Vila2011). Humic acids generally show strong absorbance in the UV/Vis range, particularly in the UV region, because of the presence of chromophores containing aromatic groups with various degrees and types of substitution such as mono- and/or poly-substituted phenols and different aromatic acids (Korshin et al., Reference Korshin, Li and Benjamin1997). The EET/EBz ratio (the ratio of absorbance at 253 nm to that at 203 nm) is low for compounds in which the aromatic rings are largely substituted with aliphatic functional groups, whereas higher EET/EBz ratios are associated with the presence of O-containing functional groups e.g. hydroxyl, carbonyl, ester and especially carboxyl groups on the aromatic ring (Korshin et al., Reference Korshin, Li and Benjamin1997; Morán Vieyra et al., Reference Morán Vieyra, Palazzi, Sanchez de Pinto and Borsarelli2009; Valencia et al., Reference Valencia, Marín, Restrepo and Frimmel2013). These results suggest that the substitution of aromatic rings with aliphatic functional groups is higher for NC-HAs than for HAs obtained from unamended and amended soils (Morán Vieyra et al., Reference Morán Vieyra, Palazzi, Sanchez de Pinto and Borsarelli2009). On the other hand, higher EET/EBz ratios for HAs isolated from control and amended soils are associated with the presence of aromatic rings substituted with polar groups such as hydroxyl, carbonyl, ester and carboxyl functional groups (Fuentes et al., Reference Fuentes, González-Gaitano and García-Mina2006). Furthermore, in the current study, HAs isolated 3 years after soil amendment with the two larger NC doses (NC239 and NC478) exhibited EET/EBz ratios greater than the corresponding ratios for control soil HAs. The frequently used E4/E6 and E2/E3 ratios reflect the degree of aromaticity and the molecular weight of HAs of different origins. It is obvious that differences between the absorption ratios for NC-HA and for HAs obtained from unamended and amended soils are enough for UV/Vis ratios to be used in determining the degree of aromaticity or molecular weight. The E4/E6 and E2/E3 ratios for NC-HA were much larger than those for HAs isolated from control soil, whereas the values for amended soil HAs increased as a consequence of NC application. In contrast, the absorption coefficients for HAs obtained from amended soils decreased 2 and/or 3 years after compost application. Higher values of the absorption ratios (E4/E6, E2/E3 and Δ log K) for NC-HA are associated with the presence of lower molecular weight and/or more aliphatic structures. According to the optical parameter Δ log K, HAs obtained from the unamended and amended soils used in the current study were similar to types A and/or B in Kumada's classification system (Kumada, Reference Kumada and Kumada1987). These types of HAs, especially type A, are characterized by higher stability, a higher degree of aromaticity and relatively lower concentration of aliphatic structures when compared with NC-HA (Barančíková et al., Reference Barančíková, Senesi and Brunetti1997; Rivero et al., Reference Rivero, Chirenje, Ma and Martinez2004; Uyguner and Bekbolet, Reference Uyguner and Bekbolet2005). These results suggest the incorporation of structural units of NC-HA into soil HAs (Senesi et al., Reference Senesi, Plaza, Brunetti and Polo2007).
The assignment of the main infrared spectral bands in HAs is based on references (Hay and Myneni, Reference Hay and Myneni2007; Senesi et al., Reference Senesi, Plaza, Brunetti and Polo2007; Droussi et al., Reference Droussi, D'orazio, Provenzano, Hafidi and Ouatmane2009; Barje et al., Reference Barje, El Fels, El Hajjouji, Amir, Winterton and Hafidi2012). The main differences among the spectra of NC-HA and HAs obtained from unamended and amended soils are in the regions 1720–1600/cm, 1550–1500/cm and 1040/cm. The first region is characterized by two sharp bands at 1720/cm and 1650–1620/cm corresponding to the C = O vibration in carboxylic acids and to the C = C stretching of aromatic rings and/or the C = O stretching of amide I units, respectively. In contrast with other samples, NC-HA did not contain the vibrations at 1720/cm. The band at 1720/cm is dominant in the spectra of HAs isolated from amended soil, mainly due to the contents of carboxylic acids. The latter region is characterized by sharp and/or weak bands at 1540/cm and 1515/cm corresponding to the N–H bending and C–O stretching of amide II groups and to C = C stretching in the aromatic ring. The band at 1540/cm is more evident in FTIR spectra of HAs obtained from the amended soil than in spectra of control HAs. In contrast with other samples, the HAs from NC did not contain the specific vibrations at 1515–1510/cm. The band at 1040/cm is most probably associated with C–O stretching vibrations in polysaccharides and/or polysaccharides-like groups; although a contribution from primary alcohol and silica cannot be excluded in this region. The ATR-FTIR spectra of HAs isolated from amended soils showed a pronounced polysaccharide and/or polysaccharide-like band that was evident in soil HAs 2 and/or 3 years after compost application. In agreement with data published previously on similar types of humic substances (Olsen et al., Reference Olsen, Endelman, Jacobson and Reeve2015), the polysaccharides present in compost are primarily of plant and microbial origin. The results of ATR-FTIR analysis agree with those obtained by means of elemental composition and absorption ratios, suggesting a prevalent aliphatic structure, a larger presence of N-containing groups (band amide I, II) and lower contents of carboxyl and carbonyl functional groups in NC-HA in comparison soil HAs (García-Gil et al., Reference García-Gil, Plaza, Senesi, Brunetti and Polo2004a, Reference García-Gil, Ceppi, Velasco, Polo and Senesi2004b; Pedra et al., Reference Pedra, Plaza, Fernández, García-Gil and Polo2008). Furthermore, the trends of absorption bands and their relative intensities confirm those of compositional data according to which the spectra of HAs obtained from amended soil are more similar to spectra of HAs isolated from NC than to spectra of control HAs (Brunetti et al., Reference Brunetti, Plaza, Clapp and Senesi2007; Bertoncini et al., Reference Bertoncini, D'Orazio, Senesi and Mattiazzo2008).
Fluorescence spectroscopy was used as a technique for classifying and distinguishing between humic substances of different origins and natures (Kalbitz et al., Reference Kalbitz, Geyer and Geyer2000; Chen et al., Reference Chen, Gu, LeBoeuf, Pan and Dai2002). Individual EEM spectra are characterized by peaks of maximum intensity which differ in their number and positions and correspond to specific fluorophores or fluorophore families (Senesi et al., Reference Senesi, Miano, Provenzano and Brunetti1991). From the domains described, the fluorescence of HAs lies predominantly in the region of peak A (peak A1 and A2), which is characteristic of HAs (Coble, Reference Coble1996; McKnight et al., Reference McKnight, Boyer, Westerhoff, Doran, Kulbe and Andersen2001; Sierra et al., Reference Sierra, Giovanela, Parlanti and Soriano-Sierra2005; Rodríguez et al., Reference Rodríguez, Schlenger and García-Valverde2014). In general, the peaks at intermediate excitation wavelengths (250–280 nm) and longer emission wavelengths (>380 nm) are related to fulvic-like organics (Coble, Reference Coble1996; Peiris et al., Reference Peiris, Budman, Moresoli and Legge2011). Region A, referred to as the fulvic-like region, is associated with the presence of polycyclic aromatics with three to four fused benzene rings and two to three conjugated systems in unsaturated aliphatic structures (He et al., Reference He, Xi, Wei, Guo, Li, An and Liu2011). The different components derived from lignin and other degraded plant tissues are possible contributors to the fluorescence of fulvic-like fluorophores (Albrecht et al., Reference Albrecht, Verrecchia and Pfeifer2015). The maxima at 305–440/425–510 nm for the current sample set represent isolated fluorophores in the visible region; therefore, the maximum of this fluorescence domain has been denoted as peak C (humic-like). The peaks at longer excitation wavelengths (>280 nm) and longer emission wavelengths (420–540 nm) are related to humic-like organic compounds (Alberts and Takács, Reference Alberts and Takács2004; Parlanti et al., Reference Parlanti, Wörz, Geoffroy and Lamotte2000; Birdwell and Engel, Reference Birdwell and Engel2010). Region C, denoted as the humic-like region, corresponds to polycyclic aromatics with five to seven fused benzene rings (Chen et al., Reference Chen, Westerhoff, Leenheer and Booksh2003). For HA isolated from NC, a typical maximum lies within the T region and is thus restricted to wavelengths at 280/345 nm. Protein-like organic materials are labile organics under microbial activity and are predominant, e.g. wastewater, compost, manure, municipal solid waste etc. (Marhuenda-Egea et al., Reference Marhuenda-Egea, Martínez-Sabater, Jordá, Moral, Bustamante, Paredes and Pérez-Murcia2007; Hudson et al., Reference Hudson, Baker, Ward, Reynolds, Brunsdon, Carliell-Marquet and Browning2008; Wan et al., Reference Wan, Xi, Xia, Li, Iv, Wang and Song2012; Yu et al., Reference Yu, Song, Tu, Du, Liu and Peng2013). The EEM data for excitation wavelengths shorter than 280 nm and for intermediate emission wavelengths (345–360 nm) are related to protein-like compounds, including tryptophan-like materials (Coble, Reference Coble1996; Henderson et al., Reference Henderson, Baker, Murphy, Hambly, Stuetz and Khan2009). The protein-like region indicates the presence of proteinaceous materials and monoaromatic compounds (dos Santos et al., Reference dos Santos, Simões, de Melo, Martin-Neto and Pereira-Filho2010). The prevalence of fluorescence peaks and of bands with low CFI at short wavelengths, such as those measured for the peaks of NC-HA, is associated with the presence of structures of wide molecular heterogeneity and small molecular weight, a small degree of aromatic polycondensation, a small level of conjugated chromophores and a small degree of humification (Senesi et al., Reference Senesi, Miano, Provenzano and Brunetti1991). Lower CFI values for NC-HA may be ascribed to more complex structures, but also to higher contents of metals, which presumably reduce the fluorescence intensity by quenching phenomena (Traversa et al., Reference Traversa, D'Orazio, Mezzapesa, Bonifacio, Farrag, Senesi and Brunetti2014). In contrast, the long wavelengths and large CFI of prominent peaks of HAs obtained from unamended and amended soils may be ascribed to the presence of extended, linearly-condensed aromatic ring networks and of other unsaturated bond systems capable of a great degree of conjugation with respect to large molecular sizes and extensively humified macromolecules (Senesi et al., Reference Senesi, Miano, Provenzano and Brunetti1991). The position of peak C (humic-like) in the region of excitation wavelengths (420–440 nm) for HAs isolated from control and amended soils suggests that carboxylic groups predominate over phenolic groups (Rodríguez et al., Reference Rodríguez, Schlenger and García-Valverde2014).
According to the EEM spectra, fulvic- and/or humic-like organic compounds were the main components of the current sample set. In the current study, a tryptophan-like compound was one of the main components in HA isolated from NC.
To determine the degree of aromaticity and humification in humic substances by means of steady-state fluorescence spectroscopy, the Milori index was used (Milori et al., Reference Milori, Martin-Neto, Bayer, Mielniczuk and Bagnato2002). Higher values of the Milori index reflect higher degrees of aromaticity and humification. For HA isolated from NC in the current study, the calculated fluorescence parameter was 0.88, indicating a low degree of aromaticity and humification. In the present study, Milori index values for HAs obtained from amended soil ranged between 1.48 and 4.31 and increased with time after compost application. Differences among the values of control HAs and HAs obtained from amended soil 1 and 2 years after compost application suggest that the HAs isolated from amended soil have a higher degree of aromaticity. This assumption is consistent with the values of the absorption coefficients E4/E6, E2/E3 and Δ log K obtained from the spectrometry experiments.
In the current study, different yields of HAs ranging from 3.5 g/kg to 18.5 g/kg were extracted from NC and soils. The HA isolated from NC had a predominantly aliphatic character and a low degree of aromaticity and humification. The nitrogen content of NC-HA was relatively large and included nitrogen functional groups such as amides (including protein-like components). The EEM spectrum of NC-HA shows that fluorophores occur predominantly in regions A (fulvic-like) and T (tryptophan-like) and these maxima are in the range 240–280/400–500 nm and 270–280/345–360 nm, while, HAs obtained from amended soil have a considerable aromatic character, a larger molecular weight and higher degrees of aromaticity and humification. Further, the oxygen contents of HAs isolated from amended soil were shown to have increased 2 and 3 years after compost application. The results of UV/Vis and FTIR spectroscopy suggest that the substitution of aromatic rings with oxygen-containing functional groups such as carboxylic, hydroxyls (including phenols and primary alcohols) and ethers was greater for HAs obtained from amended soil. Uniquely, the HAs isolated from amended soil also contain maxima in the C (humic-like) region which are in the range 430–450/500–540 nm. The EEM spectra of HAs can be used as fingerprints to distinguish between HAs isolated from different origins, i.e. soil and compost.
Financial Support
This work was supported by project Nr. LO1211, Materials Research Centre at FCH BUT-Sustainability and Development (National Programme for Sustainability I, Ministry of Education, Youth and Sports).
Conflict of interest
None.
Ethical standards
Not applicable.